

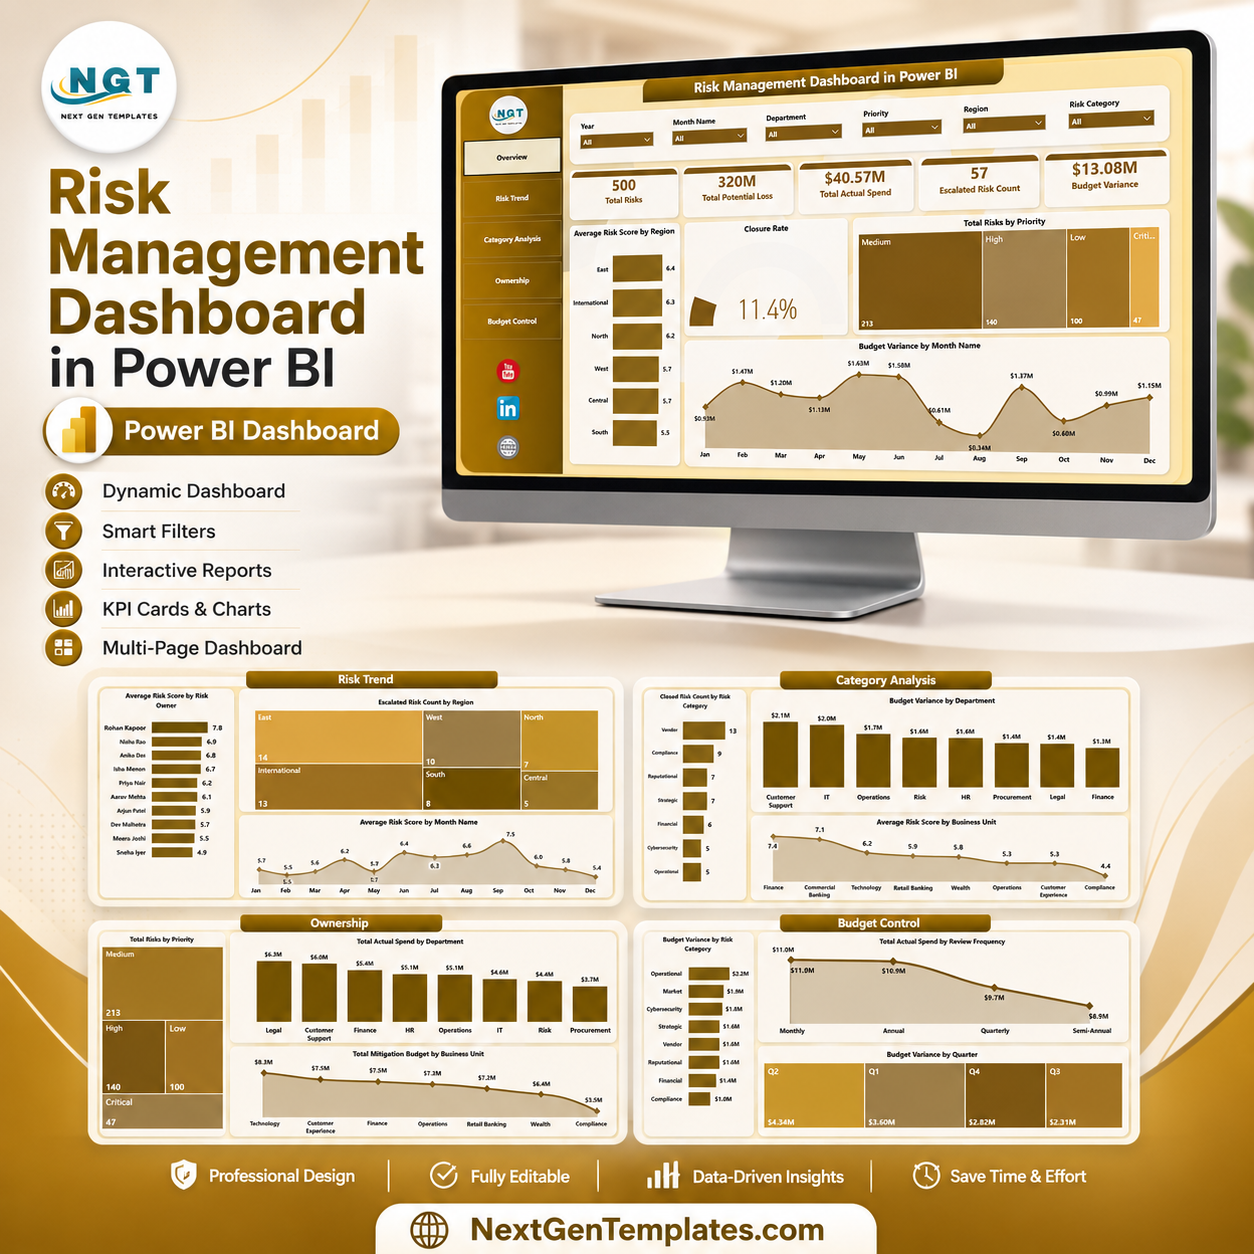

Risk Management Dashboard in Power BI helps risk owners, finance teams, operations leaders, and compliance managers turn scattered risk records into five interactive report pages. Allianz Commercial’s 2026 Risk Barometer ranks cyber incidents as the top global business risk for the fifth year in a row, with 42% of responses, while business interruption remains a top-three concern. Built by PK for a 300K+ subscriber learning audience, this one-time downloadable PBIX template gives you a practical risk reporting structure, instant file access, and a clear starting point without a recurring SaaS subscription.
Key Features of Risk Management Dashboard in Power BI
- Five Power BI report pages: Overview, Risk Trend, Category Analysis, Ownership, and Budget Control.
- Executive KPI cards: Total Risks, Total Potential Loss, Total Actual Spend, Escalated Risk Count, and Budget Variance.
- Risk scoring views: Compare average risk score by region, owner, month, and business unit.
- Escalation tracking: Review escalated risk count by region and keep high-priority exposure visible.
- Budget control analysis: Monitor budget variance by month, quarter, department, business unit, review frequency, and risk category.
- Closure and category analysis: Review closure rate, closed risk count, risk category movement, and priority distribution.
- Interactive slicers: Filter the report quickly during leadership, risk committee, finance, and department review meetings.
- Editable PBIX file: Open in Power BI Desktop, replace the sample data, refresh, and customize visuals, measures, labels, and pages.
What’s Inside the Risk Management Dashboard in Power BI
1 – Overview Page
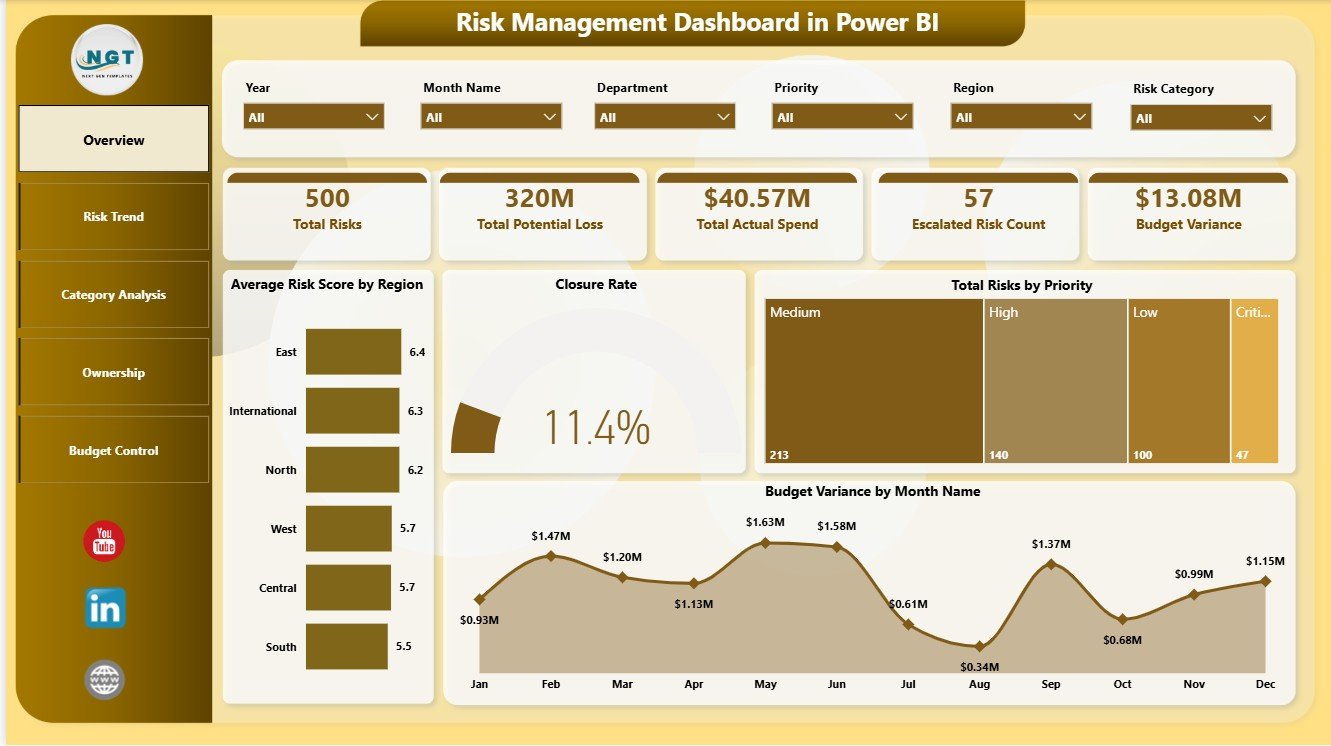
The Overview page gives a high-level view of risk exposure using Total Risks, Total Potential Loss, Total Actual Spend, Escalated Risk Count, and Budget Variance cards. Multiple slicers help users filter the dashboard quickly by the available risk fields during review meetings.
Average Risk Score by Region: This chart compares risk severity across regions. It helps leaders see where exposure is concentrated and where mitigation review may be needed.
Closure Rate by Total Risks: This chart connects closure performance with total risk volume. It helps teams understand whether larger risk pools are being resolved at an acceptable pace.
Total Risks by Priority: This visual separates risks by priority level. It gives teams a fast view of how many risks are high, medium, or low priority.
Budget Variance by Month Name: This chart tracks monthly budget variance. It helps finance and risk teams see when mitigation spend is drifting above or below plan.
2 – Risk Trend
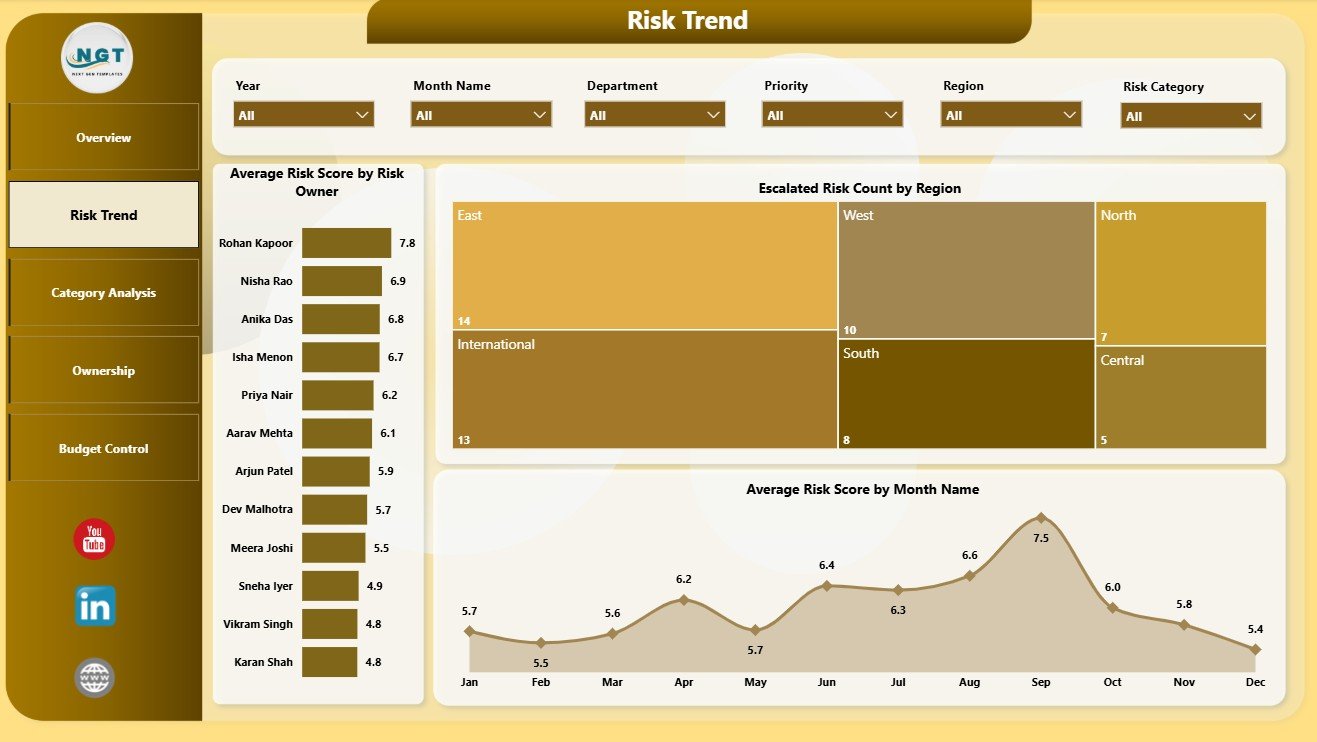
The Risk Trend page focuses on risk score movement, ownership, escalation, region, and monthly patterns. Average Risk Score by Risk Owner helps compare owner-level exposure. Escalated Risk Count by Region shows where escalations are concentrated. Average Risk Score by Month Name helps identify whether risk severity is improving or increasing over time.
3 – Category Analysis
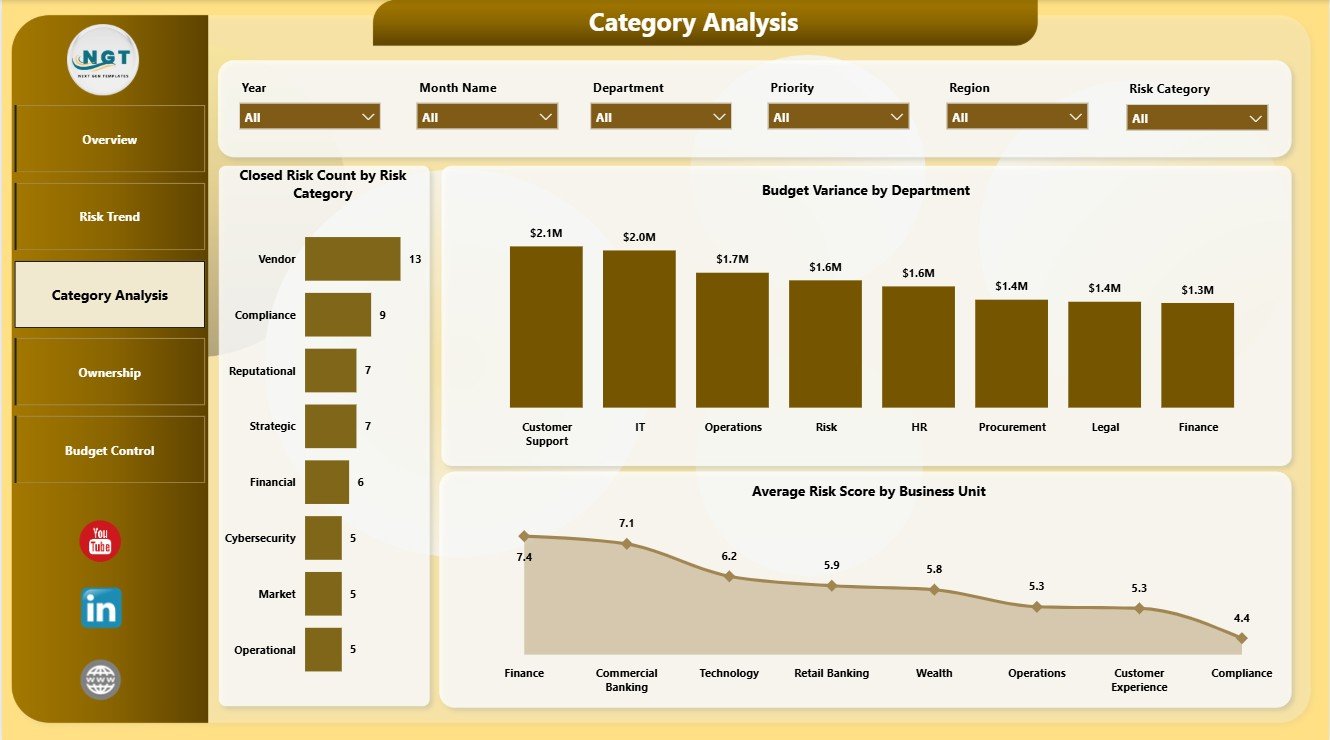
The Category Analysis page explains risk closure, department budget variance, and business unit risk score. Closed Risk Count by Risk Category shows which categories are being resolved. Budget Variance by Department highlights departments above or below plan. Average Risk Score by Business Unit helps compare exposure across business units.
4 – Ownership
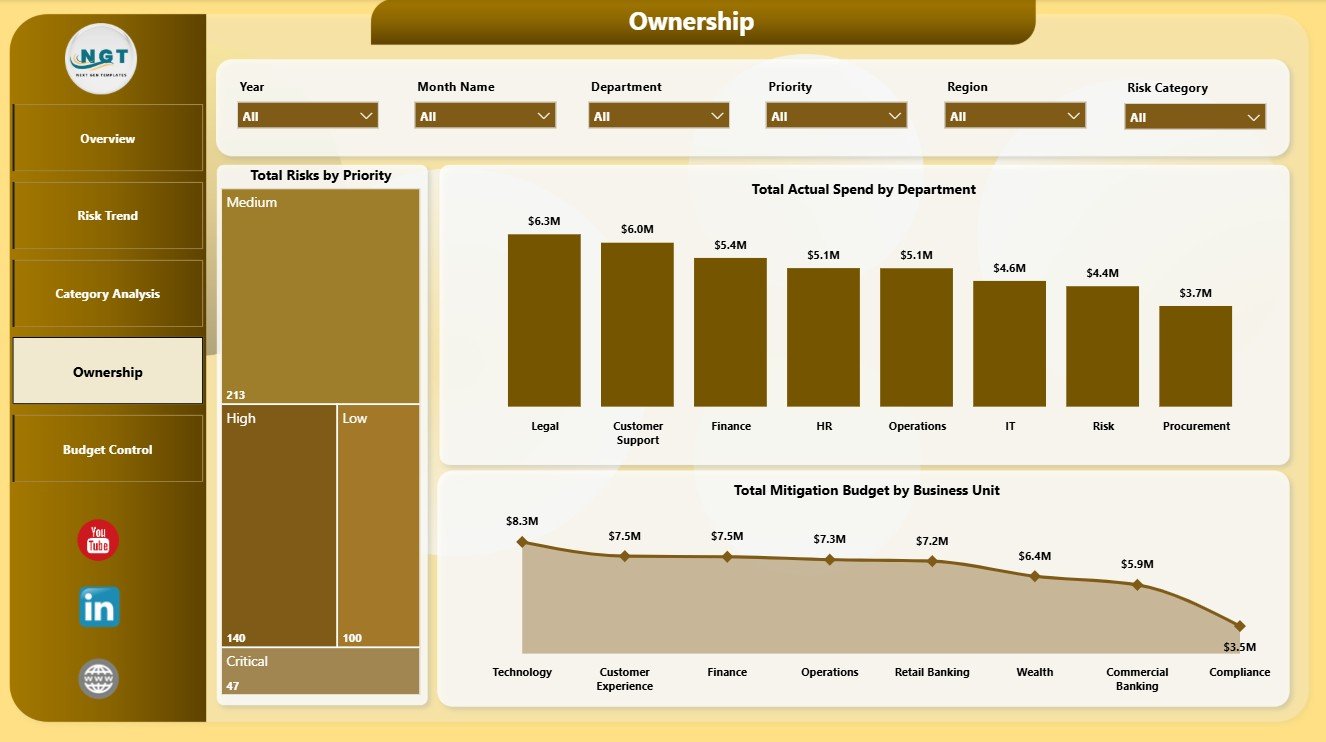
The Ownership page is designed for accountability review. Total Risks by Priority keeps priority distribution visible. Total Actual Spend by Department shows where mitigation money is being used. Total Mitigation Budget by Business Unit helps leaders compare planned investment across teams.
5 – Budget Control
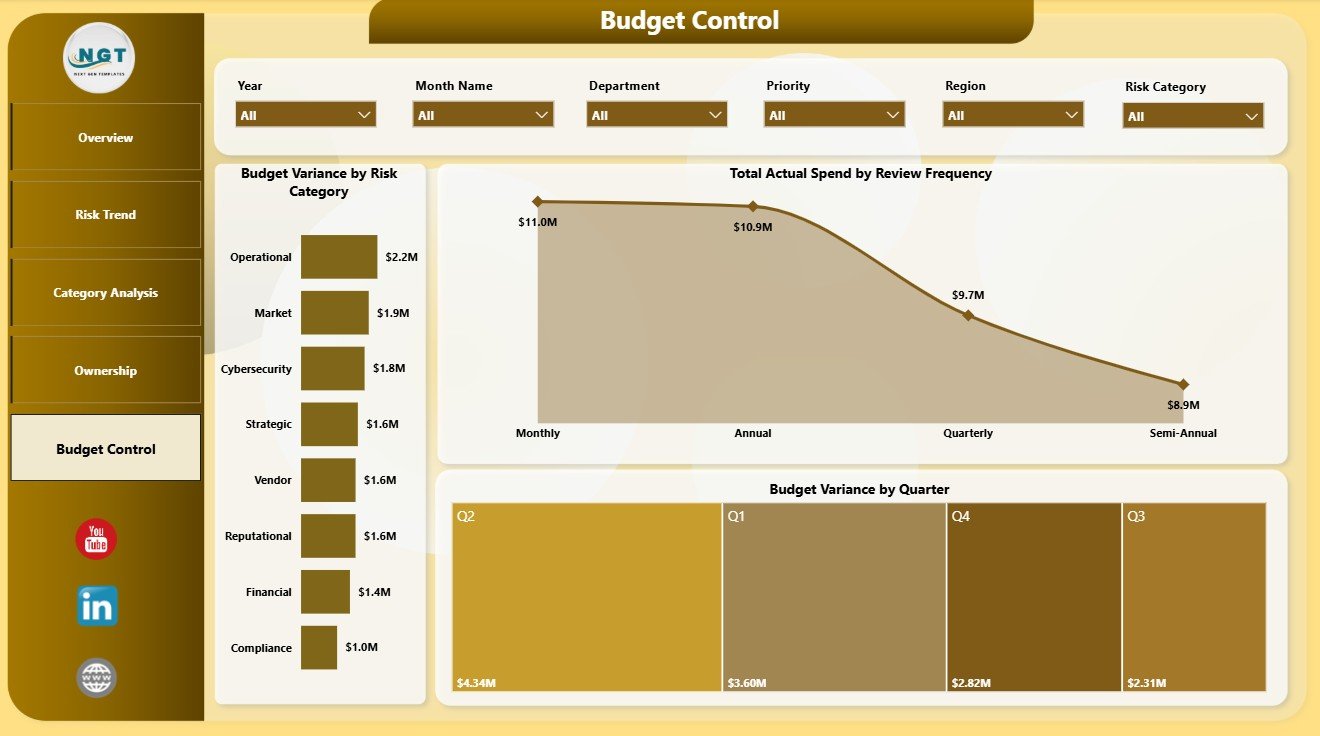
The Budget Control page supports finance and control reviews. Budget Variance by Risk Category shows which risk groups are driving overrun or underrun. Total Actual Spend by Review Frequency connects spend with review cadence. Budget Variance by Quarter helps teams monitor quarterly budget discipline.
Risk Management Dashboard in Power BI vs. Tableau vs. Paid CRM/SaaS – Where This Fits
| Feature | This Power BI dashboard | Tableau or Qlik alternative | Paid risk SaaS |
|---|---|---|---|
| Cost | $17.99 sale price, one-time | License cost plus build time | Recurring subscription |
| Platform | Power BI Desktop and optional Power BI Service | Tableau or Qlik environment | Vendor cloud platform |
| Setup time | Open PBIX, replace data, refresh | Build model and visuals manually | Implementation and configuration |
| Real-time team collaboration | Available through Power BI Service licensing | Available by plan | Usually included |
| Mobile access | Power BI mobile app after publishing | Vendor mobile app | Usually included |
| Customizable fields | Edit report pages, visuals, measures, and source connections | Editable with analyst skills | Limited by vendor settings |
| Share with link | Available through Power BI workspace permissions | Available through platform permissions | Usually login controlled |
| Year-1 cost at 5 users | Template price plus any Microsoft licensing | License cost plus analyst time | Often hundreds or thousands per year |
| Risk reporting focus | Built for risk score, priority, escalation, closure, spend, budget variance, owners, regions, departments, and business units | Requires custom design | Depends on vendor reporting module |
Who This Template Is For – and Who It’s Not For
This template is for risk managers, department heads, finance analysts, compliance coordinators, internal audit teams, PMO leaders, operations managers, and Power BI consultants who already have structured risk data and need a ready reporting layer.
It is not a full GRC platform, incident response system, control testing workflow, regulatory filing system, audit evidence repository, or automated risk scoring engine. Use it as a Power BI analytics template after your source data has been prepared.
How to Use the Risk Management Dashboard in Power BI
- Download and unzip the product file.
- Open the PBIX file in Power BI Desktop.
- Review the sample pages, cards, slicers, and visuals.
- Replace the sample data source with your own structured risk records.
- Refresh the report and validate Total Risks, Potential Loss, Actual Spend, Escalated Risk Count, and Budget Variance.
- Use slicers to filter by region, owner, department, business unit, priority, risk category, month, quarter, or review frequency.
- Publish to Power BI Service if your team needs browser access or scheduled refresh.
Real-World Use Cases
Priya, enterprise risk manager: uses the Overview and Risk Trend pages before monthly risk committee meetings to review scores, escalations, and regional exposure.
Marcus, finance business partner: opens Budget Control to compare mitigation budget, actual spend, and variance by quarter, department, and category.
Anita, operations leader: uses Ownership to review priority risks by department and business unit before assigning follow-up actions.
Frequently Asked Questions
What does this Power BI dashboard track?
It tracks total risks, potential loss, actual spend, escalated risks, budget variance, risk score, priority, closure rate, category, region, owner, department, business unit, month, quarter, and review frequency.
Do I need Power BI Desktop?
Yes. Open and edit the PBIX file in Power BI Desktop. Power BI Service is optional for sharing, browser viewing, and scheduled refresh.
Can I use my own risk data?
Yes. Replace or connect the sample data source with your structured risk records, then refresh the report.
Can I customize the dashboard?
Yes. You can edit visuals, pages, slicers, colors, labels, measures, relationships, and source connections.
Is this a full GRC system?
No. It is a reporting dashboard template, not a governance, risk, and compliance workflow platform.
Is this a subscription?
No. It is a one-time downloadable Power BI template purchase.
About the Author
Built by PK – Microsoft Certified Professional with 15+ years of Excel, Google Sheets, and Power BI experience. Founder of NextGenTemplates, reaching 300K+ subscribers across YouTube channels. Every template is hand-built and tested before release.
Explore Related Templates
You may also like Peer to Peer Insurance Dashboard in Power BI, Nursing Homes Dashboard in Power BI, Power BI Dashboard Mega Collection, and Online Certification Providers Dashboard in Power BI. Browse more Power BI templates and Power BI Dashboard templates.
Download the Risk Management Dashboard in Power BI and start reviewing risk score, escalation, closure, ownership, spend, and budget variance in one editable PBIX file.
Watch the demo video:
Compatibility and Requirements
- Works in Power BI Desktop, which is free. Microsoft explains how to get it in Get Power BI Desktop.
- Power BI Service is optional and is only needed for browser access, sharing and scheduled refresh.
Related Risk Management Templates
- Risk Management KPI Dashboard in Power BI: another risk reporting dashboard in Power BI
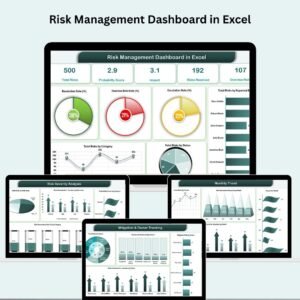
- Risk Management Dashboard in Excel: the Excel version of this dashboard
- Risk Management Dashboard in Google Sheets: the Google Sheets version
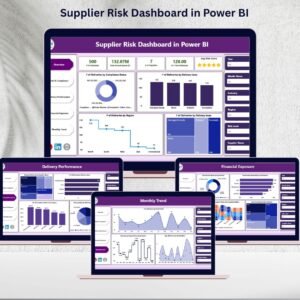
- Supplier Risk Dashboard in Power BI: risk reporting focused on suppliers
- Financial Risk KPI Dashboard in Power BI: a finance-focused risk view
Browse all Power BI dashboards.





























Reviews
There are no reviews yet.