

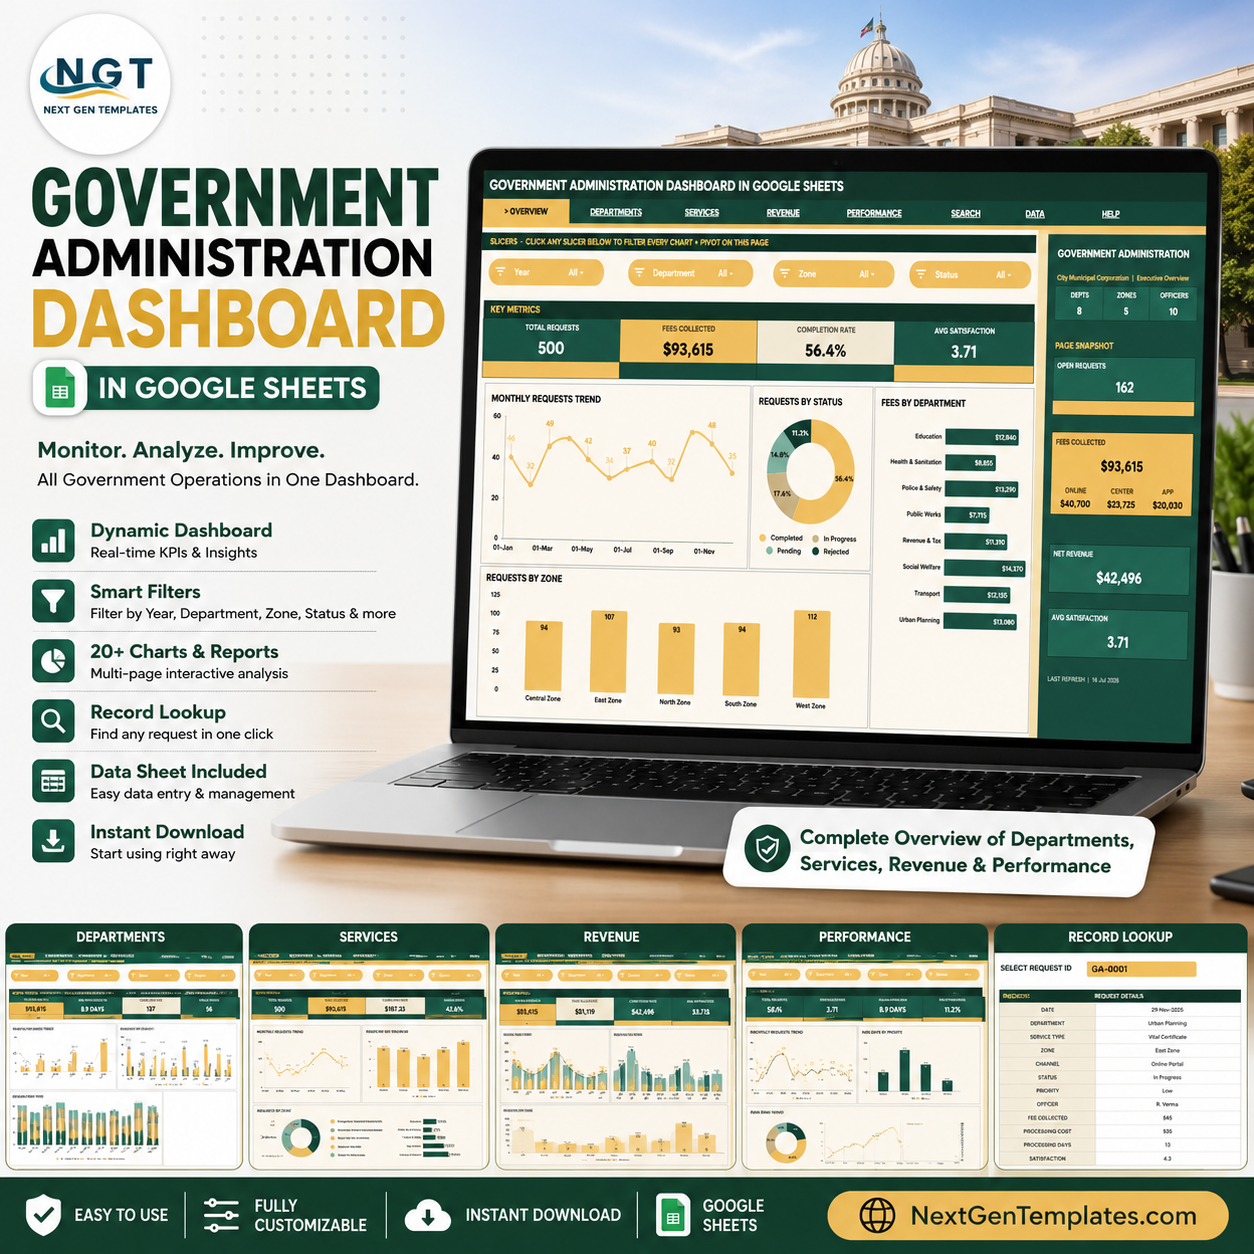

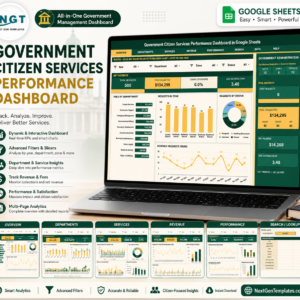
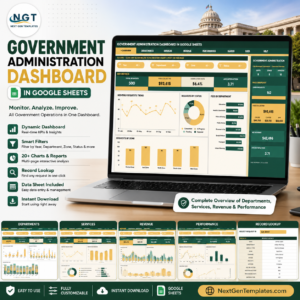
Government Administration Dashboard in Google Sheets turns public-service request data into 7 working tabs, 9 high-level KPI cards, 16 chart views, a Request ID lookup sheet, and a structured data sheet. Built by PK, a Microsoft Certified Professional with 15+ years of Excel, Google Sheets, and Power BI experience and 300K+ YouTube subscribers across channels, this template is made for teams that want a clear reporting layer without a recurring dashboard subscription. Review all 7 screenshots before publishing or purchasing, then add your own request records in the same format.
Key Features of Government Administration Dashboard in Google Sheets
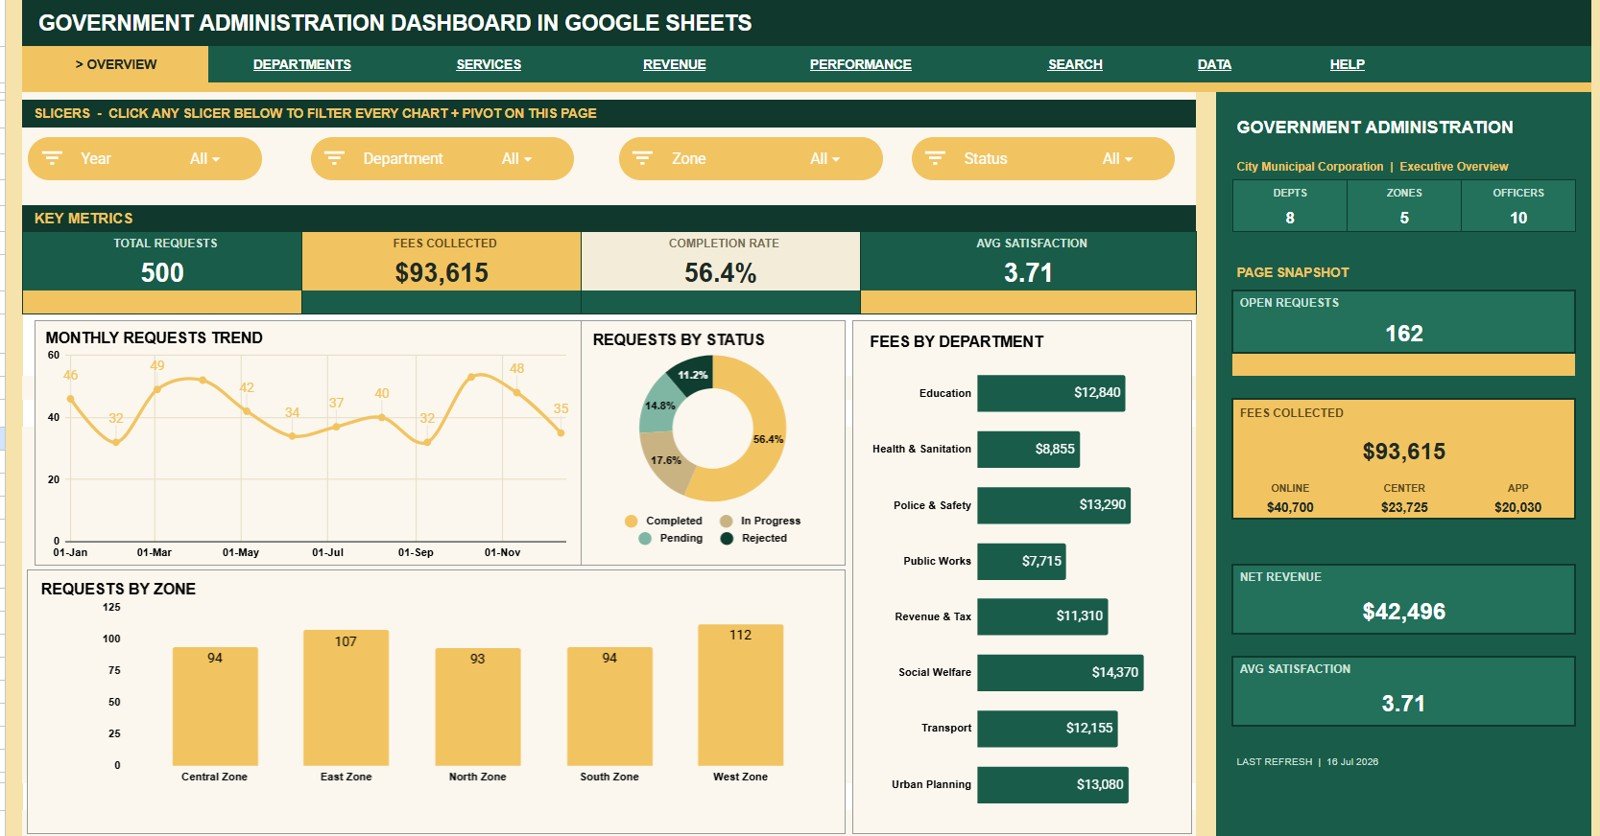
- Overview dashboard: See Total Requests, Fees Collected, Completion Rate, Avg Satisfaction, Depts, Zones, Officers, Open Requests, and Net Revenue in one view.
- Interactive slicers: Filter the dashboard quickly by available department, zone, status, priority, channel, officer, and date fields.
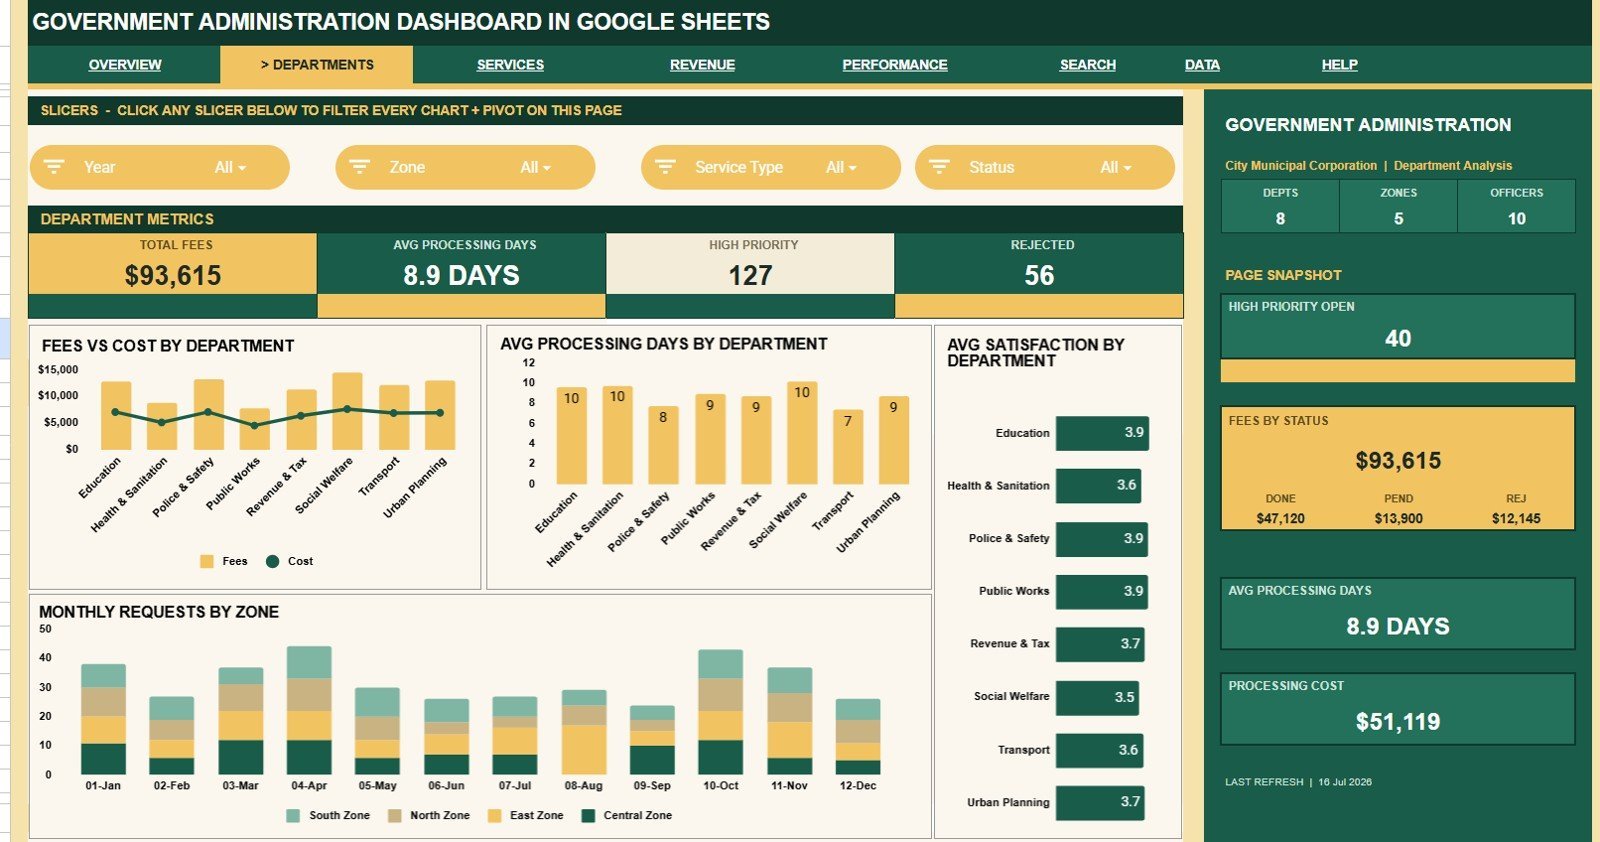
- Department analysis: Compare fees, cost, processing days, satisfaction, and monthly zone request volume.
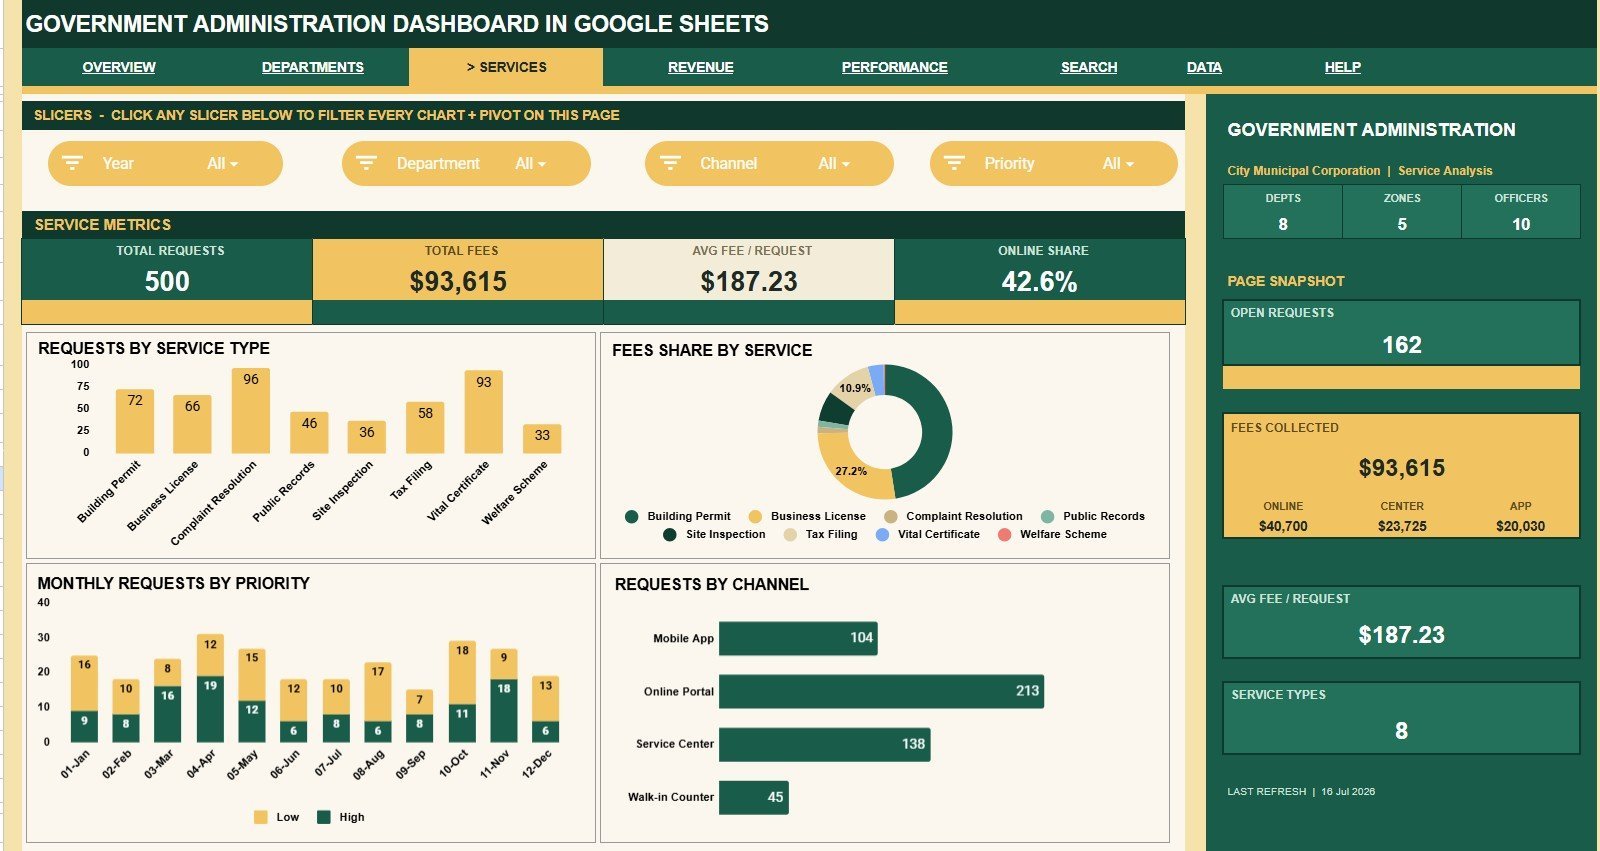
- Service analysis: Review requests and fees by service type, priority, month, and service channel.
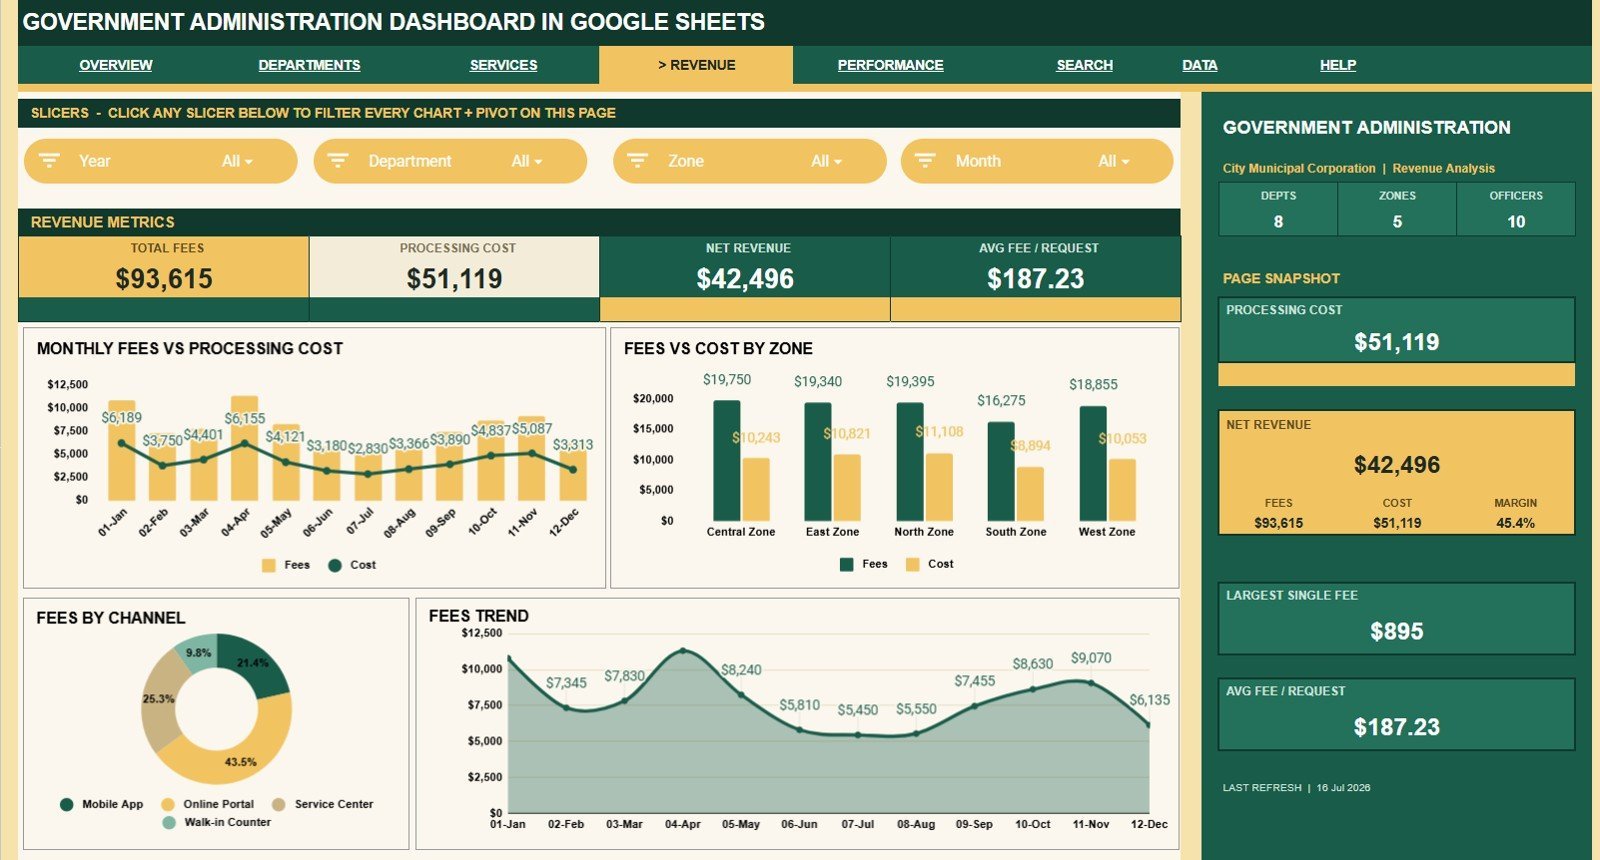
- Revenue analysis: Track fees, processing cost, net revenue movement, zone economics, and channel contribution.
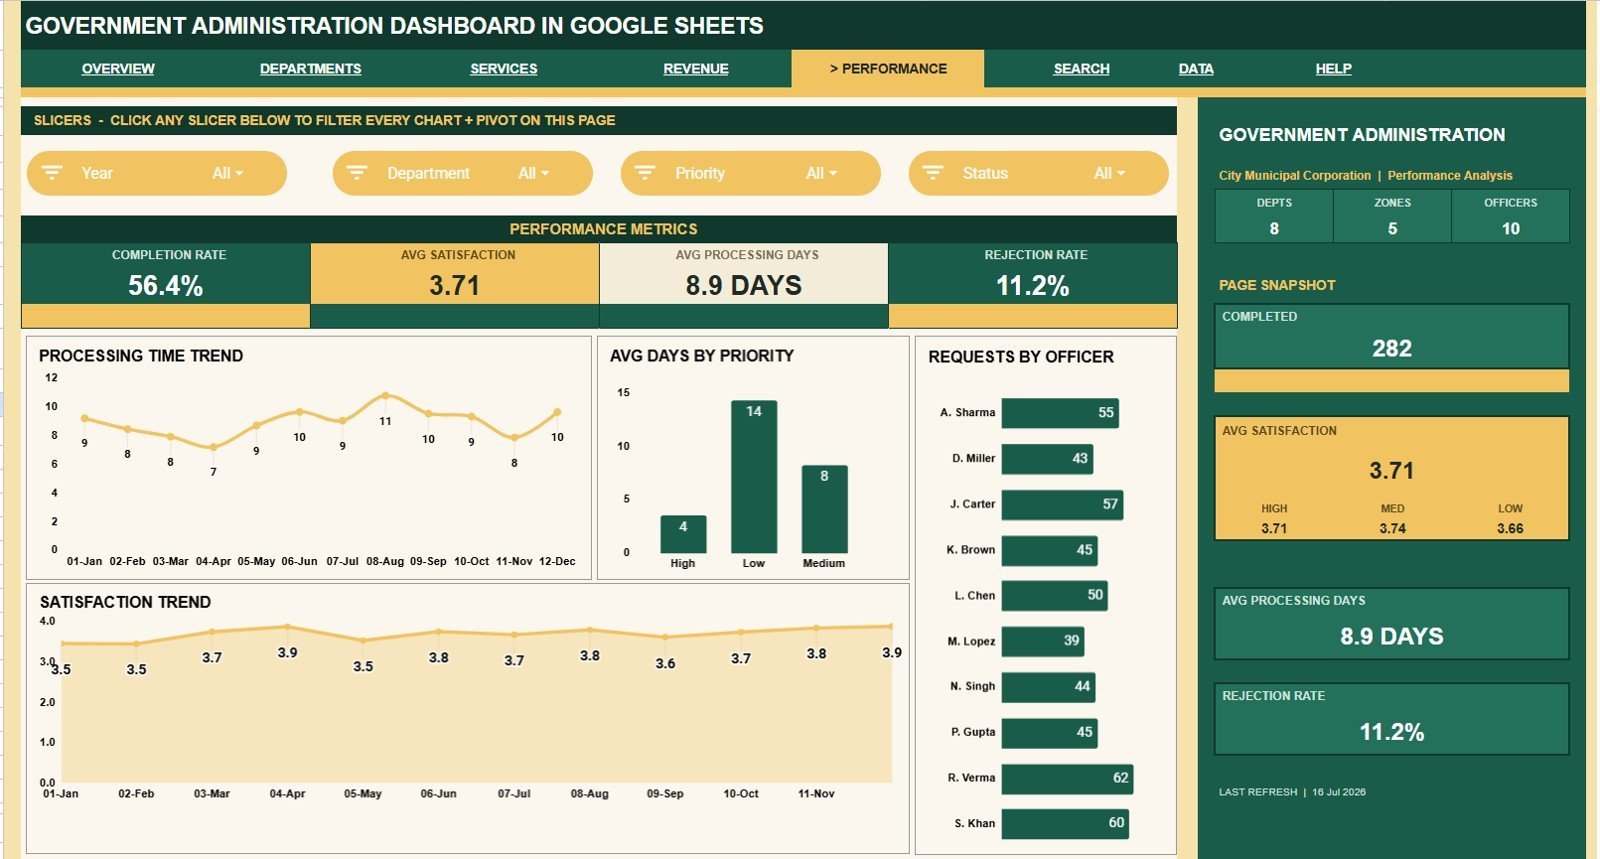
- Performance analysis: Monitor processing time, officer workload, priority-level turnaround, and satisfaction trends.
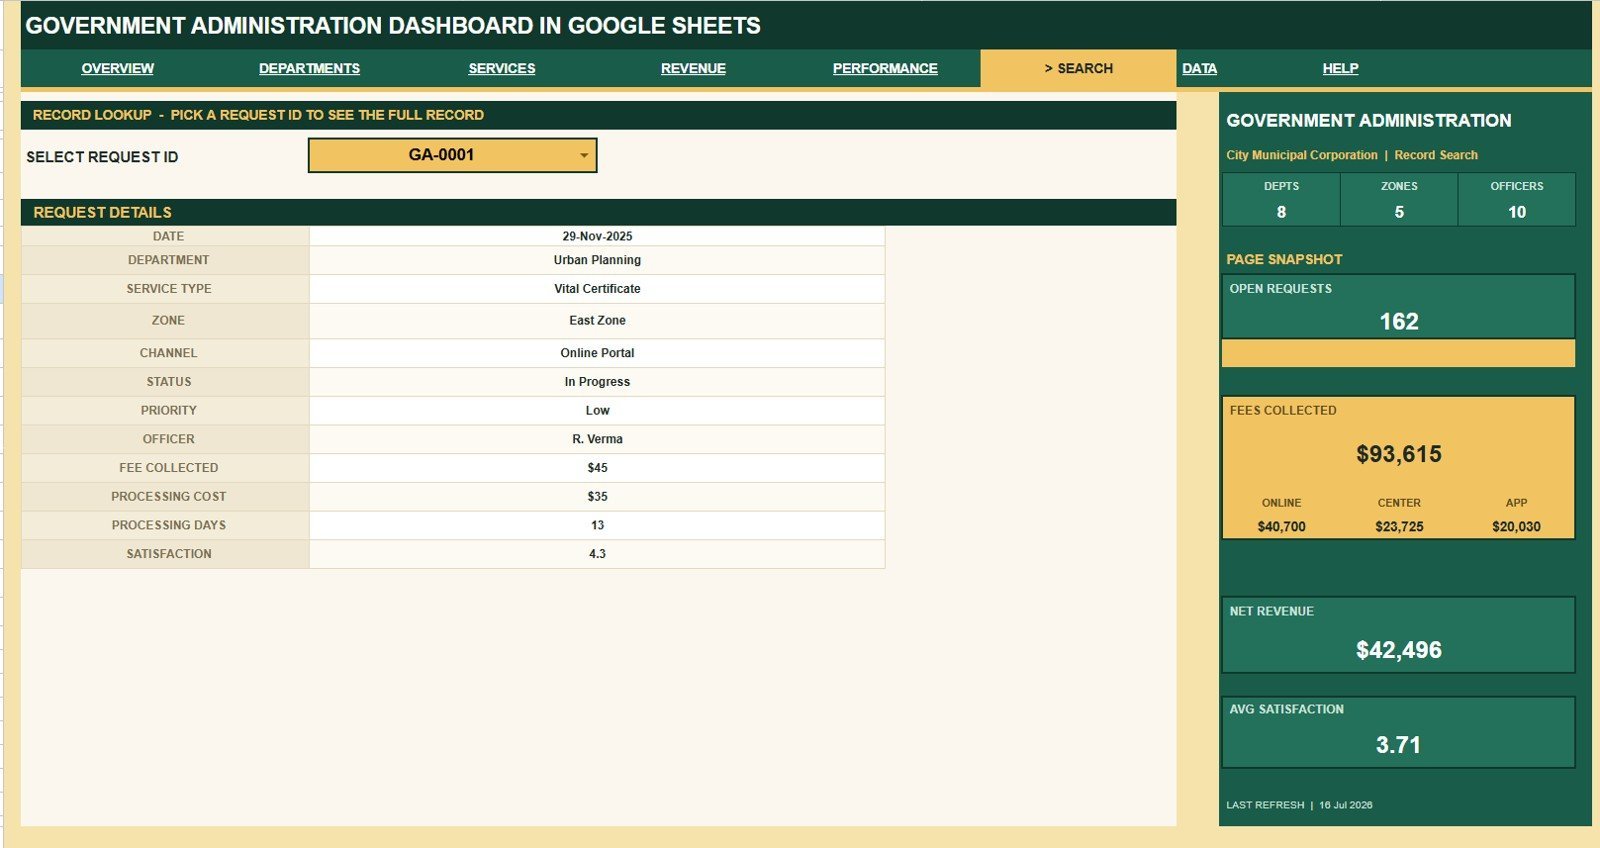
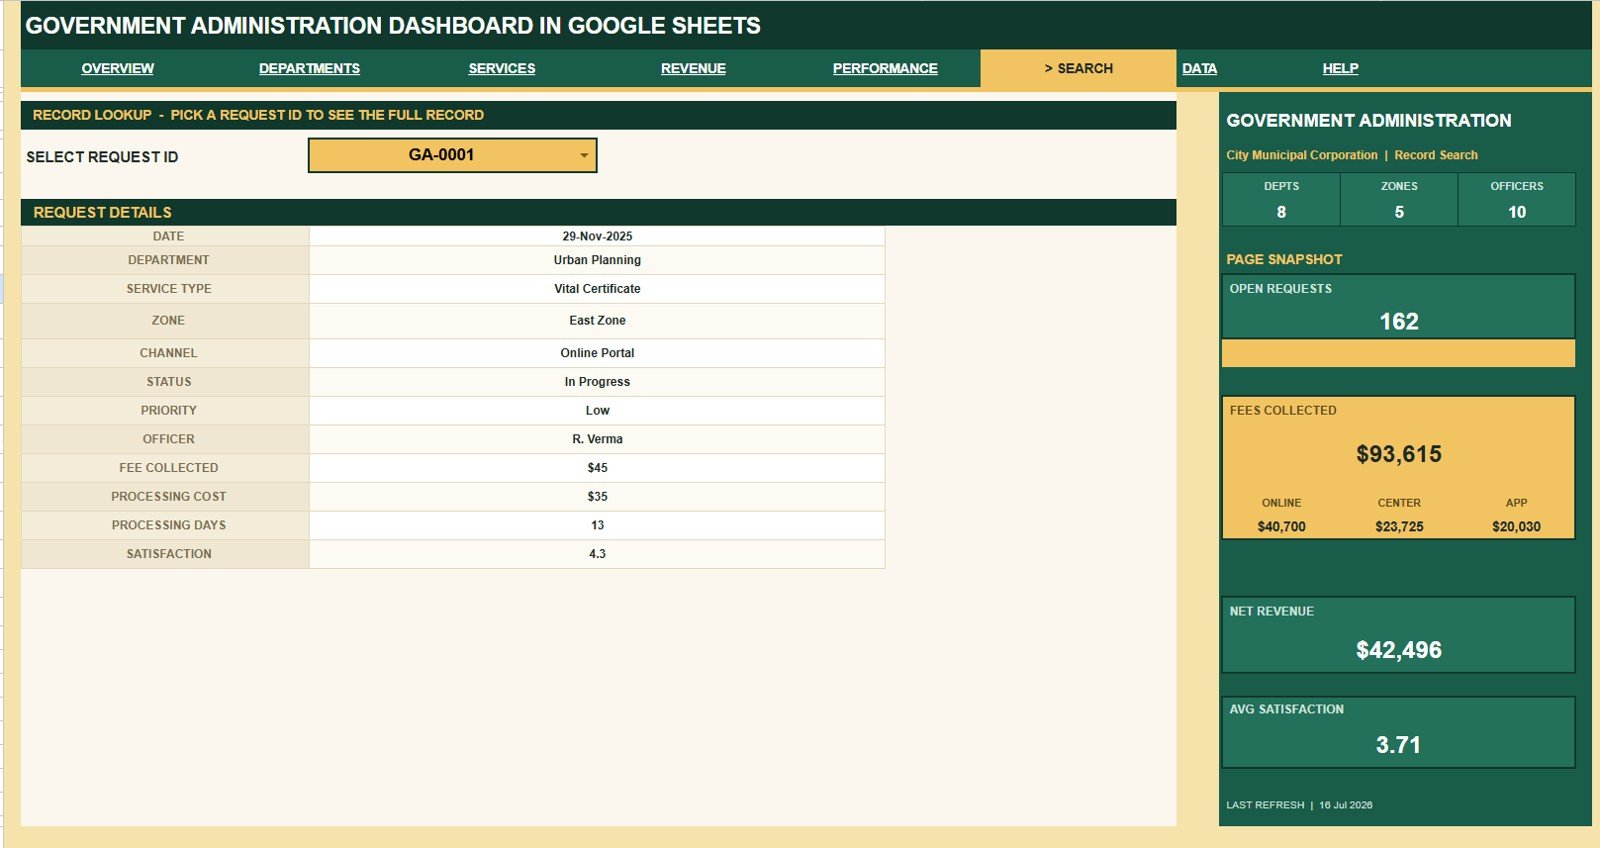
- Search Sheet: Select one Request ID and return the full record without scrolling through raw data.
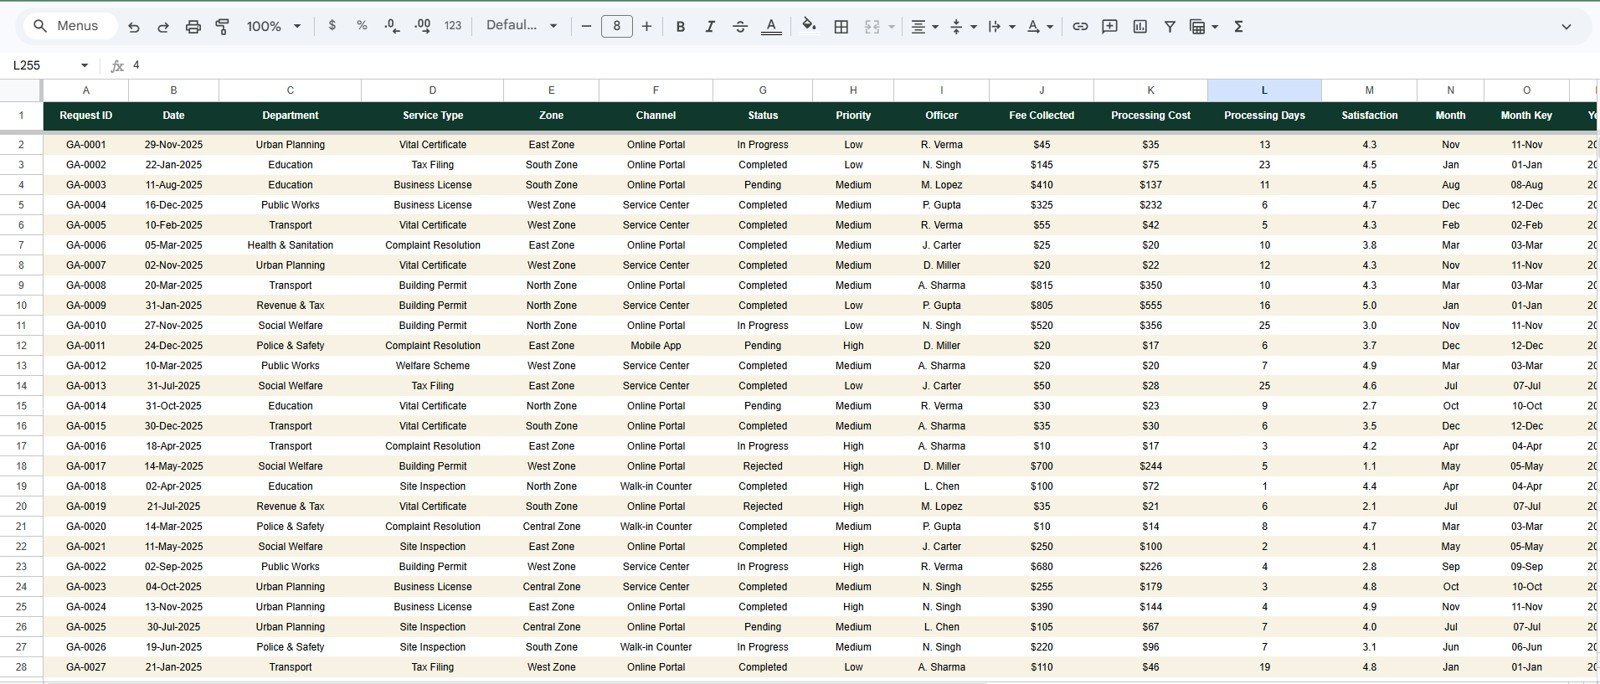
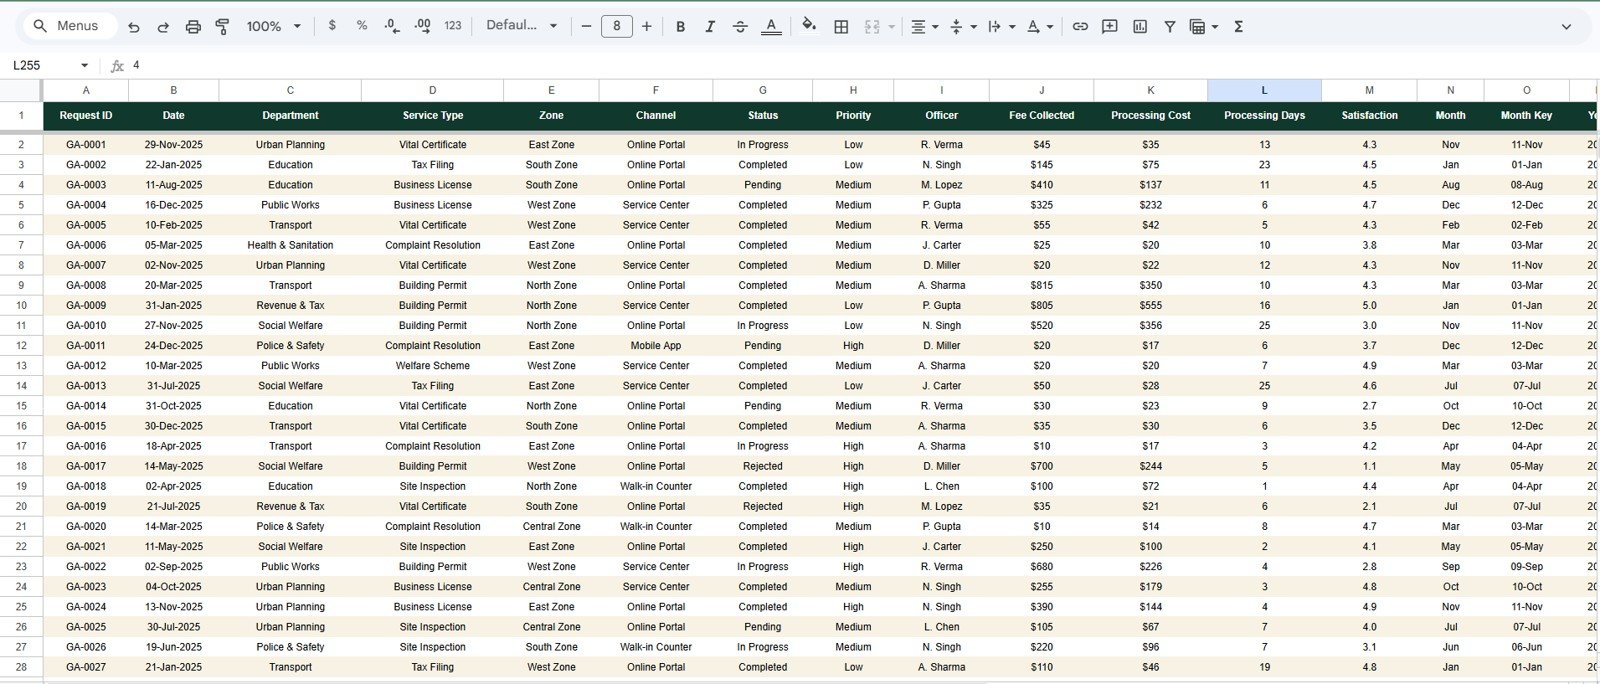
- Editable data sheet: Replace sample rows with your own government administration records while preserving the template format.
What’s Inside the Government Administration Dashboard in Google Sheets
1. Overview Page
The Overview Page gives leaders a fast operating snapshot across request volume, fee collection, completion rate, satisfaction, departments, zones, officers, open requests, and net revenue. It is the first place to check whether public-service activity is increasing, revenue is healthy, and unresolved work needs attention.
Requests by Month: Shows monthly request volume so administrators can spot busy periods and seasonal demand. Use it to plan staffing, service windows, and reporting cadence.
Requests by Status: Breaks requests into operational stages such as open, completed, pending, or rejected. It helps managers understand backlog pressure and closure performance.
Fees by Department: Compares fee collection across departments. It helps finance and administration teams identify which service areas contribute the most revenue.
Requests by Zone: Shows where demand is concentrated geographically or operationally. It helps zone managers compare workload and decide where follow-up is needed.
2. Department Analysis
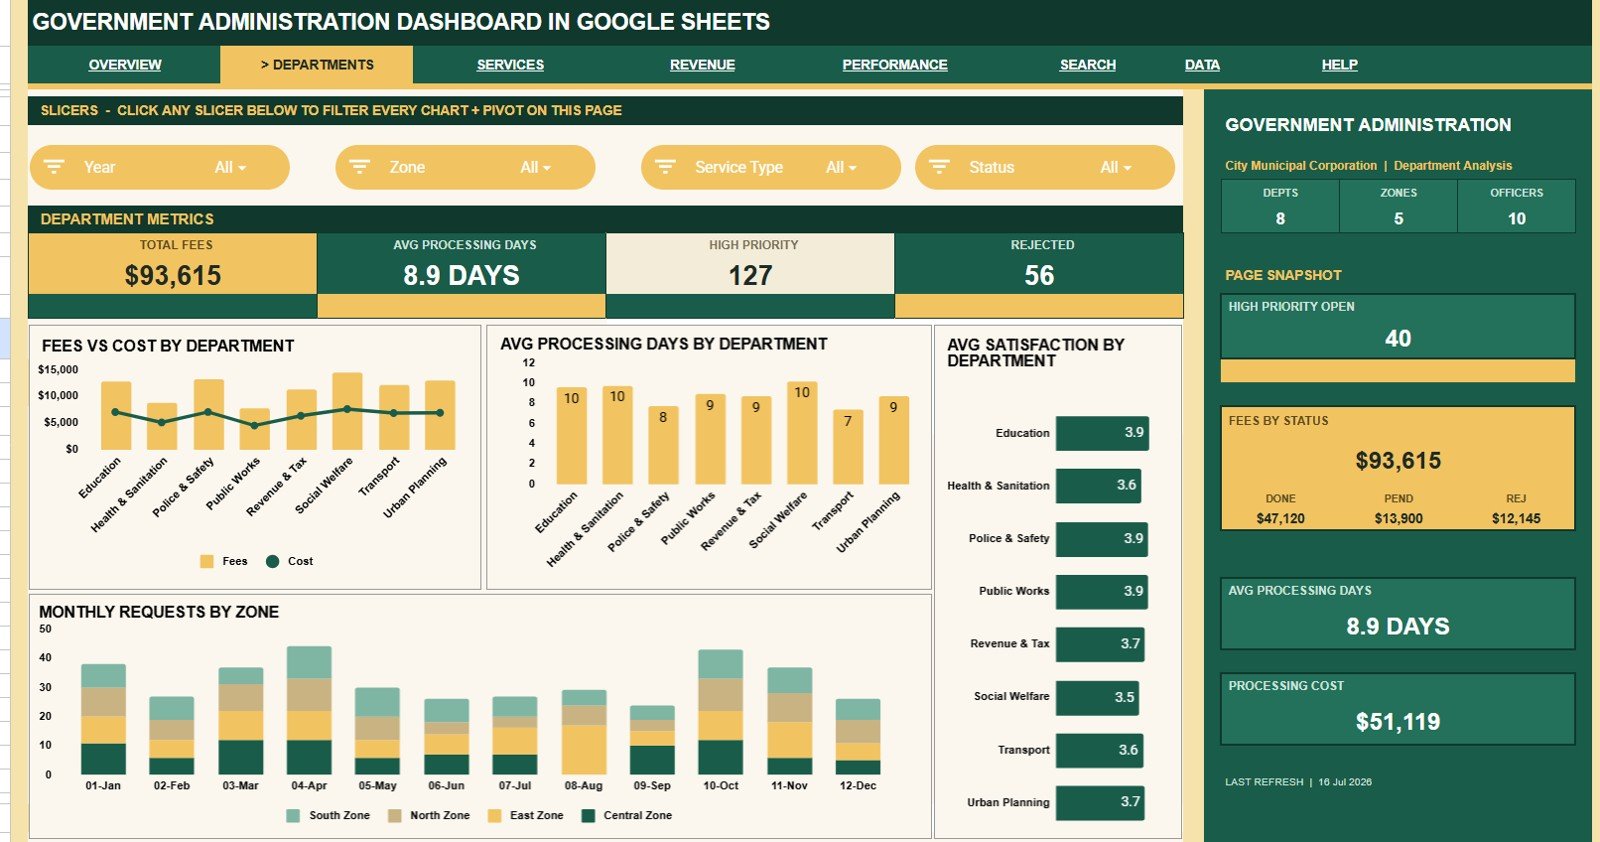
The Department Analysis tab compares operational and financial performance by department. Fees and Cost by Department shows where collections and processing costs sit side by side, while Average Processing Days by Department identifies slower service areas.
Average Satisfaction by Department helps users compare service quality across departments. Monthly Requests by Zone adds trend context so managers can see whether zone workload is shifting over time.
3. Service Analysis
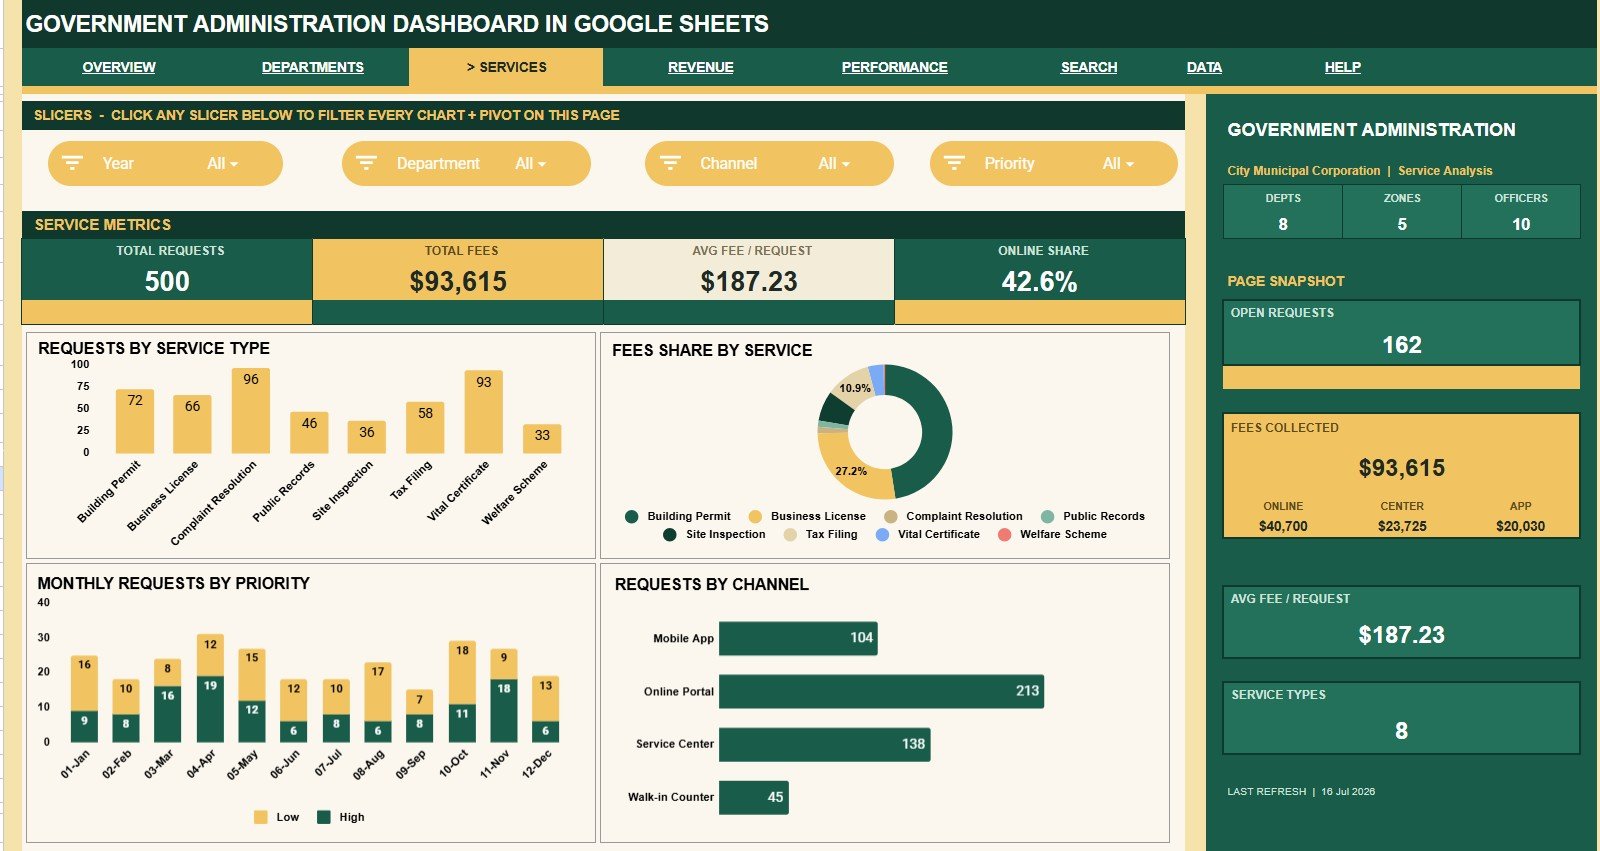
The Service Analysis tab explains what kinds of public requests drive demand. Requests by Service Type highlights high-volume services, and Fees by Service Type shows which services create the most fee collection.
Requests by Month and Priority connects urgency with time trends, helping teams check if high-priority cases are growing. Requests by Channel shows whether citizens are using walk-in, online, phone, or other channels most often.
4. Revenue Analysis
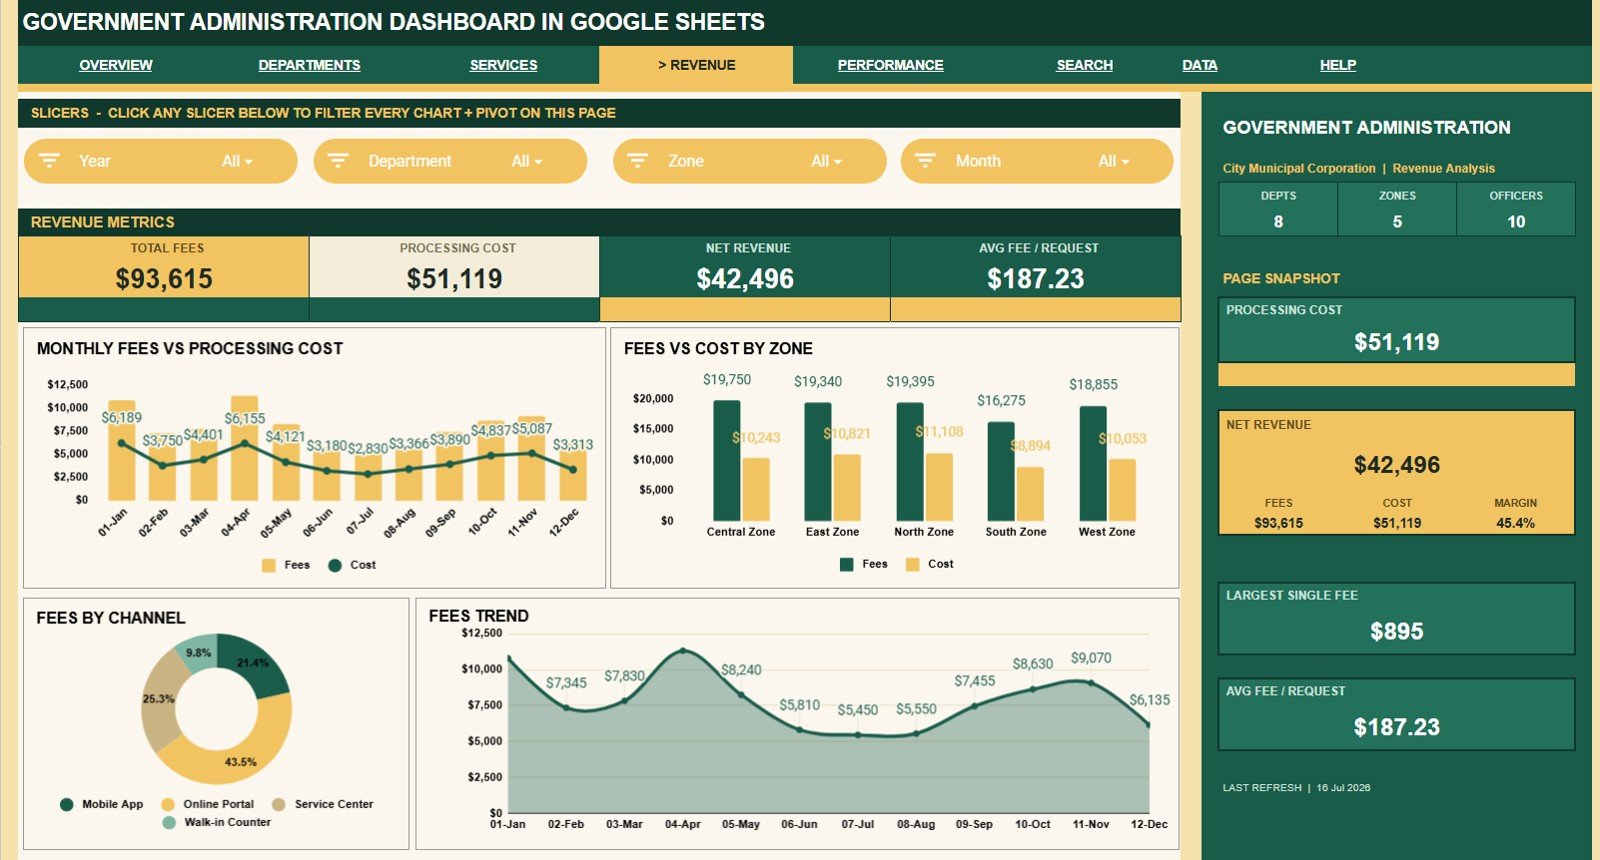
The Revenue Analysis tab is built for fee and cost review. Fees and Processing Cost by Month shows whether revenue and cost are moving together, while Fees and Cost by Zone compares financial performance across operating zones.
Fees by Channel reveals which intake methods contribute the most collections. Fees by Month provides a clean revenue trend for monthly reviews.
5. Performance Analysis
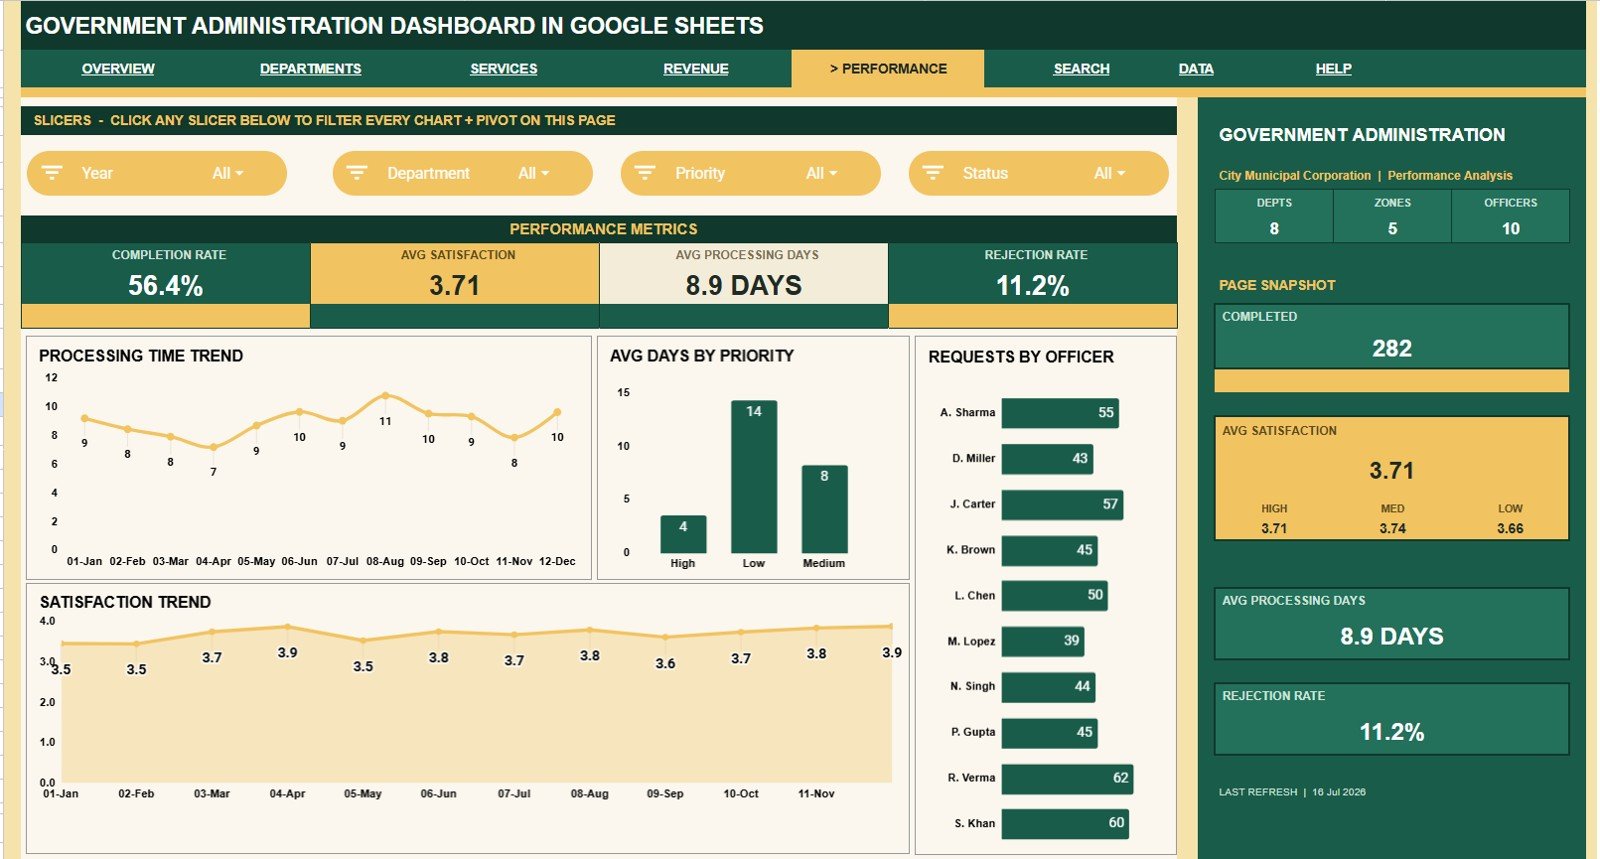
The Performance Analysis tab focuses on turnaround and service quality. Processing Time by Month shows whether processing speed is improving or getting slower over time, and Average Processing Days by Priority compares service speed by urgency.
Requests by Officer helps supervisors review workload distribution. Satisfaction by Month tracks whether citizen satisfaction is stable, rising, or falling.
6. Search Sheet
The Search Sheet lets users select a Request ID and instantly view the matching Date, Department, Service Type, Zone, Channel, Status, Priority, Officer, Fee Collected, Processing Cost, Processing Days, and Satisfaction details. This is useful when a citizen inquiry, audit question, or manager review requires one exact record.
7. Data Sheet Tab
The Data Sheet is the input layer for the dashboard. Add records in the same format so cards, slicers, charts, and the Search Sheet remain connected.
Government Administration Dashboard in Google Sheets vs. Microsoft Excel Dashboard vs. Paid Government SaaS – Where This Fits
| Feature | This Google Sheets Template | Microsoft Excel Dashboard | Paid Government SaaS |
|---|---|---|---|
| Cost | $9.99 sale price | Template cost plus license needs | Recurring subscription or contract |
| Platform | Google Sheets in browser or app | Excel desktop or web | Vendor portal |
| Setup time | Copy the file and replace sample data | Open workbook and replace data | Implementation and configuration |
| Real-time team collaboration | Native Drive sharing | Requires compatible cloud sharing | Usually plan-based |
| Mobile access | Sheets app or browser | Excel app or browser | Vendor app or browser |
| Customizable fields | Editable sheet structure | Editable workbook structure | Limited by vendor settings |
| Share with link | Yes, with permission controls | Yes, with cloud storage | Usually user-account based |
| Year-1 cost at 5 users | $9.99 template price | Depends on existing licenses | Often much higher |
| Request ID lookup | Included | Possible with formulas | Usually included |
Who This Template Is For – and Who It’s Not For
This template is a good fit for municipal offices, local government departments, public-service desks, administrative teams, zone managers, records teams, and analysts who already maintain request data in spreadsheets. It is not a case-management system, citizen portal, payment gateway, workflow approval tool, or legal record system. It works best when you need repeatable reporting from structured data.
How to Use the Government Administration Dashboard in Google Sheets
- Open the PDF guide after purchase and create your editable Google Sheets copy.
- Review the sample Data Sheet and keep the column order consistent.
- Replace sample request records with your own records.
- Use slicers to filter by department, zone, status, priority, officer, or channel.
- Select a Request ID on the Search Sheet when you need one record.
Real-World Use Cases
Meera, a municipal administrator, uses the Overview Page every Monday to check open requests, completion rate, and satisfaction before department meetings.
Ravi, a revenue officer, opens Revenue Analysis to compare fees, processing cost, channels, and zones before the monthly finance review.
Anita, a service desk supervisor, uses Search Sheet to answer record-level questions quickly when a citizen or senior officer asks about a specific request.
Frequently Asked Questions
What does this dashboard track?
It tracks government requests, departments, service types, zones, channels, status, priority, officers, fees, processing cost, processing days, satisfaction, and net revenue.
Does it work in Microsoft Excel?
This version is built for Google Sheets. You may be able to download a copy, but the intended workflow is Google Sheets with Drive sharing.
Can multiple people use the file?
Yes. Google Sheets supports sharing through Google Drive permissions, so authorized team members can view or edit the file.
Does it import data automatically?
No. Add or paste records into the Data Sheet in the supplied format. API connections or form integrations would require customization.
Can I customize the dashboard?
Yes. After copying the file, you can edit labels, formulas, charts, and sheet layout if you are comfortable maintaining the dashboard logic.
Is this a full government service management system?
No. It is a reporting dashboard template, not a citizen portal, approval workflow system, payment processor, or official records platform.
About the Author
Built by PK – Microsoft Certified Professional with 15+ years of Excel, Google Sheets, and Power BI experience. Founder of NextGenTemplates, reaching 300K+ subscribers across YouTube channels. Every template is hand-built and tested before release.
Explore Related Templates
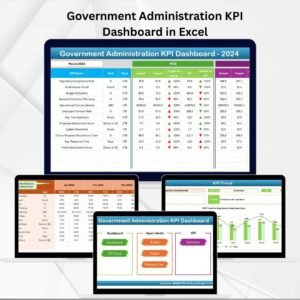
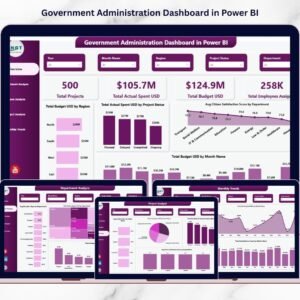
Browse more Google Sheets templates and Google Sheets dashboard templates. Related products include Government Administration Dashboard in Power BI, Government Administration KPI Dashboard in Excel, Audit Operations Management Dashboard in Google Sheets, and Budget Request & Approval Tracker in Google Sheets.
Ready to make public-service reporting easier to review? Add the Government Administration Dashboard in Google Sheets to your template library and turn request records into a repeatable dashboard.
Watch the step-by-step video Demo:
Last updated: July 16, 2026.














Reviews
There are no reviews yet.