

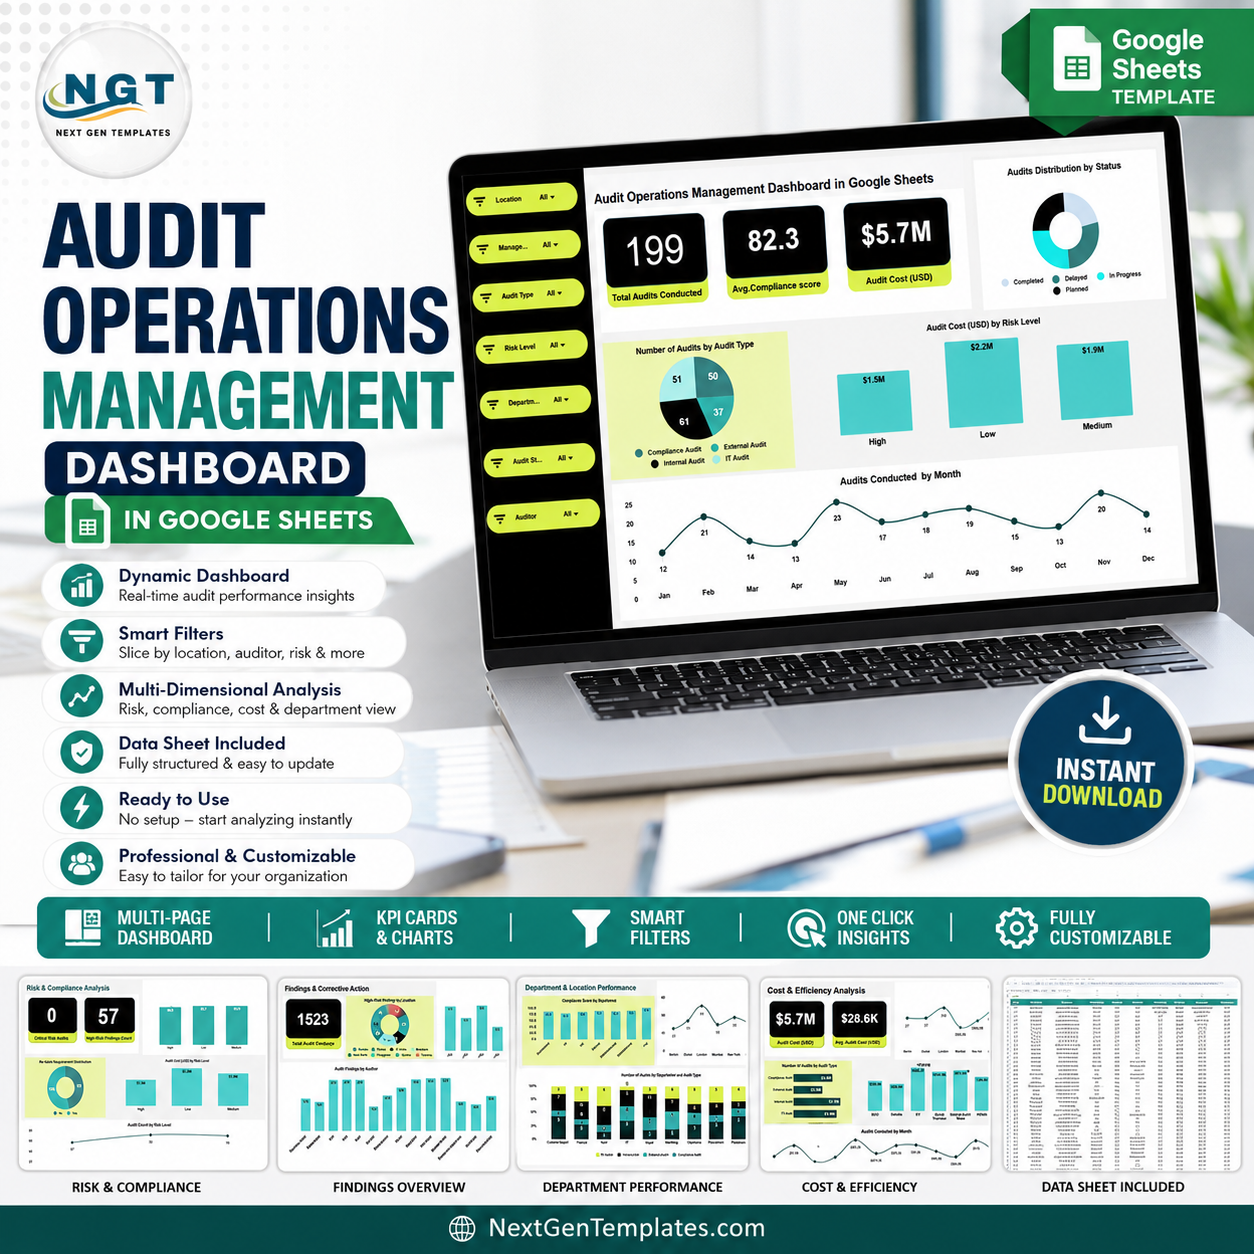

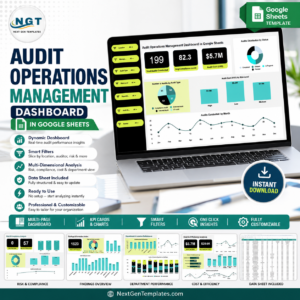
The Audit Operations Management Dashboard in Google Sheets organizes six sheet tabs, three executive cards, and 19 audit charts in one reusable workspace. It covers status, compliance, cost, risk, findings, corrective action, departments, locations, auditors, and monthly trends. Every page is shown below for review before purchase. The template is built by PK, a Microsoft Certified Professional whose channels reach 300K+ subscribers, and is offered for a one-time price without a subscription.Audit Operations Management Dashboard in Google Sheets
Key Features of Audit Operations Management Dashboard in Google Sheets
- Six tabs: overview, four analysis pages, and data.
- Three cards: audit volume, compliance, and cost.
- 19 charts: analyze workload, risk, findings, and efficiency.
- Interactive slicers: filter connected analysis quickly.
- Google Sheets sharing: control access through Drive permissions.
- Editable data: replace sample records in the supplied format.
What’s Inside the Audit Operations Management Dashboard in Google Sheets
1. Overview Page
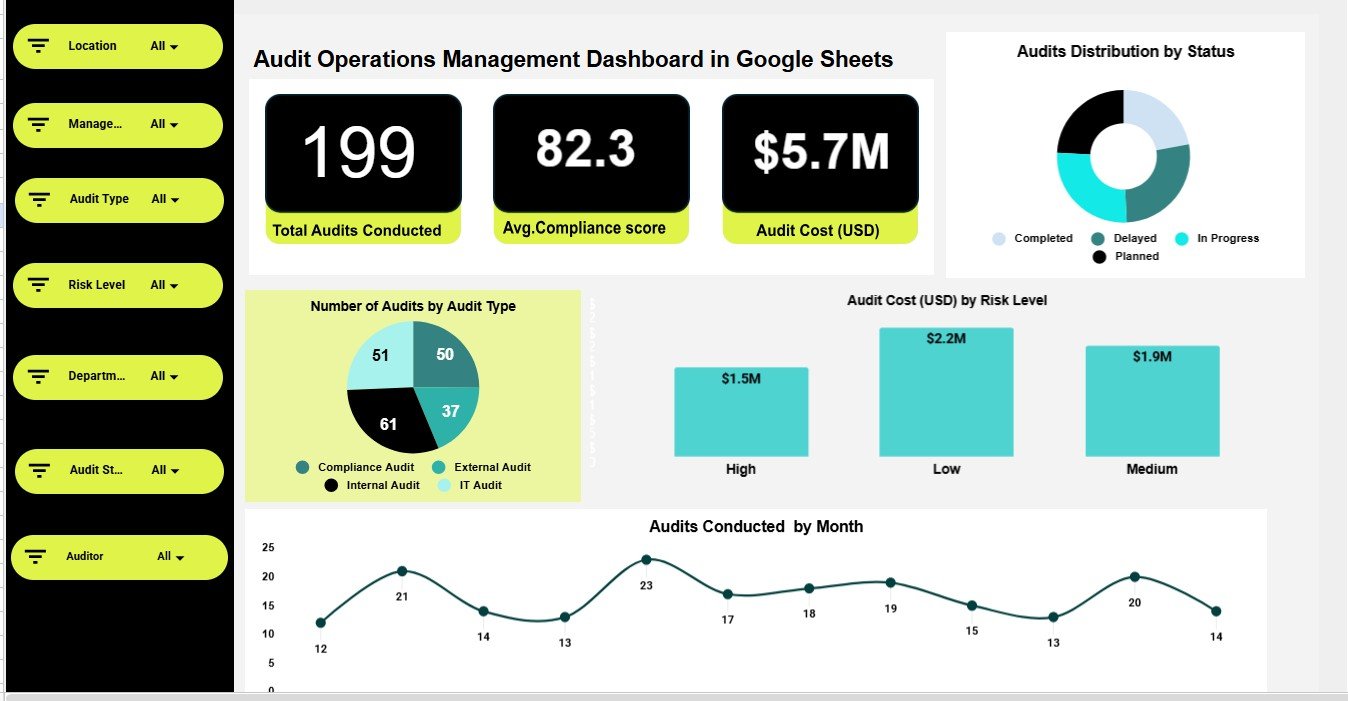
The three top cards summarize audit volume, average compliance, and total audit cost. Slicers let users narrow the visible results for faster reviews.Audit Operations Management Dashboard in Google Sheets
Audits Distribution by Status: Shows the mix of audit stages. Use it to spot pending or delayed work.
Number of Audits by Audit Type: Compares workload across audit types. Use it to understand where assurance effort is concentrated.Audit Operations Management Dashboard in Google Sheets
Audit Cost (USD) by Risk Level: Breaks spending into risk groups. Use it to check whether cost aligns with exposure.Audit Operations Management Dashboard in Google Sheets
Audits Conducted by Month: Tracks audit volume over time. Use it to identify busy periods and scheduling gaps.
Audit Operations Management Dashboard in Google Sheets
2. Risk & Compliance Analysis
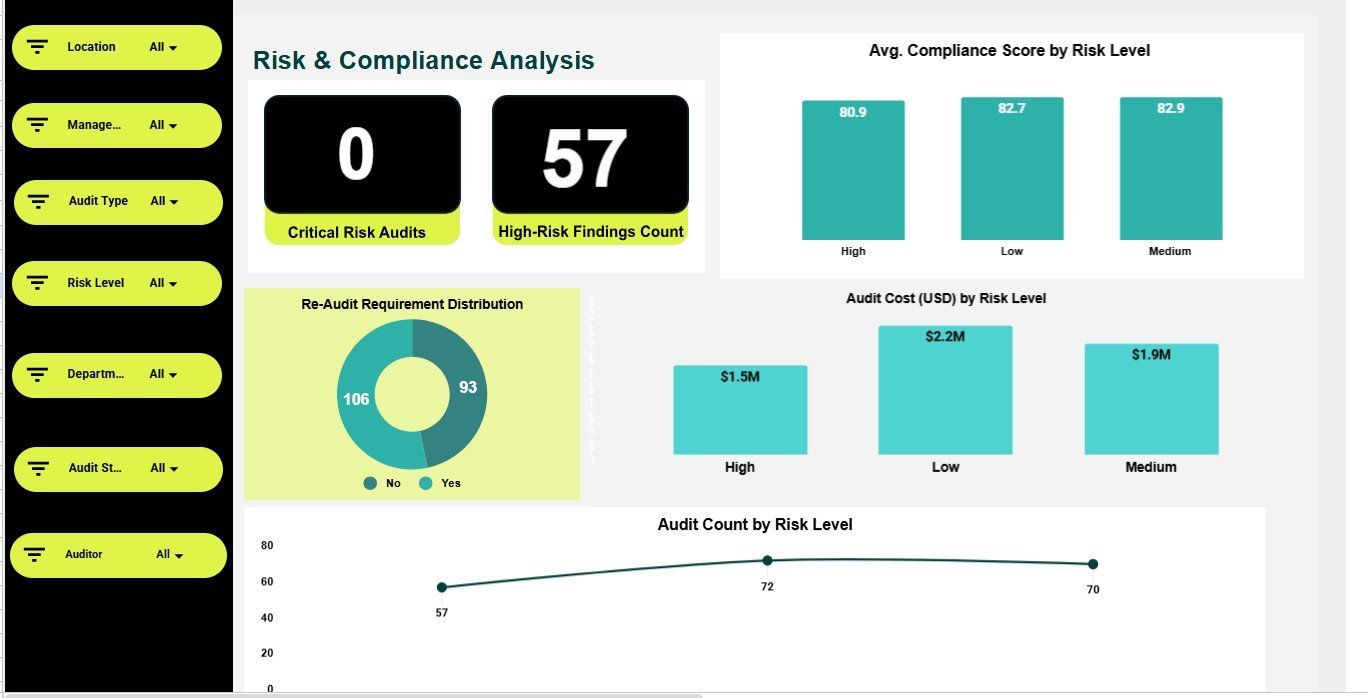
Avg. Compliance Score by Risk Level: Compares compliance across risk bands. Use it to prioritize weak high-risk areas.
Re-Audit Requirement Distribution: Shows how many records need another review. Use it to plan follow-up capacity.
Audit Cost (USD) by Risk Level: Summarizes spend by assessed risk. Use it to review resource allocation.
Audit Count by Risk Level: Counts audits in each risk group. Use it to test whether coverage matches exposure.
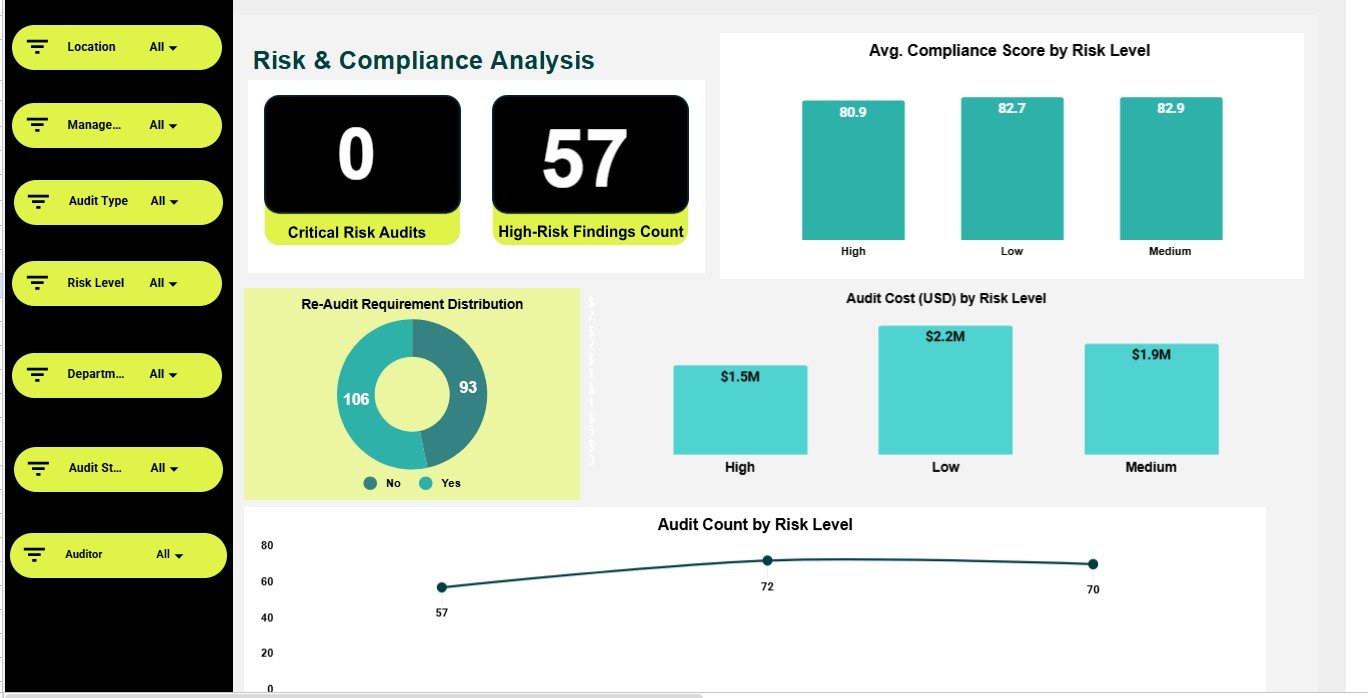
Risk & Compliance Analysis
3. Findings & Corrective Action
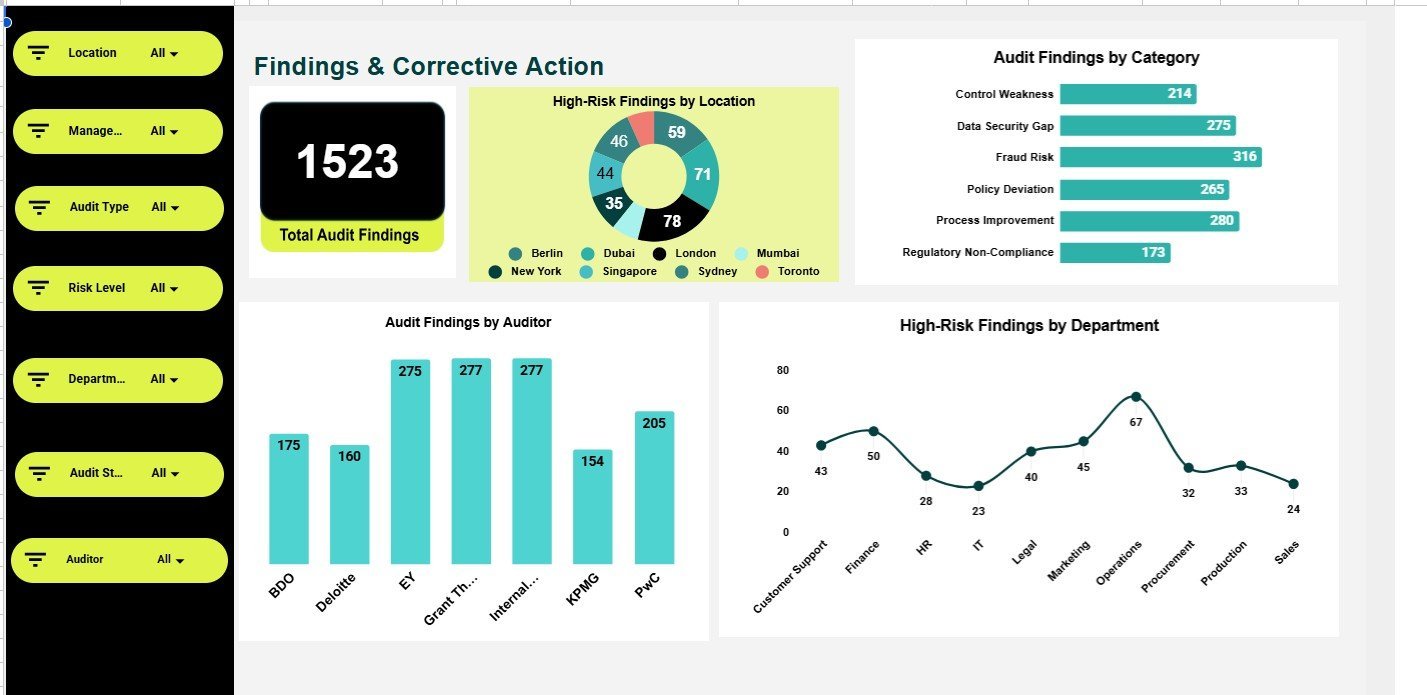
High-Risk Findings by Location: Locates the most serious findings. Use it to target site-level intervention.
Audit Findings by Category: Groups findings by issue category. Use it to reveal recurring control weaknesses.
Audit Findings by Auditor: Compares findings recorded by each auditor. Use it to review workload and detection patterns.
High-Risk Findings by Department: Maps critical findings to departments. Use it to assign corrective-action ownership.
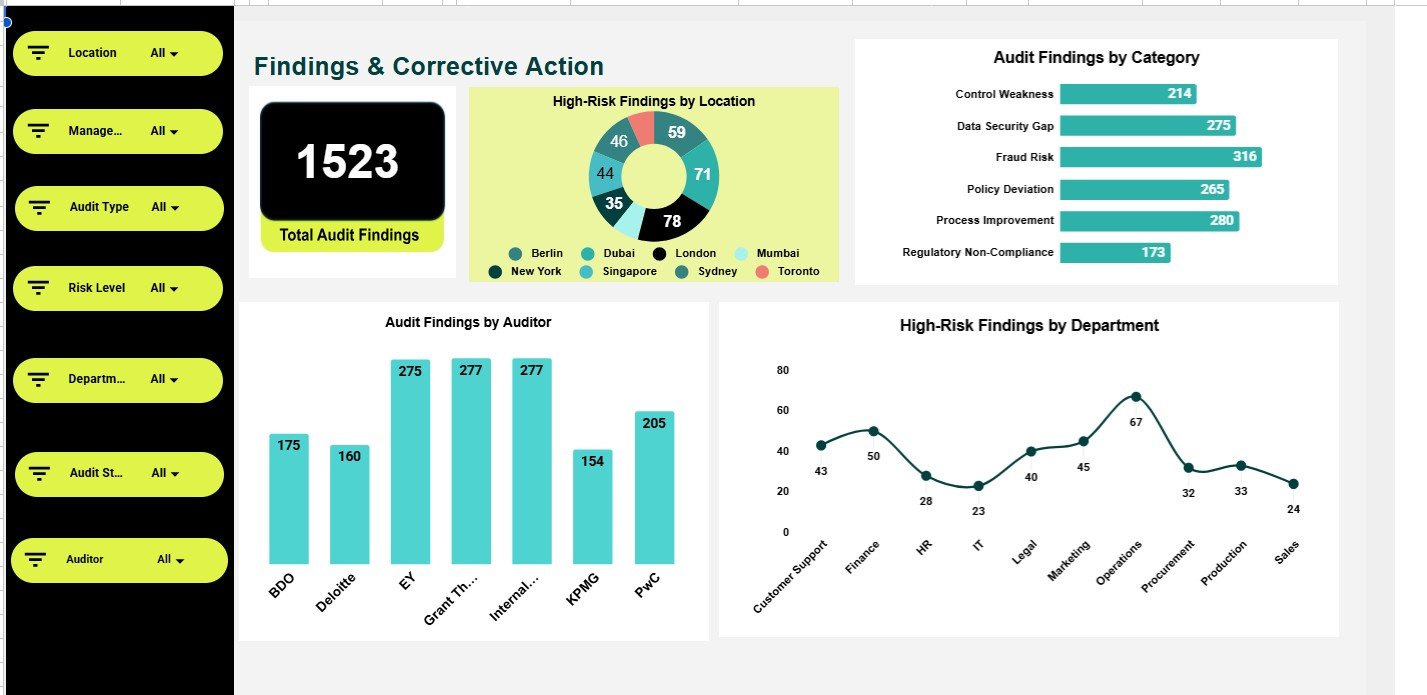
Findings & Corrective Action
4. Department & Location Performance
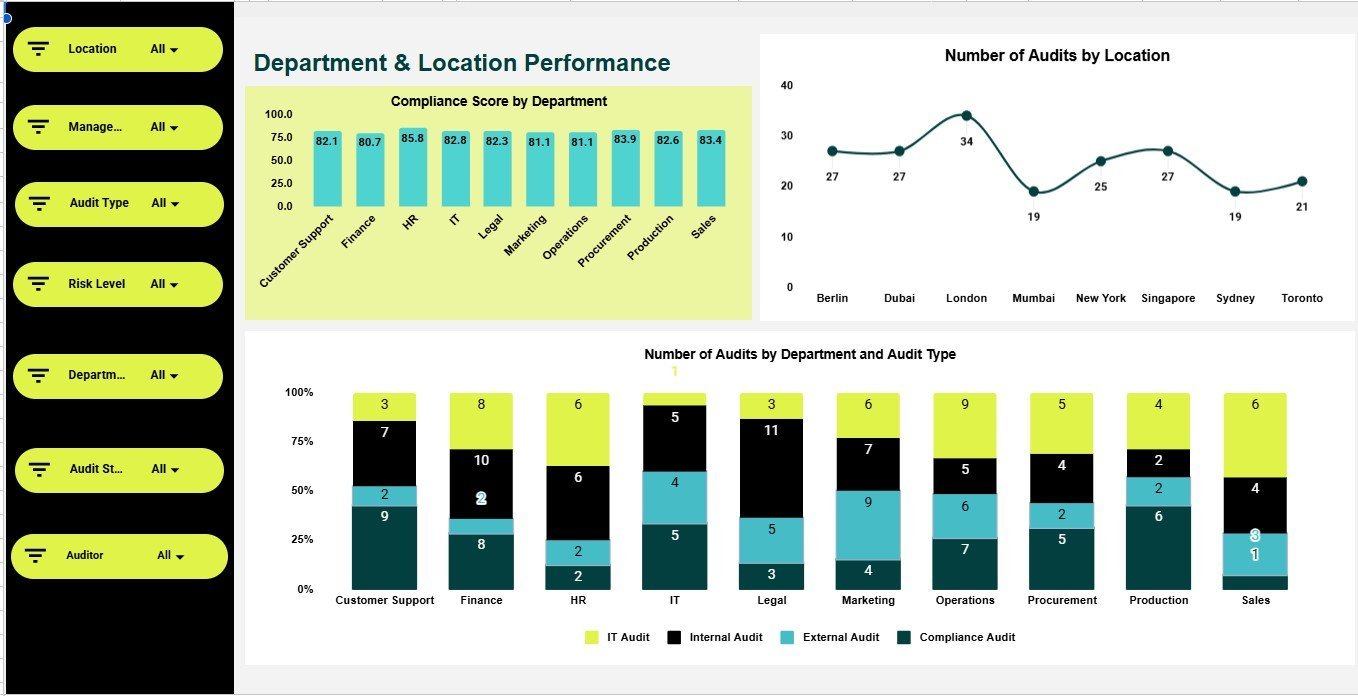
Compliance Score by Department: Compares departmental compliance results. Use it to identify coaching or remediation needs.
Number of Audits by Location: Shows audit coverage by site. Use it to find over- or under-reviewed locations.
Number of Audits by Department and Audit Type: Cross-tabulates workload by team and type. Use it to balance the audit plan.
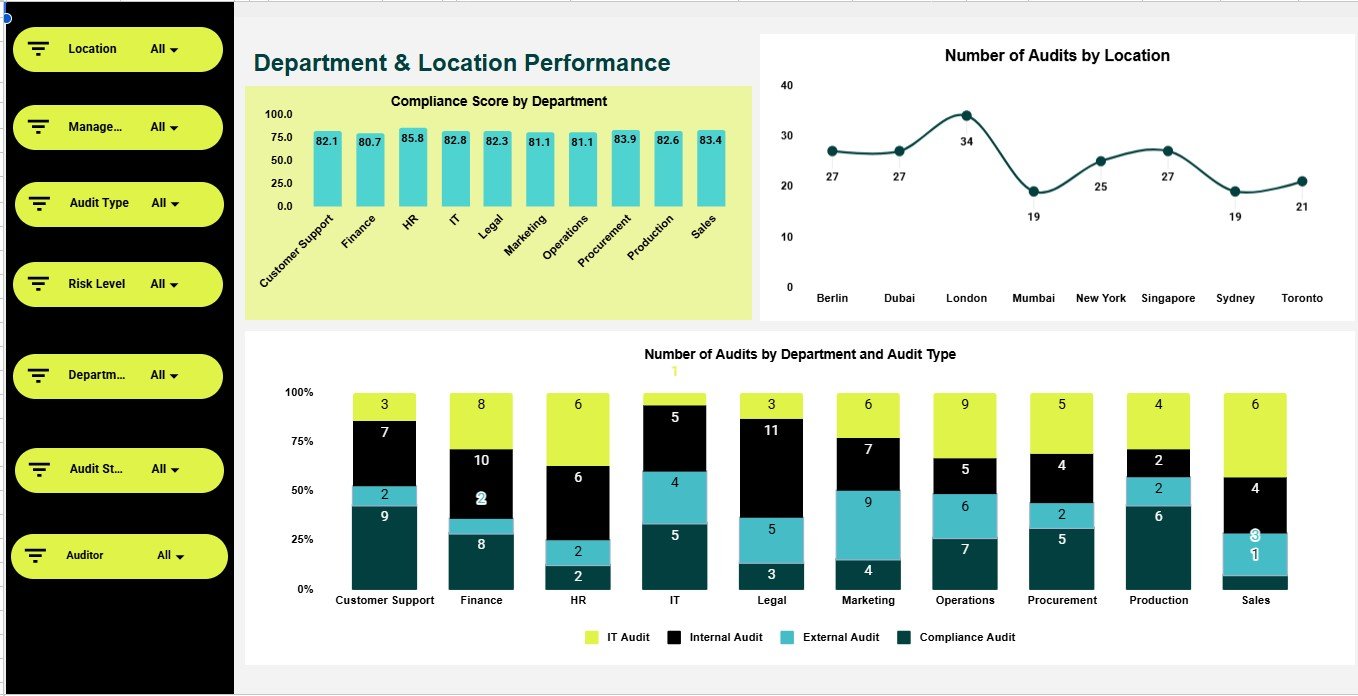
Department & Location Performance
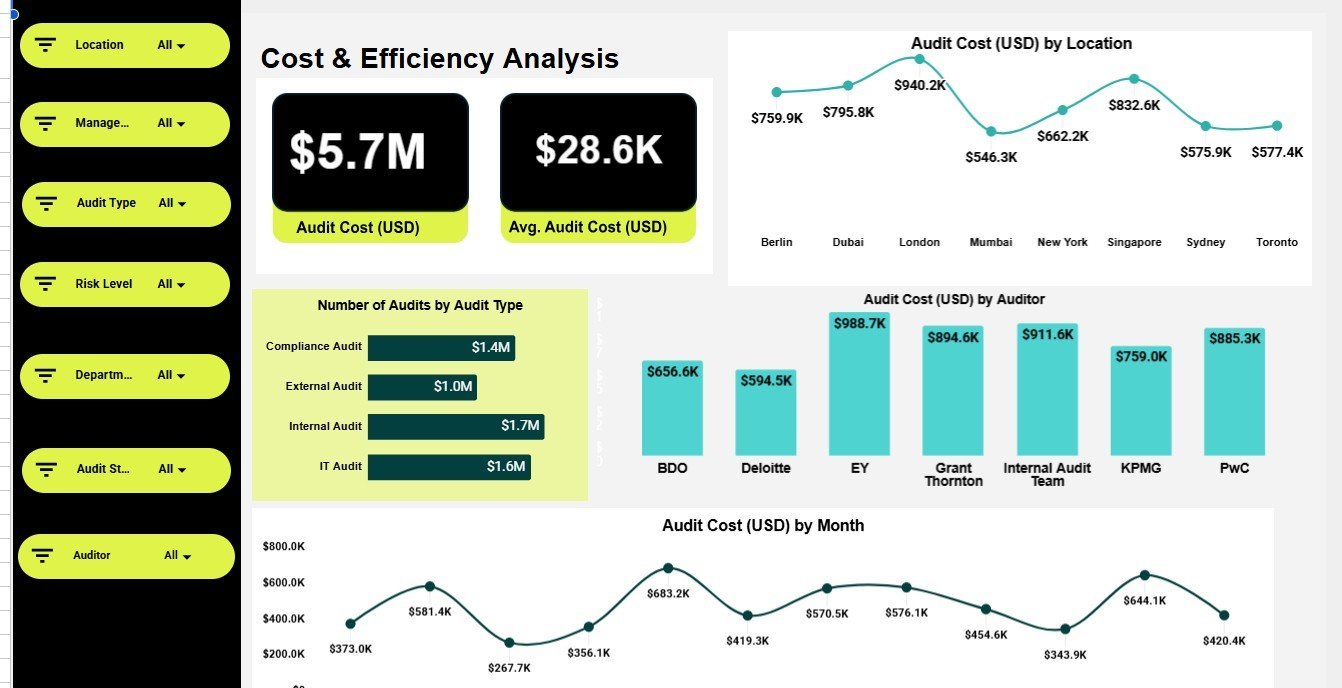
5. Cost & Efficiency Analysis
Audit Cost (USD) by Location: Compares audit expenditure across sites. Use it to investigate costly locations.
Number of Audits by Audit Type: Shows activity by audit type. Use it to evaluate the operating mix.
Audit Cost (USD) by Auditor: Compares spending associated with auditors. Use it to review utilization and assignments.
Audit Cost (USD) by Month: Tracks audit spending over time. Use it to monitor budget movement and peaks.
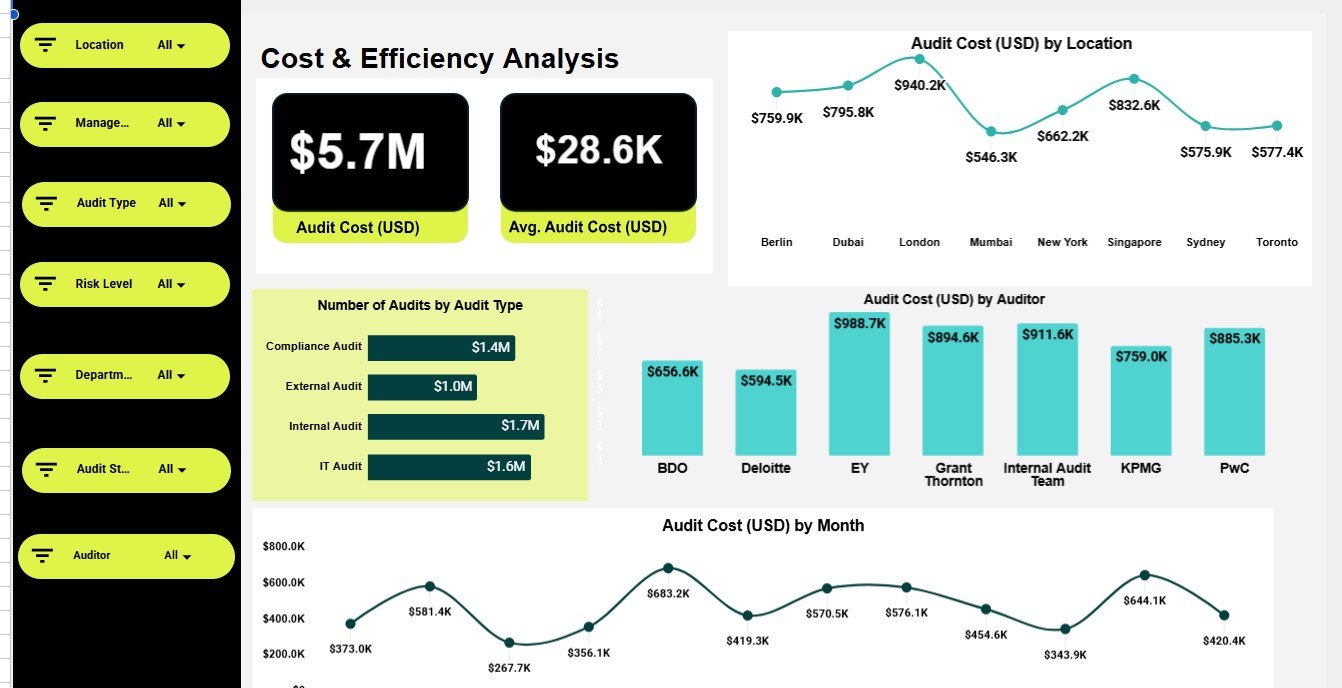
Cost & Efficiency Analysis
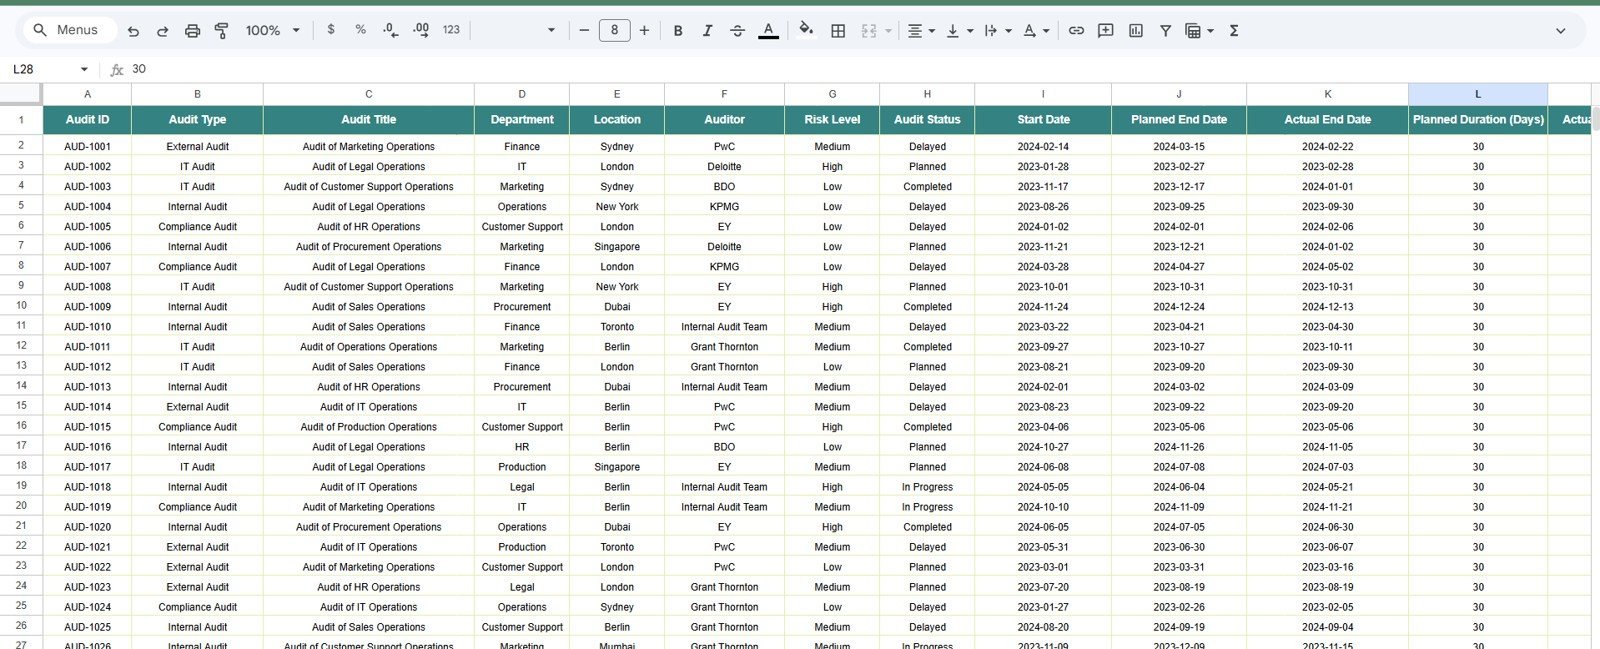
6. Data Sheet Tab
Add or replace audit records in the same column format shown in the data sheet. Consistent entries keep the connected analysis usable.
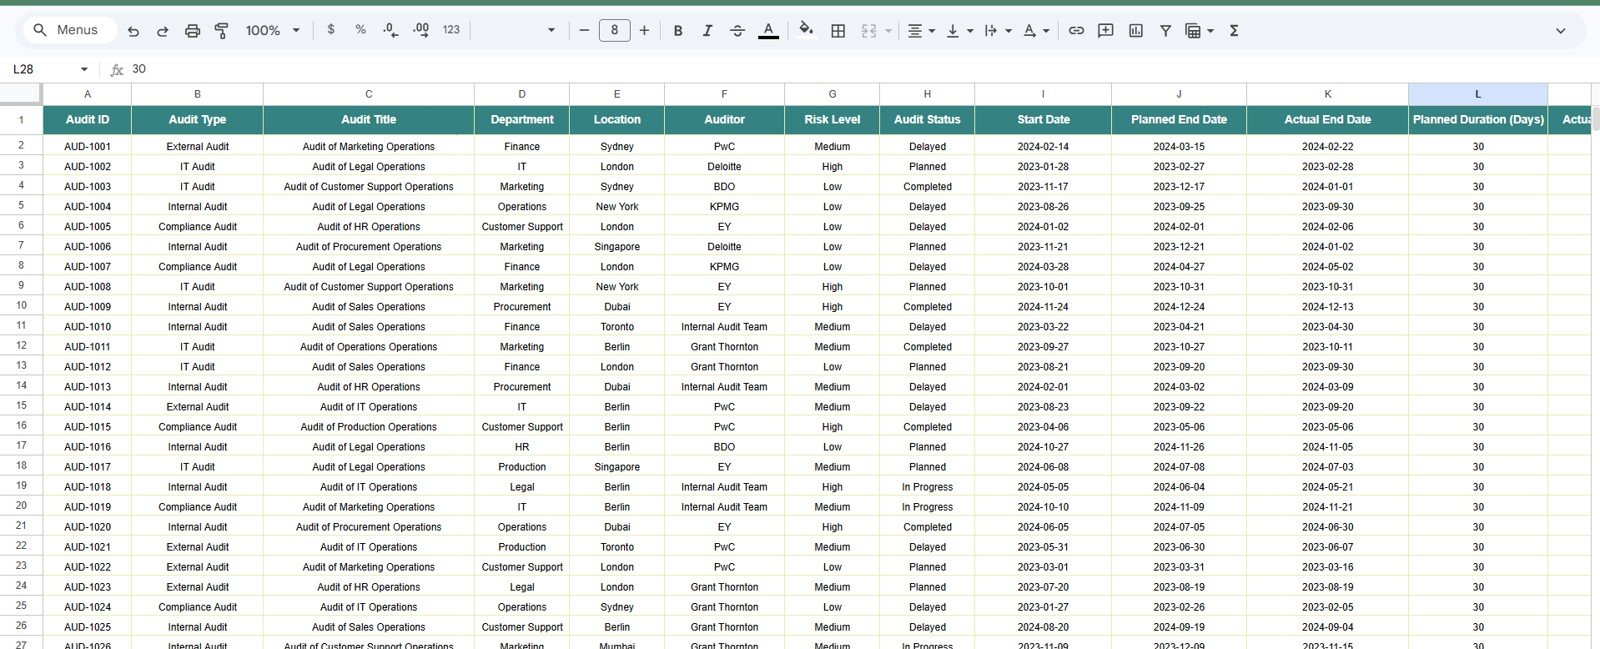
Data Sheet tab
Audit Operations Management Dashboard in Google Sheets vs. Microsoft Excel Dashboard vs. Paid GRC SaaS – Where This Fits
| Feature | This Google Sheets Template | Microsoft Excel Dashboard | Paid GRC SaaS |
|---|---|---|---|
| Cost | $9.99 sale price, one time | Template cost plus Excel license | Recurring, plan-dependent |
| Platform | Google Sheets | Desktop or web Excel | Vendor-hosted application |
| Setup time | Copy and replace data | Open and configure | Onboarding varies |
| Real-time collaboration | Native sharing | Microsoft 365 dependent | Usually included |
| Mobile access | App or browser | App or browser | App or browser |
| Customizable fields | Editable sheet structure | Editable workbook structure | Limited by plan and permissions |
| Share with link | Yes, using Drive permissions | Yes, using OneDrive or SharePoint | Usually |
| Year-1 cost at 5 users | $9.99, excluding Workspace | License dependent | Plan dependent |
| Audit pages | Five dashboards plus data | Design dependent | Module dependent |
Who This Template Is For – and Who It’s Not For
Best for: audit, compliance, quality, operations, and consulting teams that need visual analysis of structured audit records.
Not for: enterprises requiring automated evidence, approvals, regulatory libraries, immutable logs, or system integrations. Those needs call for GRC software.
How to Use the Audit Operations Management Dashboard in Google Sheets
- Create an editable copy using the supplied guide.
- Map your records to the sample columns.
- Replace rows while preserving headers and formats.
- Use slicers to focus each review.
- Share with approved reviewers through Drive permissions.
Real-World Use Cases
Asha, an audit manager, checks volume, risk coverage, and re-audit needs before planning reviews.
Daniel, a compliance coordinator, compares scores and high-risk findings before corrective-action meetings.
Meera, an operations director, reviews cost by month, location, and auditor before budgeting.
Frequently Asked Questions
What does this Google Sheets audit dashboard track?
It tracks audit status, type, risk, compliance score, re-audit needs, findings, departments, locations, auditors, monthly activity, and audit cost.
How many dashboard pages are included?
There are five visual dashboard pages plus one data sheet tab, for six tabs in total.
Can I filter the charts?
Yes. The dashboard includes slicers that let you narrow the visible analysis using the fields connected to each page.Audit Operations Management Dashboard in Google Sheets
Can multiple people use the file?
Yes. Google Sheets supports sharing and collaboration, subject to the permissions you set in Google Drive.Audit Operations Management Dashboard in Google Sheets
Does this replace a full GRC system?
No. It is a spreadsheet dashboard for structured tracking and analysis, not an enterprise workflow, evidence, or regulatory-content platform.Audit Operations Management Dashboard in Google Sheets
Can I change the sample data?
Yes. Replace it with your own records while preserving the headers, formats, and fields used by the dashboard.
About the Author
Built by PK – Microsoft Certified Professional with 15+ years of Excel, Google Sheets, and Power BI experience. Founder of NextGenTemplates, reaching 300K+ subscribers across YouTube channels. Every template is hand-built and tested before release.
Explore Related Templates
- Compliance and Audit Dashboard in Google Sheets
- Audit Findings and Risk Analysis Dashboard in Google Sheets
- Risk Management KPI Scorecard in Google Sheets
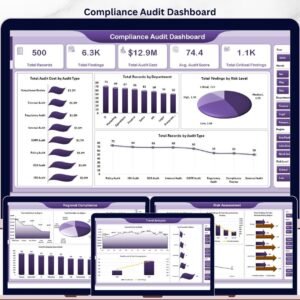
- Compliance Audits Dashboard in Excel
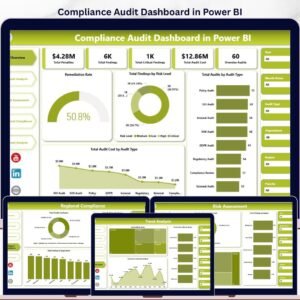
- Compliance Audits Dashboard in Power BI
Browse more Google Sheets templates and Google Sheets dashboards.
Ready to make audit reviews easier to scan? Add the dashboard to your toolkit, replace the sample records, and start analyzing your audit operations in Google Sheets.
Watch the step-by-step video Demo:
Last updated: July 15, 2026.



























Reviews
There are no reviews yet.