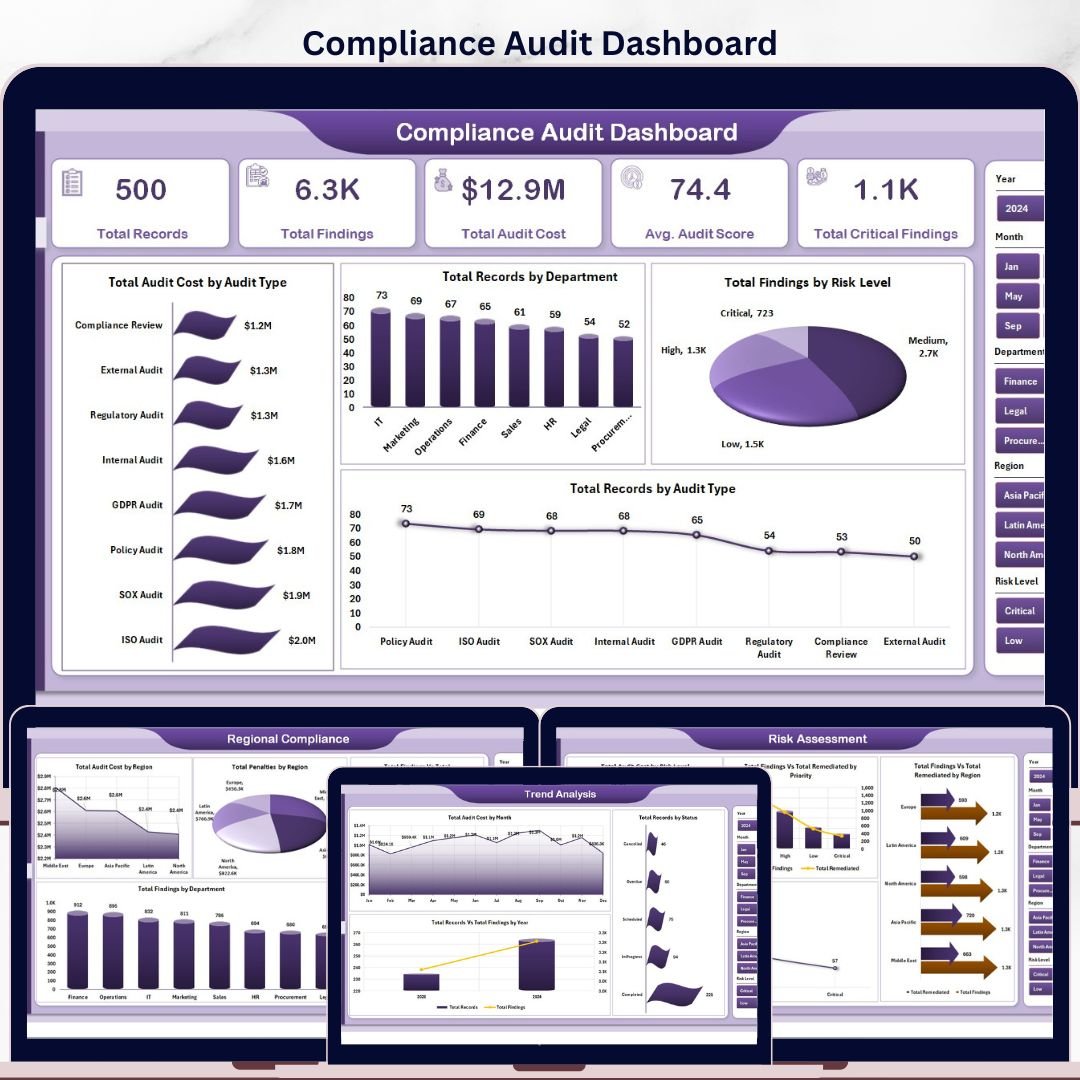
Compliance Audit Dashboard in Excel gives compliance officers, internal audit leaders, GRC managers, and risk professionals a ready-made workbook for tracking audit findings, remediation progress, audit cost, penalties, and risk concentration in one place. Compliance and audit teams often lose days every quarter consolidating findings from SharePoint folders, GRC platform exports, and regional spreadsheets. This Excel dashboard converts that scattered data into 5 analysis pages, 5 executive KPI cards, pivot-powered charts, and slicers that update with a single Refresh All. You get instant download, lifetime access, no subscription, and full control of your audit data.
Key Features of Compliance Audits Dashboard in Excel
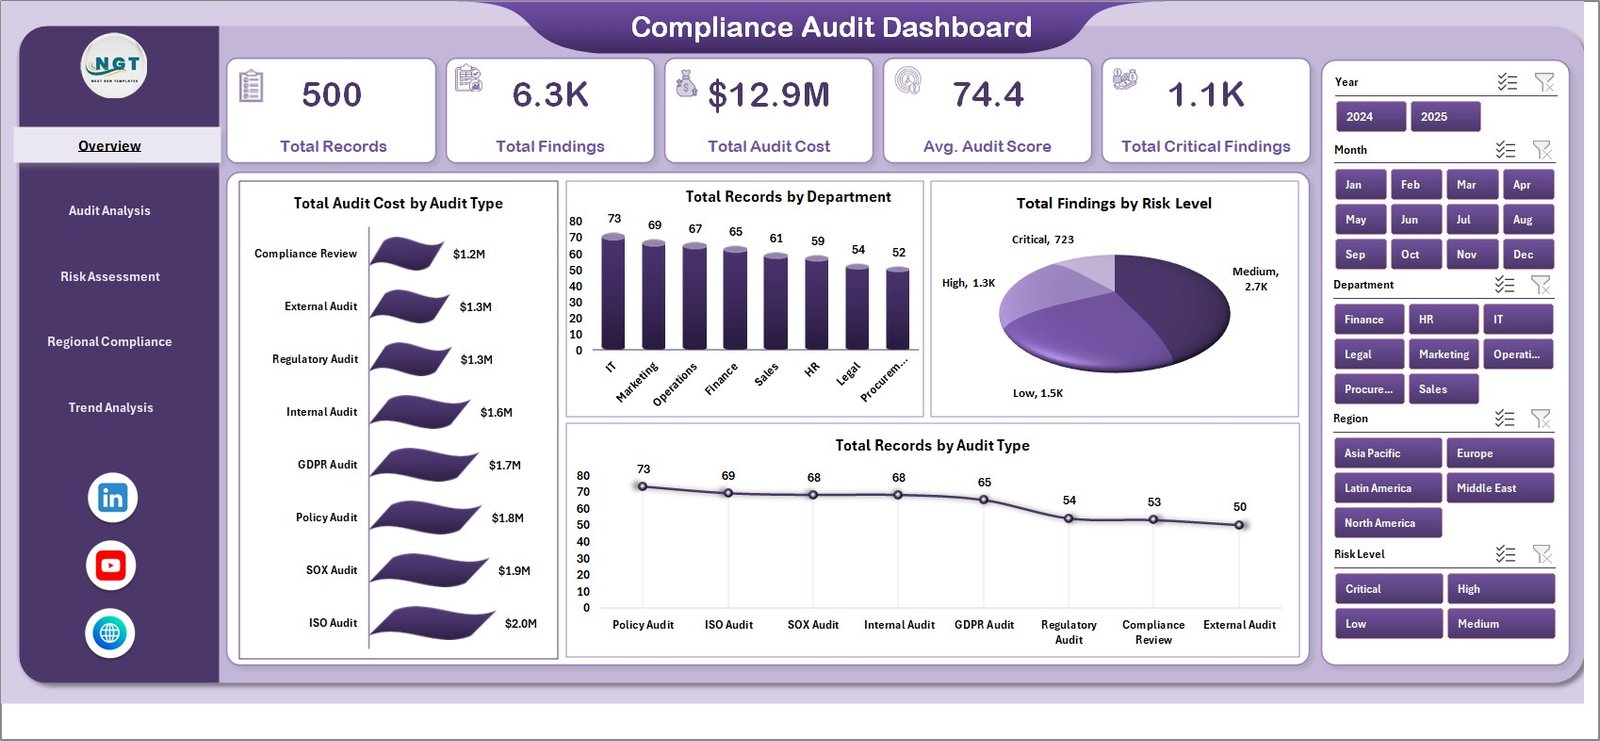
This dashboard is built for compliance and audit teams that need clear visibility across audit cycles, regions, and frameworks without paying for an enterprise GRC platform. The Overview page includes 5 headline cards: Total Records, Total Findings, Total Audit Cost, Avg. Audit Score, and Total Critical Findings. These cards help Chief Compliance Officers, Heads of Internal Audit, and audit committee chairs assess audit volume, financial impact, and critical-risk exposure at a glance.
The workbook includes multiple slicers so you can filter the dashboard quickly by department, region, audit type, risk level, compliance framework, priority, status, and month. Every page is powered by pivot tables, which means visuals refresh dynamically the moment you update the Data sheet with new audit records or remediation status.
Charts include Total Audit Cost by Audit Type, Total Findings by Risk Level, Total Findings vs Total Remediated by Compliance Framework, Total Audit Cost by Region, Total Penalties by Region, Total Records vs Total Findings by Year, and more. These views make the dashboard useful for monthly audit committee packs, quarterly board reporting, SOX testing reviews, ISO recertification audits, and regulator-facing compliance reports.
What’s Inside the Compliance Audits Dashboard in Excel
Overview Page
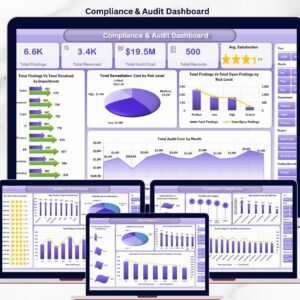
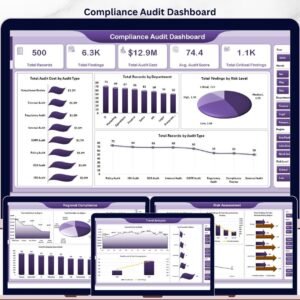
The main summary page displays Total Records, Total Findings, Total Audit Cost, Avg. Audit Score, and Total Critical Findings as 5 KPI cards. Total Audit Cost by Audit Type compares spend across internal, external, regulatory, and IT audits. Total Records by Department shows where audit activity is concentrated. Total Findings by Risk Level highlights critical, high, medium, and low-risk exposure. Total Records by Audit Type breaks down the audit portfolio mix.
Compliance Audits Dashboard in Excel
Audit Analysis
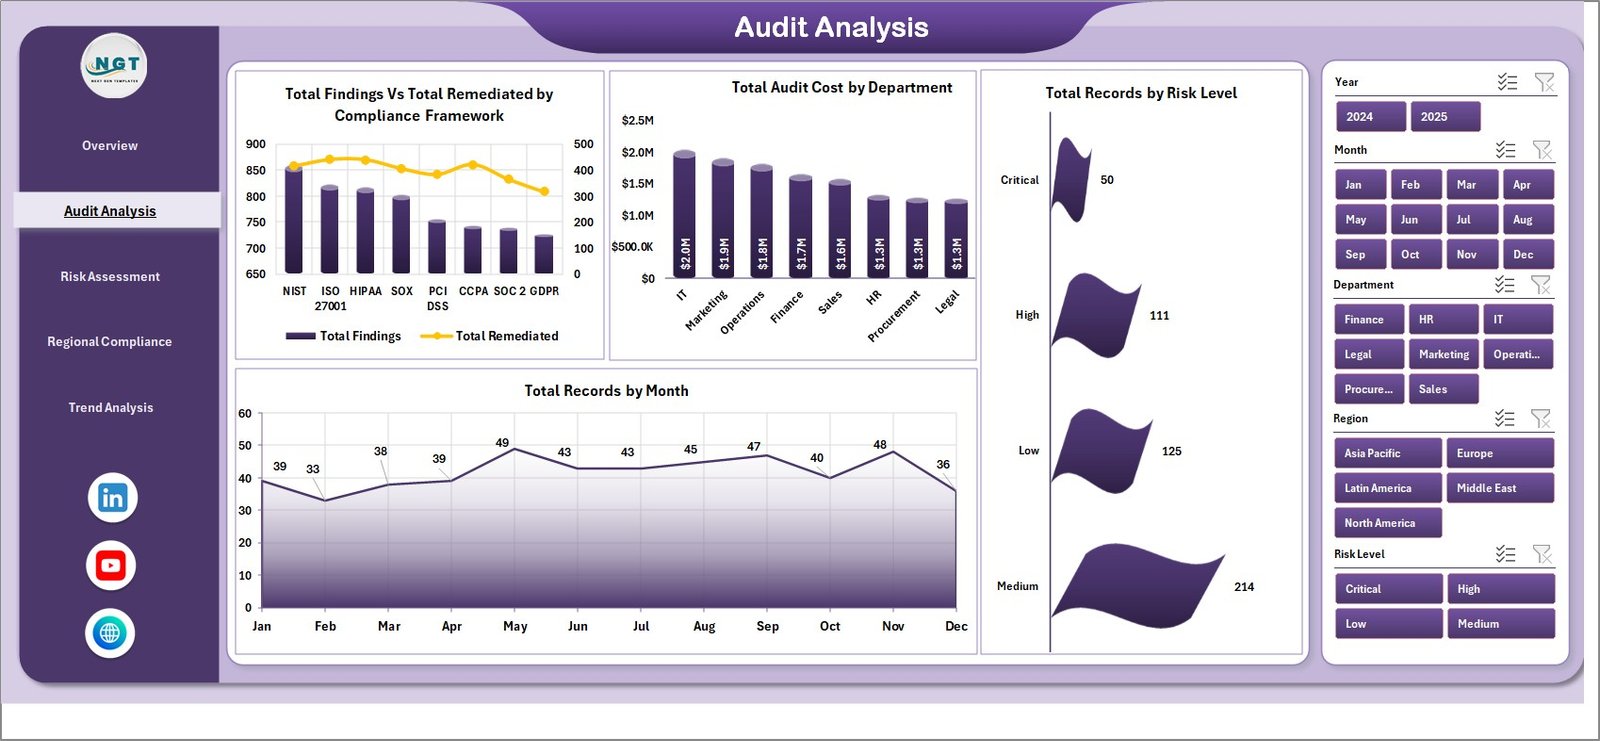
This sheet focuses on audit execution and remediation. Total Findings vs Total Remediated by Compliance Framework lets you compare progress across SOX, ISO 27001, GDPR, HIPAA, PCI-DSS, and internal control frameworks. Total Audit Cost by Department reveals which functions absorb the largest audit spend. Total Records by Risk Level shows the overall risk distribution, and Total Records by Month reveals audit cadence and seasonality.
Audit Analysis
Risk Assessment
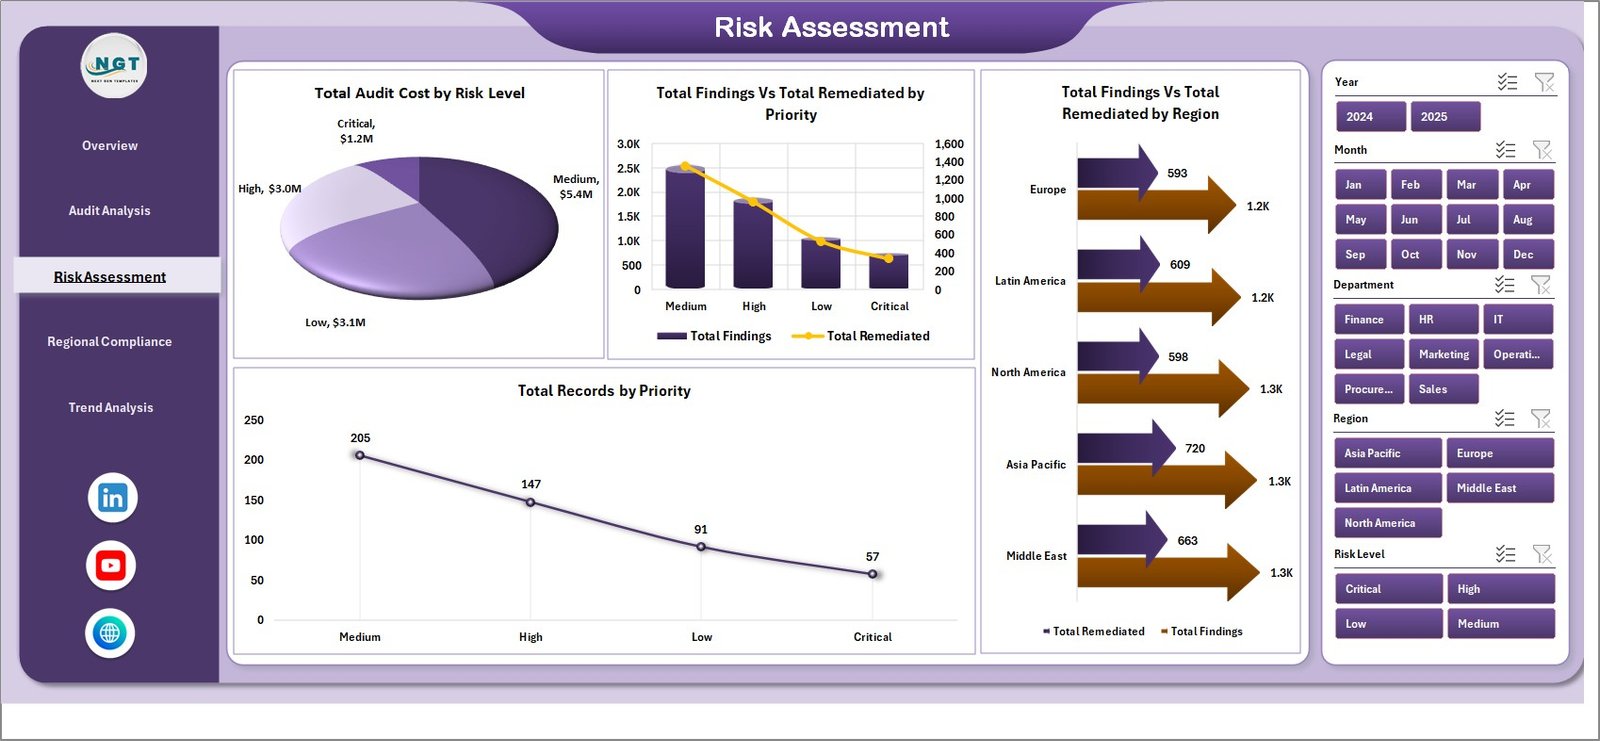
This page gives risk officers a focused lens on remediation priority. Total Audit Cost by Risk Level connects financial impact to risk severity. Total Findings vs Total Remediated by Priority shows whether high-priority findings are being closed first. Total Findings vs Total Remediated by Region highlights geographic remediation gaps, and Total Records by Priority confirms how the team is sequencing audit work.
Risk Assessment
Regional Compliance
This sheet supports multi-region compliance teams. Total Audit Cost by Region compares audit spend across geographies. Total Penalties by Region surfaces where regulatory fines are concentrated, so leadership can target compliance investment. Total Findings vs Total Remediated by Month tracks closure velocity, and Total Findings by Department identifies functions that need controls strengthening.
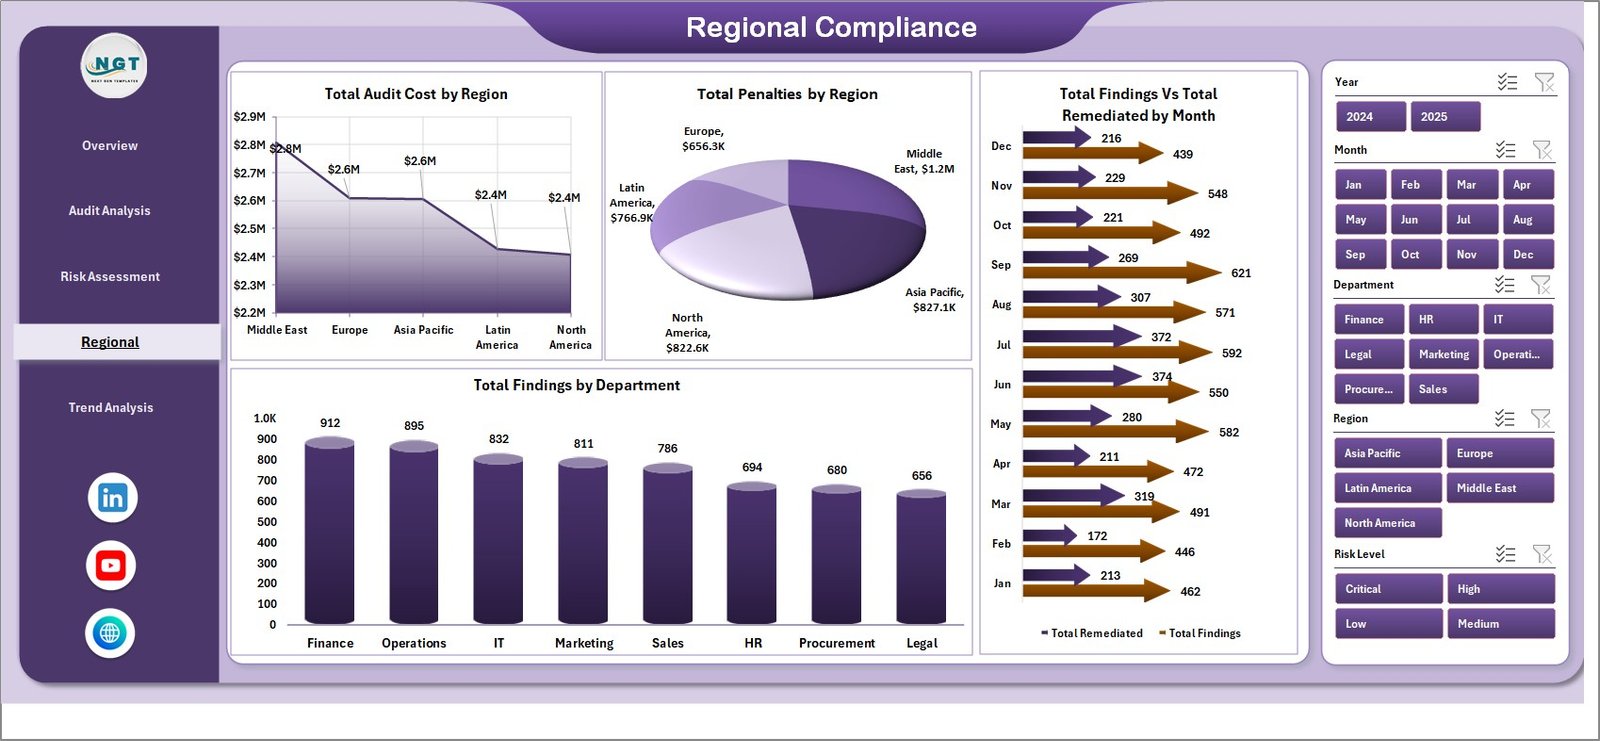
Regional Compliance
Trend Analysis
This page is built for year-over-year reporting and audit committee narratives. Total Audit Cost by Month reveals spending patterns across the audit calendar. Total Records by Status shows the open, in-progress, closed, and overdue audit pipeline. Total Records vs Total Findings by Year supports multi-year trend reporting for the audit committee and board risk committee.
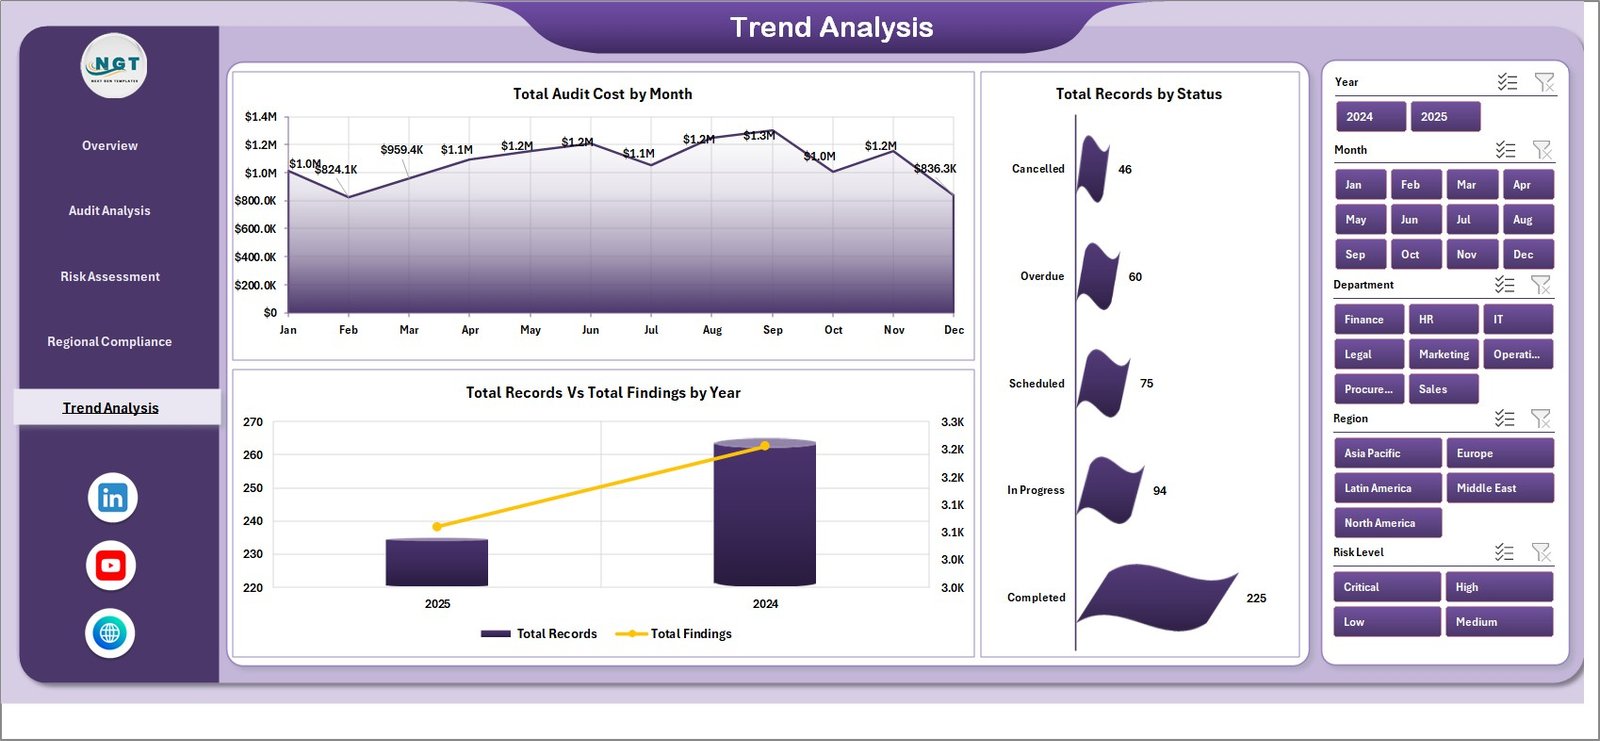
Trend Analysis
Data Sheet
Add your audit records in the same structure as the sample data: date, audit type, department, region, compliance framework, risk level, priority, status, findings, remediated count, audit cost, penalties, audit score. Keep the headers consistent, paste your records, and refresh the workbook.
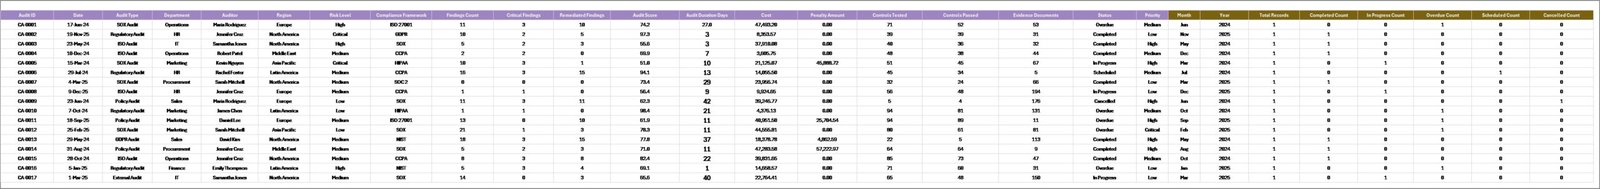
Data Sheet tab
Support Sheet
This sheet contains the pivot tables that power every dashboard chart and KPI card. After updating the Data sheet, open the Excel Data ribbon and click Refresh All. You can keep this sheet hidden when sharing the dashboard with the audit committee, regulators, or external auditors.
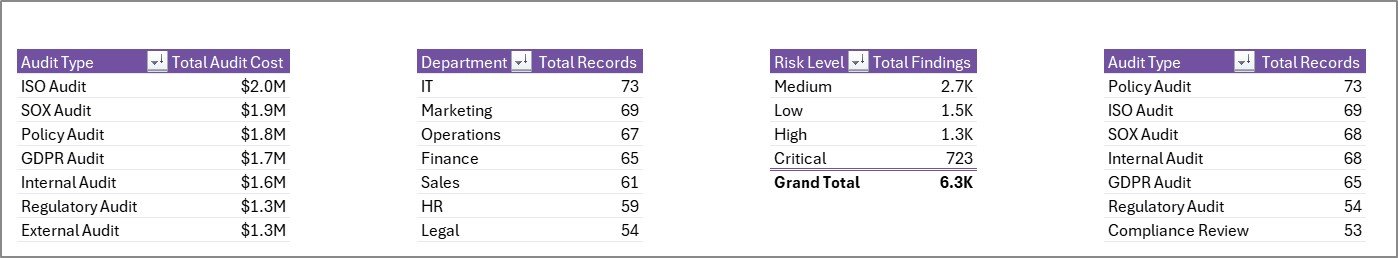
Support sheet tab
Compliance Audit Dashboard in Excel vs. Google Sheets vs. Paid GRC Platforms – Where This Fits
| Feature | Compliance Audit Dashboard in Excel | Google Sheets Alternative | Paid GRC Platform (AuditBoard / LogicGate / MetricStream) |
|---|---|---|---|
| Cost | $17.99 one-time | $9.99 one-time browser version | Often $30,000 to $250,000+ per year |
| Platform | Microsoft Excel desktop workbook | Google Sheets cloud file | Hosted GRC SaaS platform |
| Setup time | Under 10 minutes | Under 10 minutes | Several months of onboarding and integration |
| Customizable fields | Fully editable Excel data and pivots | Editable sheet and formulas | Depends on vendor configuration and admin role |
| Refresh method | Data tab, Refresh All | Formula and chart recalculation | Automated integrations |
| Audit committee reporting | Built in | Built in | Built in |
| Year-1 cost at 5 users | $17.99 total | $9.99 total | Often $30,000 to $250,000+ |
Who This Template Is For – and Who It’s Not For
This template is ideal for Chief Compliance Officers, Heads of Internal Audit, GRC managers, risk officers, compliance analysts, SOX testers, and Big Four audit consultants who need a practical compliance and audit reporting workbook. It is especially useful for teams tracking 50 to 5,000 audit findings from internal records and exports rather than real-time API feeds.
It is not the right fit if you need automated control testing, evidence collection workflows, SOC 2 audit logs, SSO, or live sync from ServiceNow GRC, AuditBoard, LogicGate, or MetricStream. In those cases, a paid GRC platform may be a better choice. This dashboard is the reporting layer that sits on top of your audit records.
How to Use the Compliance Audit Dashboard in Excel
- Download and unzip the product file.
- Open the Excel workbook in Microsoft Excel 2016 or later.
- Go to the Data Sheet tab and replace the sample rows with your audit records.
- Keep the same column headers and data structure.
- Open the Excel Data ribbon and click Refresh All.
- Use the slicers on each dashboard page to filter by department, region, audit type, risk level, framework, priority, status, and month.
- Hide the Support Sheet before sharing if you want a cleaner audit committee view.
Real-World Use Cases
Anita, Head of Internal Audit at a Fortune 500 manufacturer, uses the Overview and Risk Assessment pages before quarterly audit committee meetings. She filters by department and priority to highlight high-risk findings that have not yet been remediated.
Marco, a SOX program manager, uses the Audit Analysis page to show Total Findings vs Total Remediated by Compliance Framework. The chart helps him prove SOX readiness to external auditors.
Priya, a Big Four GRC consultant, duplicates the workbook for each client engagement and uses the Regional Compliance page to compare audit cost and penalties across regions in a single chart-driven view.
Frequently Asked Questions
What KPIs are included in the Compliance Audit Dashboard in Excel?
The Overview page includes Total Records, Total Findings, Total Audit Cost, Avg. Audit Score, and Total Critical Findings.
Can I update the dashboard with my own audit data?
Yes. Replace the sample rows in the Data Sheet, keep the same headers, and click Refresh All from the Excel Data ribbon.
Does this dashboard use macros?
No. The dashboard is designed around Excel tables, pivot tables, charts, and slicers, so it does not require VBA macros and opens cleanly on managed audit laptops.
Can I customize the charts and add new compliance frameworks?
Yes. You can edit chart formatting, adjust pivot fields, add slicers, and extend the workbook with new frameworks, departments, or regions as needed.
Is this a replacement for Audit Board or Logic Gate?
It replaces many manual reporting needs, but it is not a full GRC automation platform. It is best for reporting, analysis, and audit committee review workflows.
Will it work on Excel for Mac?
Yes, it works in modern Excel versions on Windows and Mac. Pivot refresh is most reliable in the desktop Excel app.
About the Author
Built by PK – Microsoft Certified Professional with 15+ years of Excel, Google Sheets, and Power BI experience. Founder of NextGenTemplates, reaching 300K+ subscribers across YouTube channels. Every template is hand-built and tested before release.
Explore Related Templates
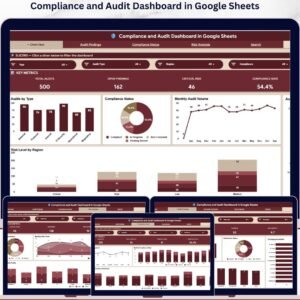
Also available as: Compliance and Audits Dashboard in Google Sheets for browser-based team collaboration, and Compliance and Audit Dashboard in Power BI for teams running Power BI Desktop. Pair this workbook with the Excel Dashboard Templates collection for more compliance, finance, and operations dashboards.
Download the Compliance Audit Dashboard in Excel today and start reviewing audit findings, remediation progress, audit cost, penalties, and risk concentration in one workbook.


Reviews
There are no reviews yet.