

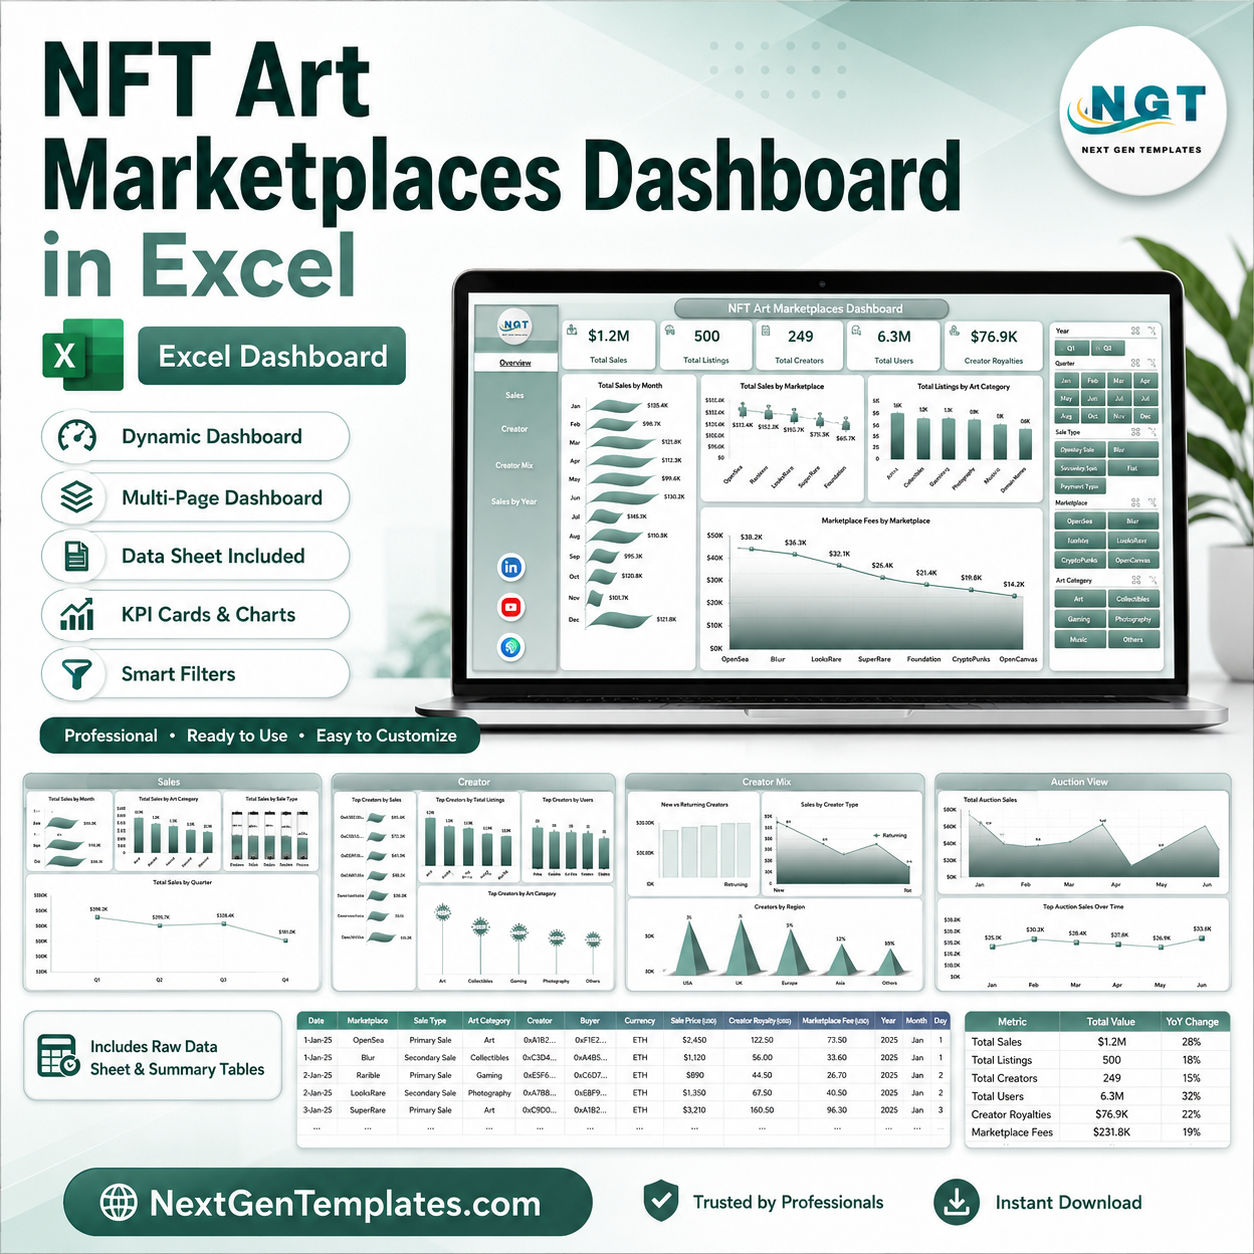



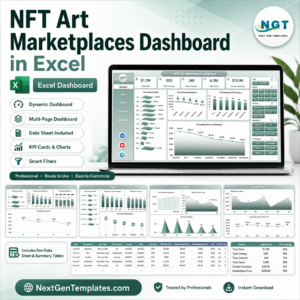
NFT Art Marketplaces Dashboard in Excel gives marketplace operators, NFT artists, collection managers, and Web3 analysts a ready-to-use reporting workbook with 7 sheet tabs, 5 executive KPI cards, 19 dashboard charts, slicer-based filtering, editable source data, and a refreshable pivot support layer. For a one-time price, you can track sales, listings, views, bids, gas fees, royalties, marketplace fees, blockchain mix, auction activity, and creator performance without paying for a recurring analytics platform. Replace the sample data, refresh the workbook, and keep full control of every field, chart, formula, and slicer inside Microsoft Excel.
Key Features of NFT Art Marketplaces Dashboard in Excel
- 7 connected Excel tabs: Overview, Sales, Creator, Chain Mix, Auction View, Data Sheet, and Support Sheet.
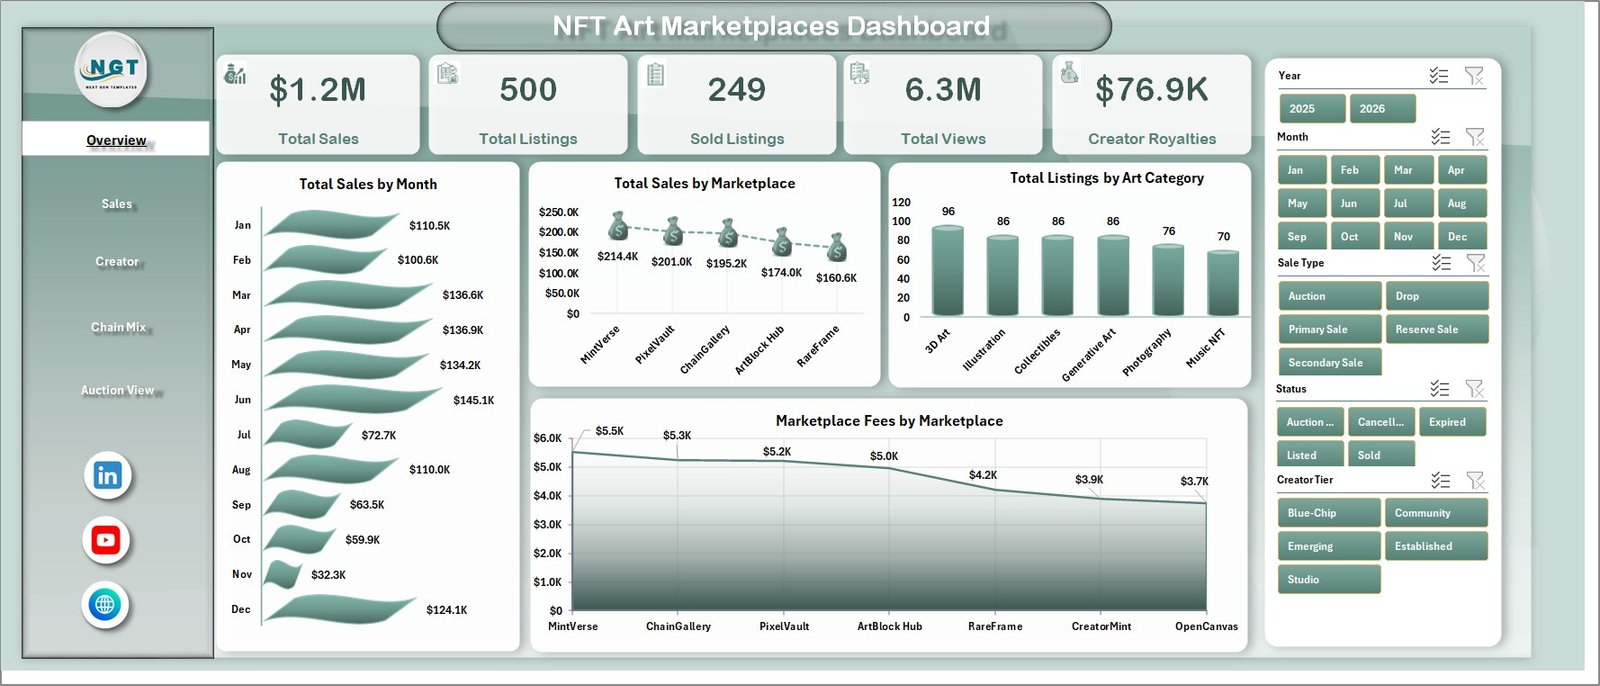
- 5 top KPI cards: Total Sales, Total Listings, Sold Listings, Total Views, and Creator Royalties.
- 19 analytical charts: Review monthly sales, marketplace performance, art categories, fees, gas costs, buyer regions, creator tiers, blockchain mix, auctions, bids, and status.
- Interactive slicers: Filter marketplace, blockchain, creator tier, buyer region, art category, sale type, status, and period views quickly.
- Editable Data Sheet: Replace sample rows in the same format and keep the full dashboard model working.
- Refreshable Support Sheet: Pivot tables power the visuals and can be refreshed from the Excel Data ribbon.
What’s Inside the NFT Art Marketplaces Dashboard in Excel
The workbook is organized for practical NFT marketplace reporting. The Overview tab gives leadership a fast performance read. Sales focuses on buyer and monetization analysis. Creator highlights collection and royalty performance. Chain Mix compares blockchain, region, and bid behavior. Auction View tracks listing status and live auction movement. The Data Sheet stores the source records, while the Support Sheet contains the pivot tables behind the charts.
Overview Page
The Overview page shows Total Sales, Total Listings, Sold Listings, Total Views, and Creator Royalties. Charts include Total Sales by Month, Total Sales by Marketplace, Total Listings by Art Category, and Marketplace Fees by Marketplace so teams can spot revenue concentration, listing mix, and fee pressure quickly.
Sales Page
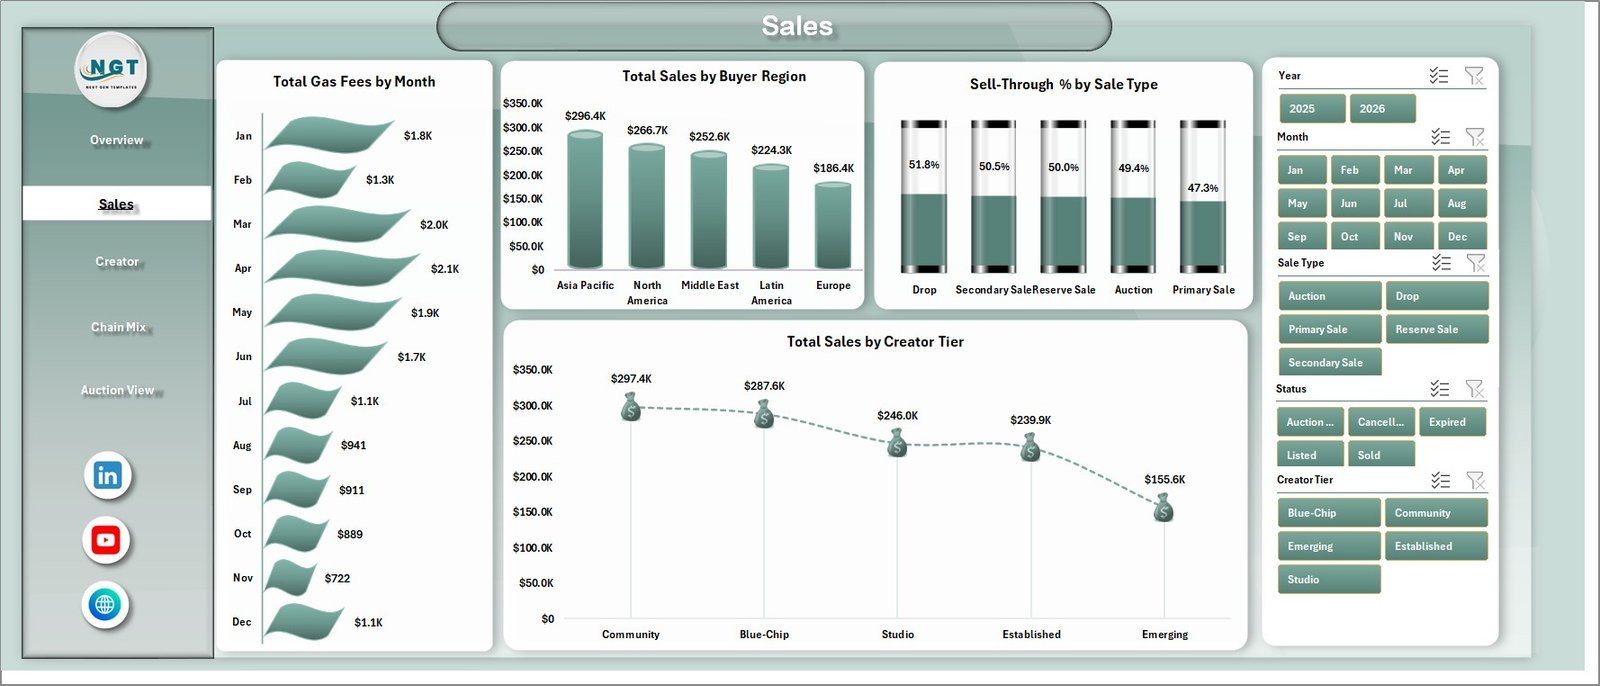
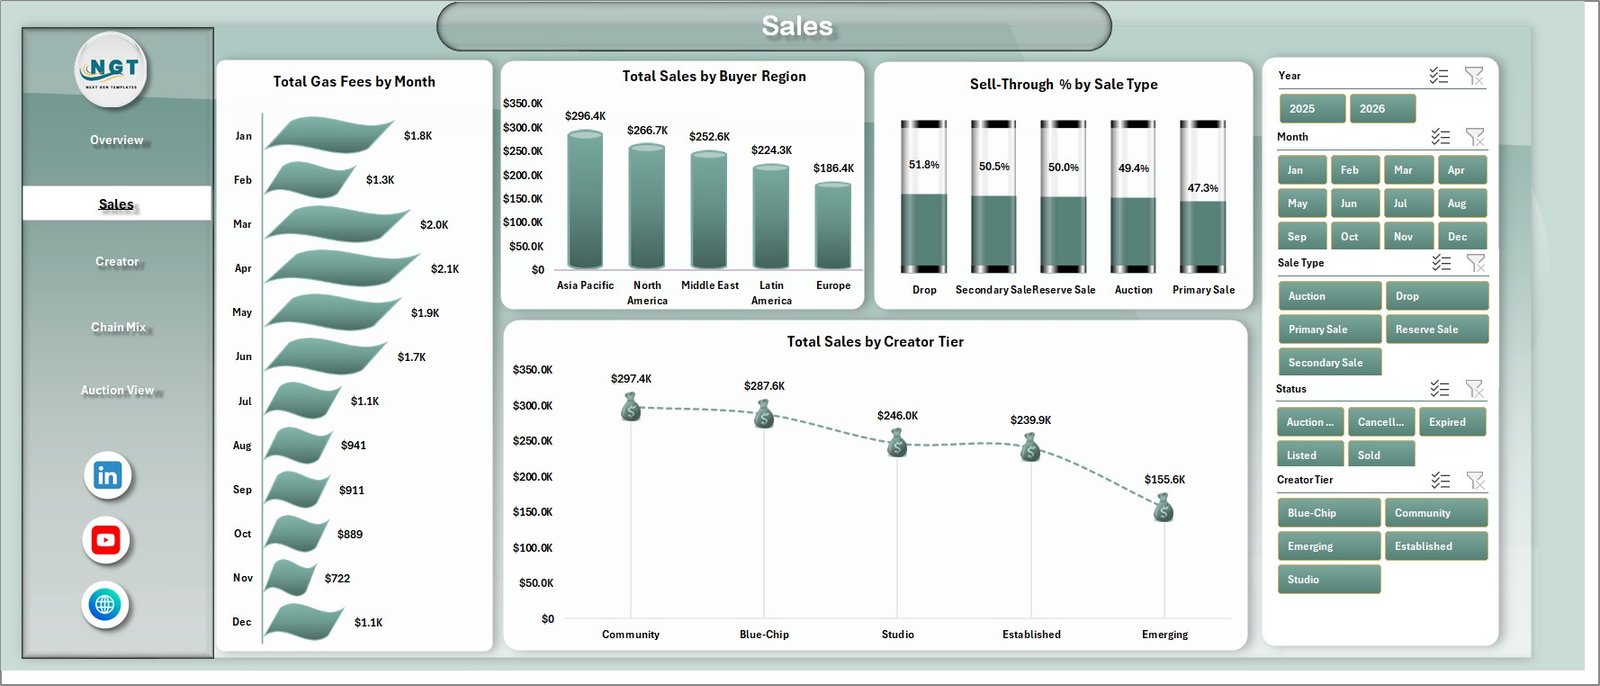
The Sales tab analyzes Total Gas Fees by Month, Total Sales by Buyer Region, Sell-Through % by Sale Type, and Total Sales by Creator Tier. This helps marketplace teams understand transaction costs, regional demand, auction versus fixed-price performance, and creator-level revenue contribution.
Creator Page
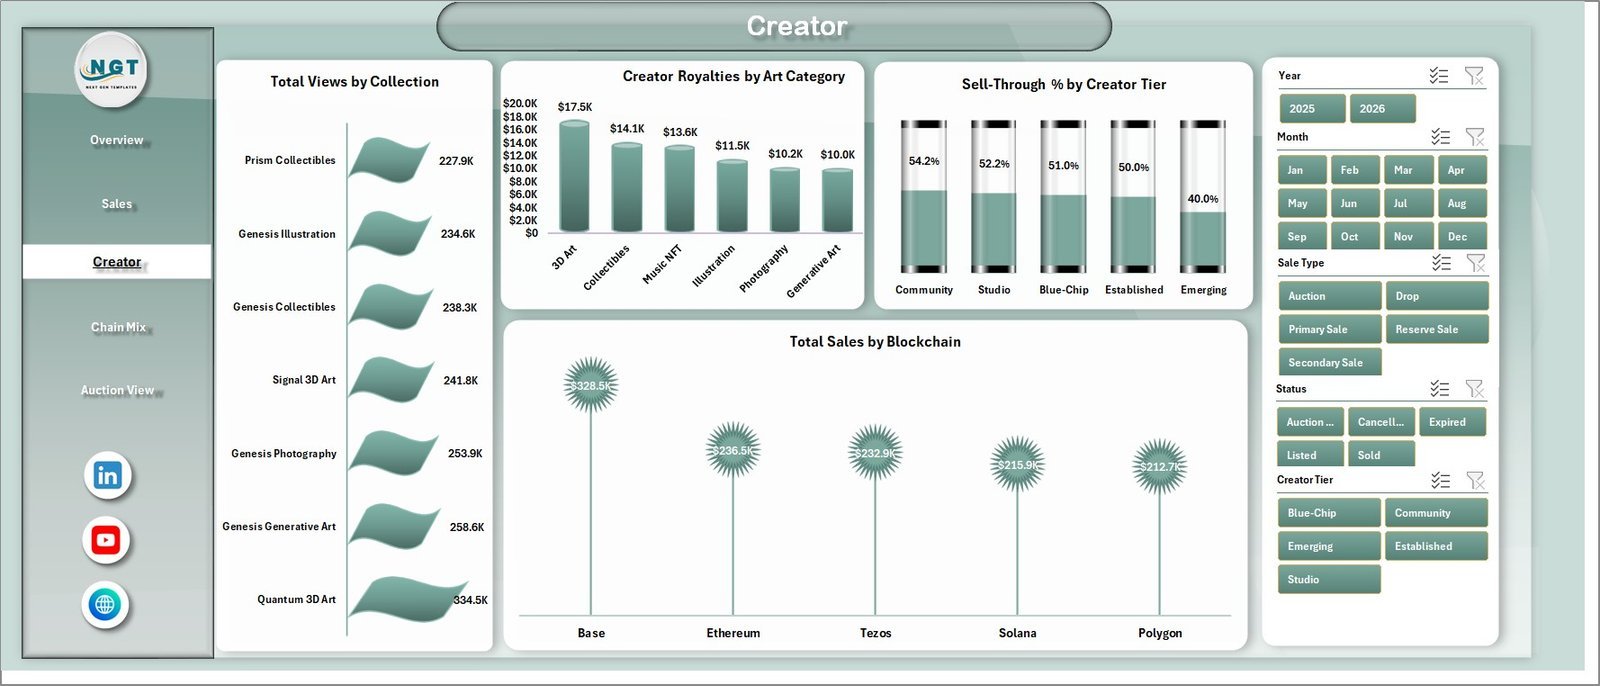
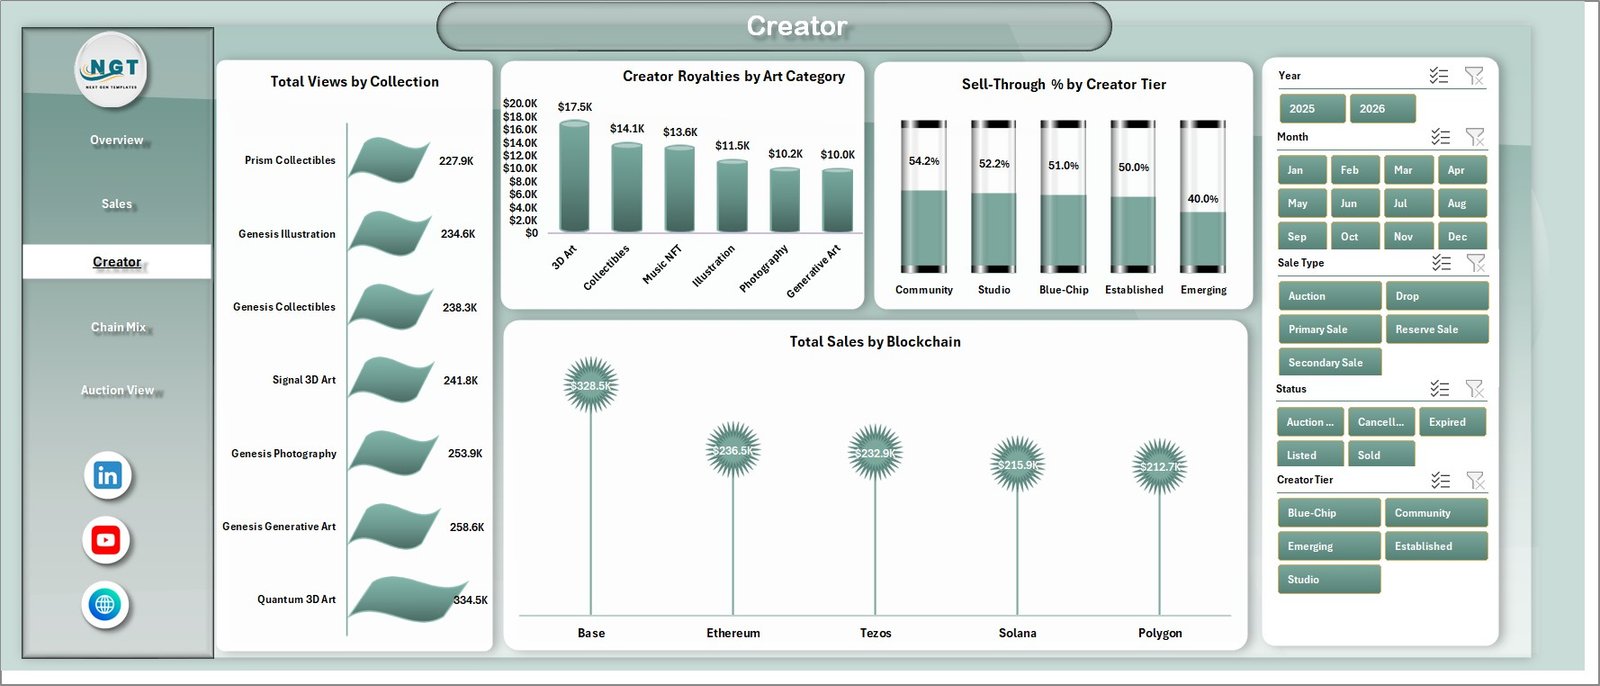
The Creator tab shows Total Views by Collection, Creator Royalties by Art Category, Sell-Through % by Creator Tier, and Total Sales by Blockchain. It is useful for reviewing which collections attract attention, which categories generate royalties, and how creator tiers perform across blockchain networks.
Chain Mix Page
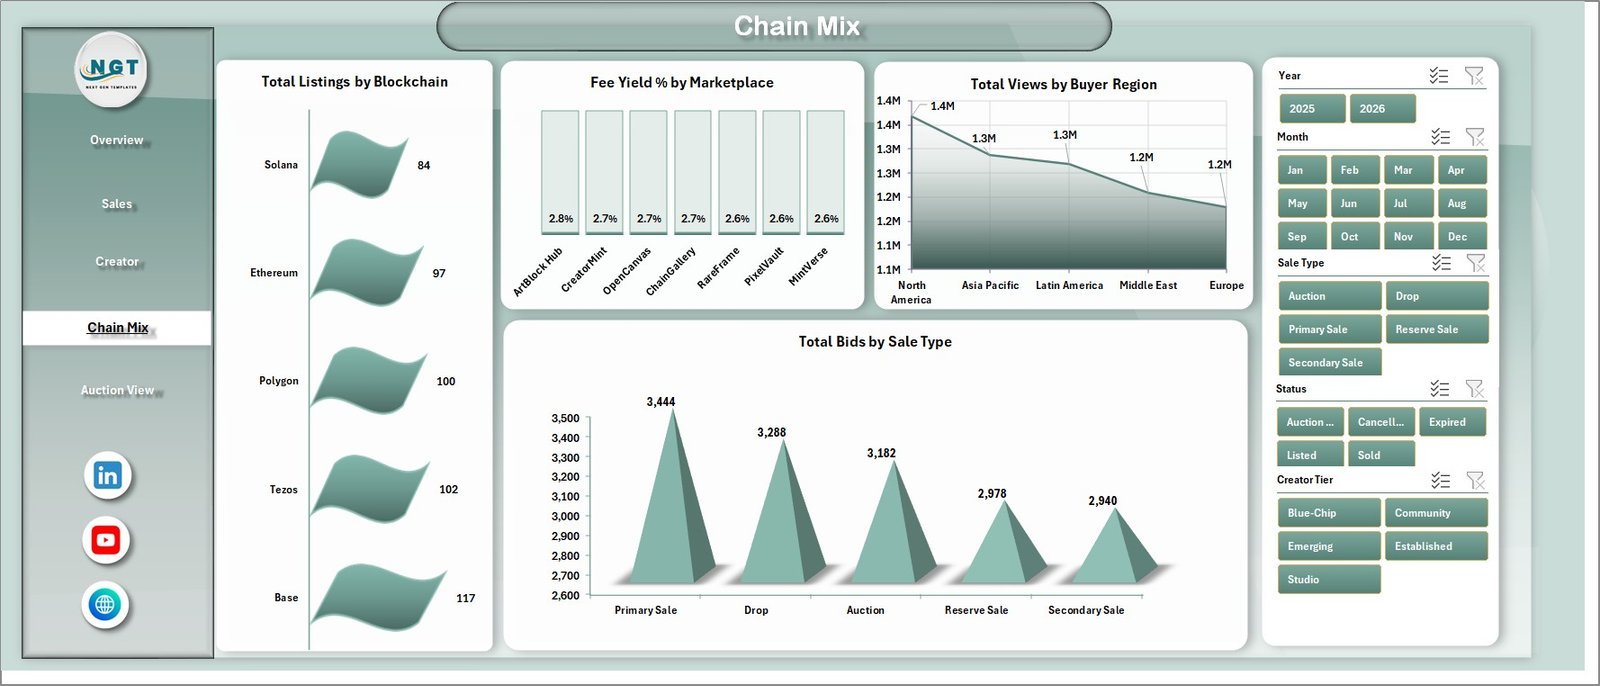
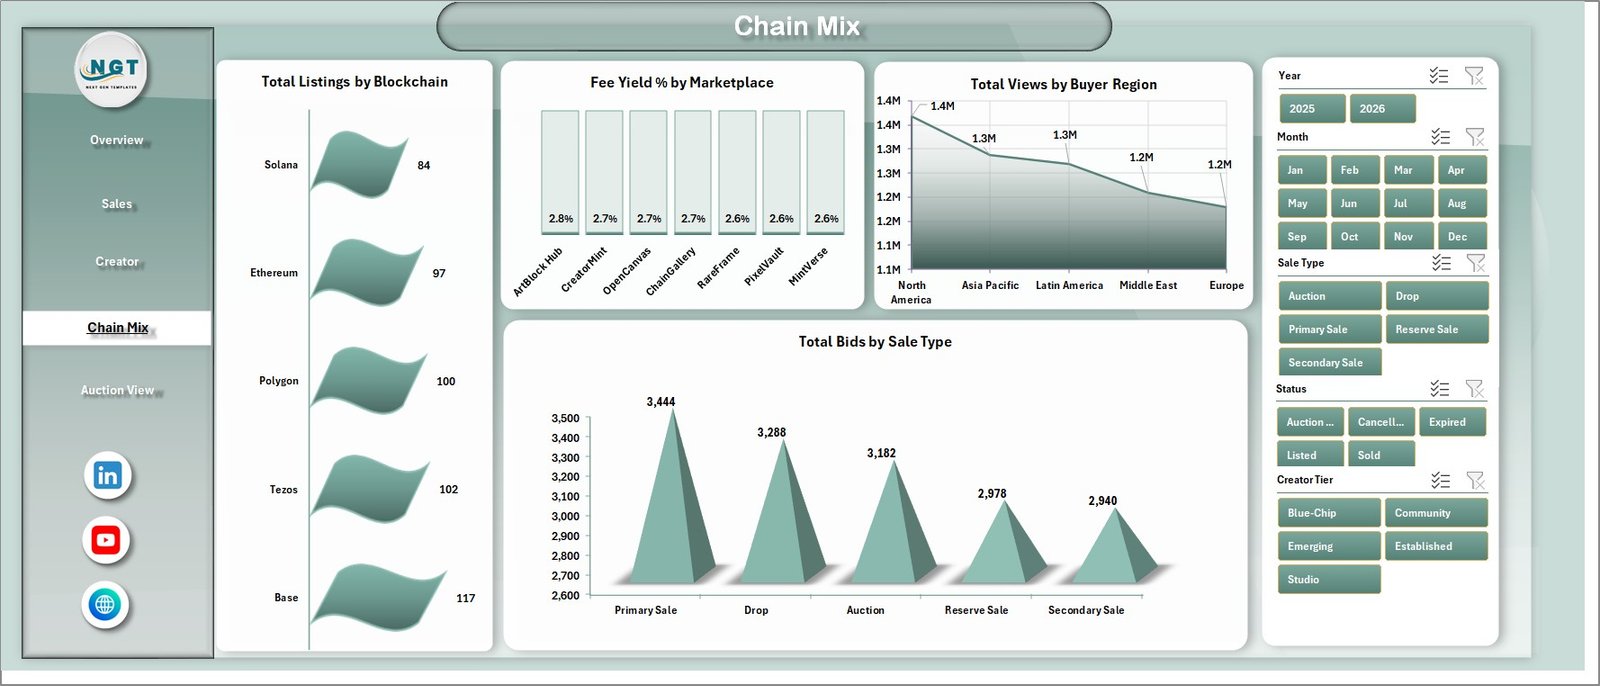
The Chain Mix tab compares Total Listings by Blockchain, Fee Yield % by Marketplace, Total Views by Buyer Region, and Total Bids by Sale Type. This view helps teams understand network distribution, marketplace economics, geographic engagement, and bid behavior across sale models.
Auction View
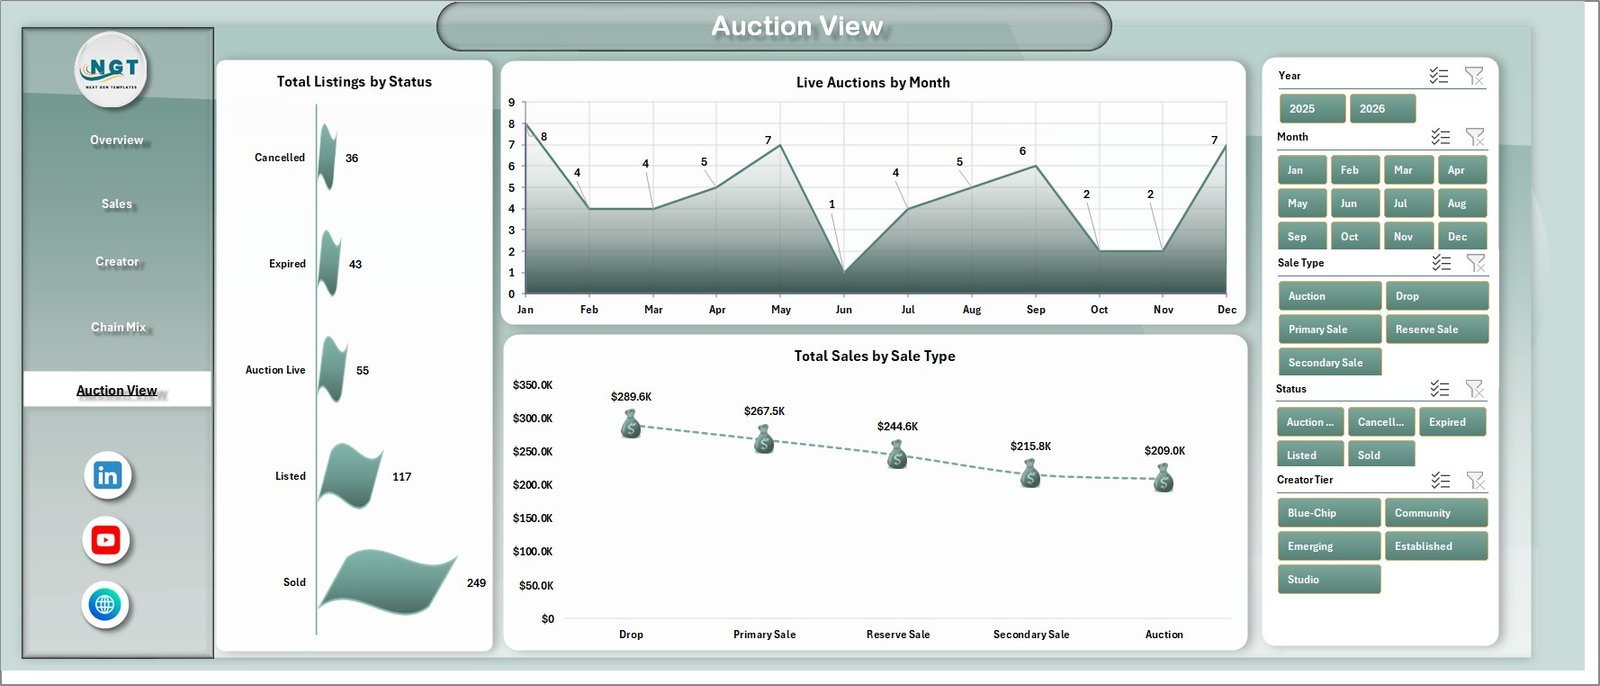
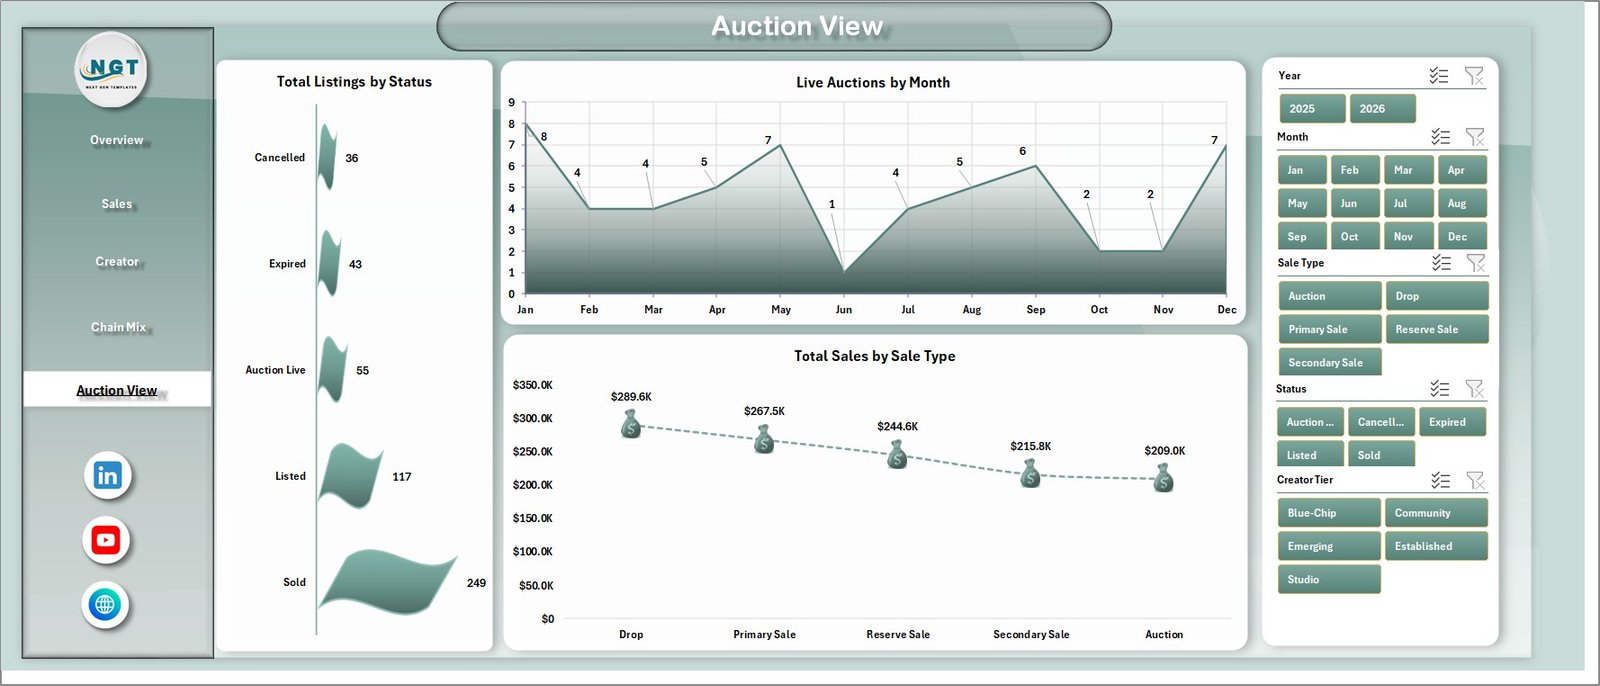
The Auction View tab focuses on Total Listings by Status, Live Auctions by Month, and Total Sales by Sale Type. It gives marketplace managers a quick way to review listing inventory, auction momentum, and the revenue split between auction and direct sale activity.
Data Sheet and Support Sheet
The Data Sheet is where users enter or paste marketplace records in the same structure as the sample data. The Support Sheet contains the pivot tables used to build the dynamic dashboard. After updating the Data Sheet, go to the Excel Data tab and click Refresh All; the pivots, slicers, KPI cards, and charts refresh from the latest data. You can keep the Support Sheet hidden for day-to-day use.


NFT Art Marketplaces Dashboard in Excel vs. Google Sheets vs. Paid CRM/SaaS – Where This Fits
| Feature | This Excel Dashboard | Google Sheets Alternative | Paid SaaS Alternative |
|---|---|---|---|
| Cost | $17.99 one-time | Template or workspace cost | Monthly subscription |
| Platform | Microsoft Excel | Browser spreadsheet | Vendor cloud system |
| Setup time | Under 10 minutes | Under 15 minutes | Days to weeks |
| Real-time team collaboration | Available through OneDrive or SharePoint | Native browser sharing | Usually included |
| Mobile access | Excel app | Sheets app | Usually included |
| Customizable fields | Fully editable | Fully editable | Often plan-limited |
| Year-1 cost at 5 users | $17.99 plus Excel licensing if needed | Template plus workspace cost | Often $600 to $6,000+ |
| NFT-specific pivots | Included | Requires setup | Depends on product tier |
Who This Template Is For – and Who It’s Not For
This template is for NFT marketplace founders, digital art teams, creator success managers, analysts, collectors, and agencies that want a structured Excel reporting file for sales, listings, royalties, bids, views, gas fees, and marketplace fees.
This template is not for teams that need live blockchain API sync, wallet-level transaction automation, smart contract indexing, or enterprise permission workflows. In those cases, use this dashboard as a reporting layer beside a specialized Web3 data stack.
How to Use the NFT Art Marketplaces Dashboard in Excel
- Download and open the workbook in Microsoft Excel.
- Go to the Data Sheet and replace the sample records using the same column format.
- Use the Excel Data ribbon and click Refresh All.
- Open each dashboard tab and use slicers to filter by marketplace, blockchain, creator tier, region, category, sale type, and status.
- Keep the Support Sheet hidden if you only want users to see dashboard pages.
Real-World Use Cases
Maya, an NFT marketplace operator, uses the Overview and Auction View tabs to review sales, sold listings, live auctions, and marketplace fee patterns before weekly growth meetings.
Dev, a creator relations manager, uses the Creator tab to compare views, royalties, sell-through rates, and blockchain performance across collections and creator tiers.
Arun, a Web3 analyst, updates the Data Sheet with monthly exports and refreshes all pivots to prepare clean reports for investors and community updates.
Frequently Asked Questions
What does this NFT Art Marketplaces Dashboard in Excel track?
It tracks sales, listings, sold listings, views, creator royalties, gas fees, marketplace fees, buyer regions, creator tiers, blockchain mix, art categories, bids, auction status, and sale types.
Can I replace the sample data?
Yes. Add your own records to the Data Sheet in the same format, then use Refresh All to update the pivot tables, charts, slicers, and KPI cards.
Does the dashboard use pivot tables?
Yes. The Support Sheet contains multiple pivot tables that power the dashboard dynamically. You can keep this sheet hidden after setup.
Do I need advanced Excel skills?
No. Basic Excel skills are enough for replacing data, refreshing pivots, using slicers, and reading charts.
Is it connected to live NFT marketplaces automatically?
No. This is a structured Excel dashboard for manual data entry or exported marketplace data. You can add your own connector or Power Query workflow if needed.
Can I customize the charts?
Yes. Because it is an Excel workbook, you can edit chart types, colors, slicers, formulas, and source fields.
About the Author
Built by PK – Microsoft Certified Professional with 15+ years of Excel, Google Sheets, and Power BI experience. Founder of NextGenTemplates, reaching 300K+ subscribers across YouTube channels. Every template is hand-built and tested before release.
Explore Related Templates
- NFT Marketplaces KPI Dashboard in Excel for KPI-style NFT performance tracking.
- AI Art Studios Dashboard in Power BI for creative business analytics.
- Browse more Excel Dashboard templates.
- Explore all MS Excel templates.
Ready to monitor NFT art marketplace performance in Excel? Download the NFT Art Marketplaces Dashboard in Excel, replace the sample data, refresh all pivots, and start reviewing sales, listings, royalties, bids, and blockchain mix in minutes.





























Reviews
There are no reviews yet.