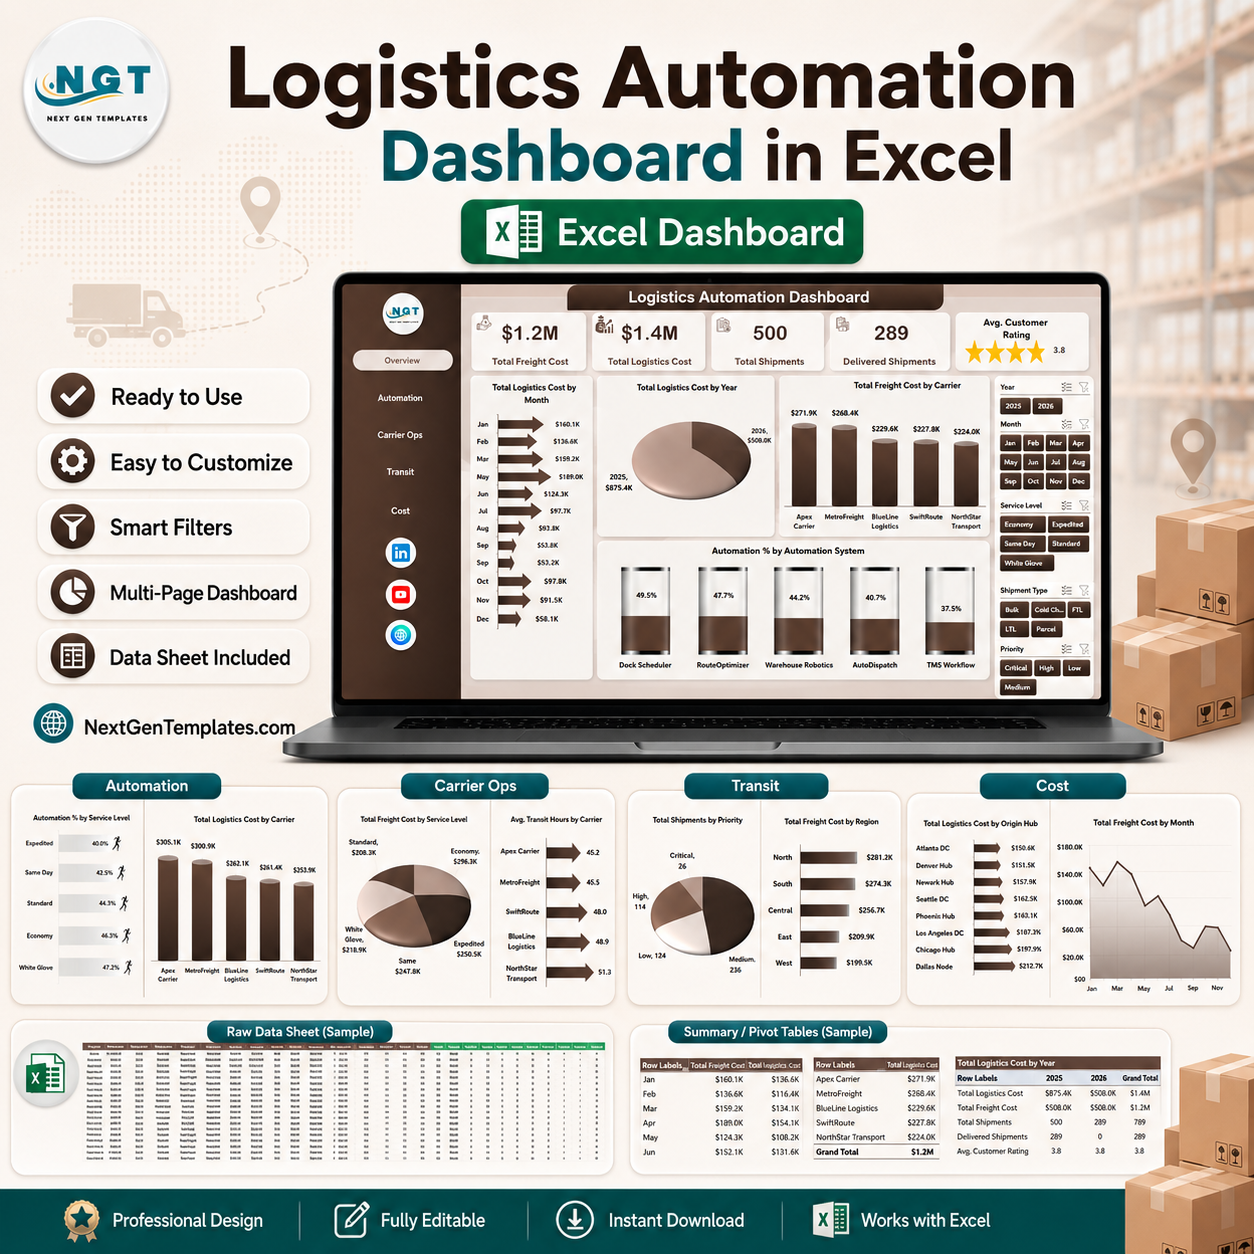


Logistics Automation Dashboard in Excel gives logistics, carrier operations, warehouse, and supply chain teams 5 interactive dashboard pages, 5 executive KPI cards, 20 analysis charts, slicers, a structured Data Sheet, and a pivot-powered Support Sheet in one editable Excel workbook. Instead of rebuilding shipment reports manually every week, you can paste your logistics data, click Refresh All, and review cost, carrier, automation, transit, service level, region, priority, and exception trends quickly. Join 8,400+ teams using NextGenTemplates to replace recurring reporting software with one-time editable templates. Instant download, lifetime file access, and a practical risk reversal: update the sample data first, then adapt the workbook to your operation.
Key Features of Logistics Automation Dashboard in Excel
- 5 dashboard pages: Overview, Automation, Carrier Ops, Transit, and Cost.
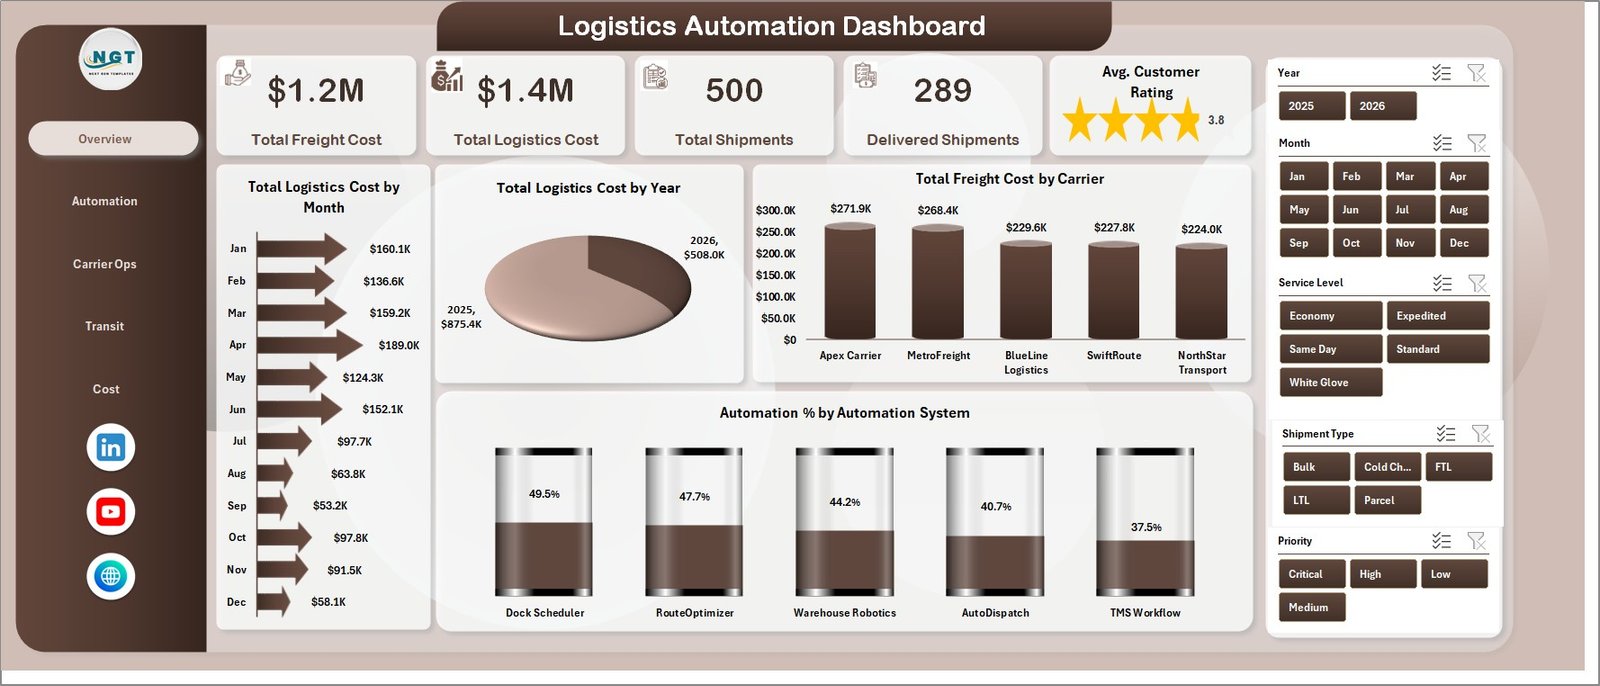
- Executive KPI cards: Total Freight Cost, Total Logistics Cost, Total Shipments, Delivered Shipments, and Avg. Customer Rating.
- Automation tracking: Review Automation % by Service Level, Region, and Automation System.
- Carrier operations analysis: Compare transit hours, freight cost, shipment type, and service level performance.
- Transit monitoring: Track on-time shipments by region, priority, exception type, and regional freight cost.
- Cost breakdowns: Analyze logistics cost by origin hub, quarter, destination hub, carrier, and month.
- Pivot-driven Excel design: Update the Data Sheet, click Refresh All, and charts refresh dynamically.
What’s Inside the Logistics Automation Dashboard in Excel
The Overview Page starts with high-level cards for Total Freight Cost, Total Logistics Cost, Total Shipments, Delivered Shipments, and Avg. Customer Rating. These cards help managers see cost scale, delivery volume, fulfillment output, and customer feedback before moving into detail.
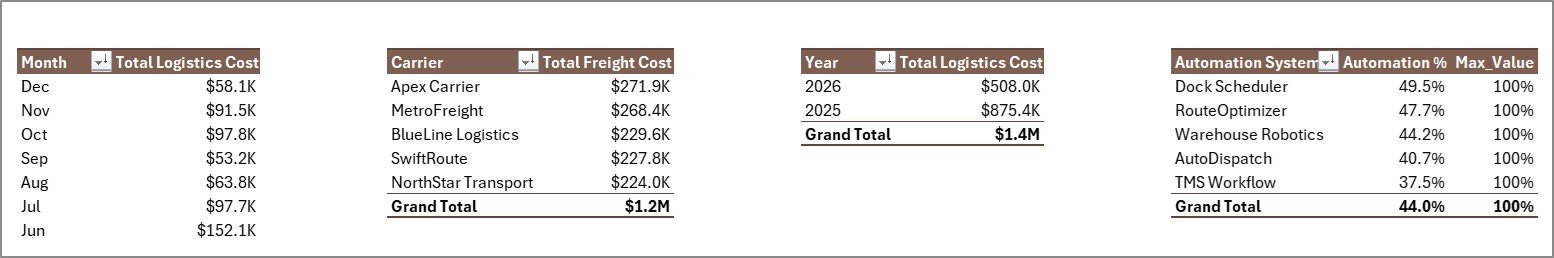
Total Logistics Cost by Month: This trend shows how logistics spending changes across the year, making seasonal cost pressure easier to spot. Use it to compare monthly movement after automation changes, carrier changes, or route planning updates.
Total Logistics Cost by Year: This chart gives a long-term view of annual logistics spend. It is useful for leadership reviews, budget planning, and year-over-year cost control.
Total Freight Cost by Carrier: This view compares freight spend across carriers. It helps procurement and logistics teams review carrier dependency and identify partners that need renegotiation or deeper performance checks.
Automation % by Automation System: This chart shows how automation adoption differs by system. It helps teams understand which automation tools are actually supporting shipment processing and where manual work is still high.
Logistics Automation Dashboard in Excel
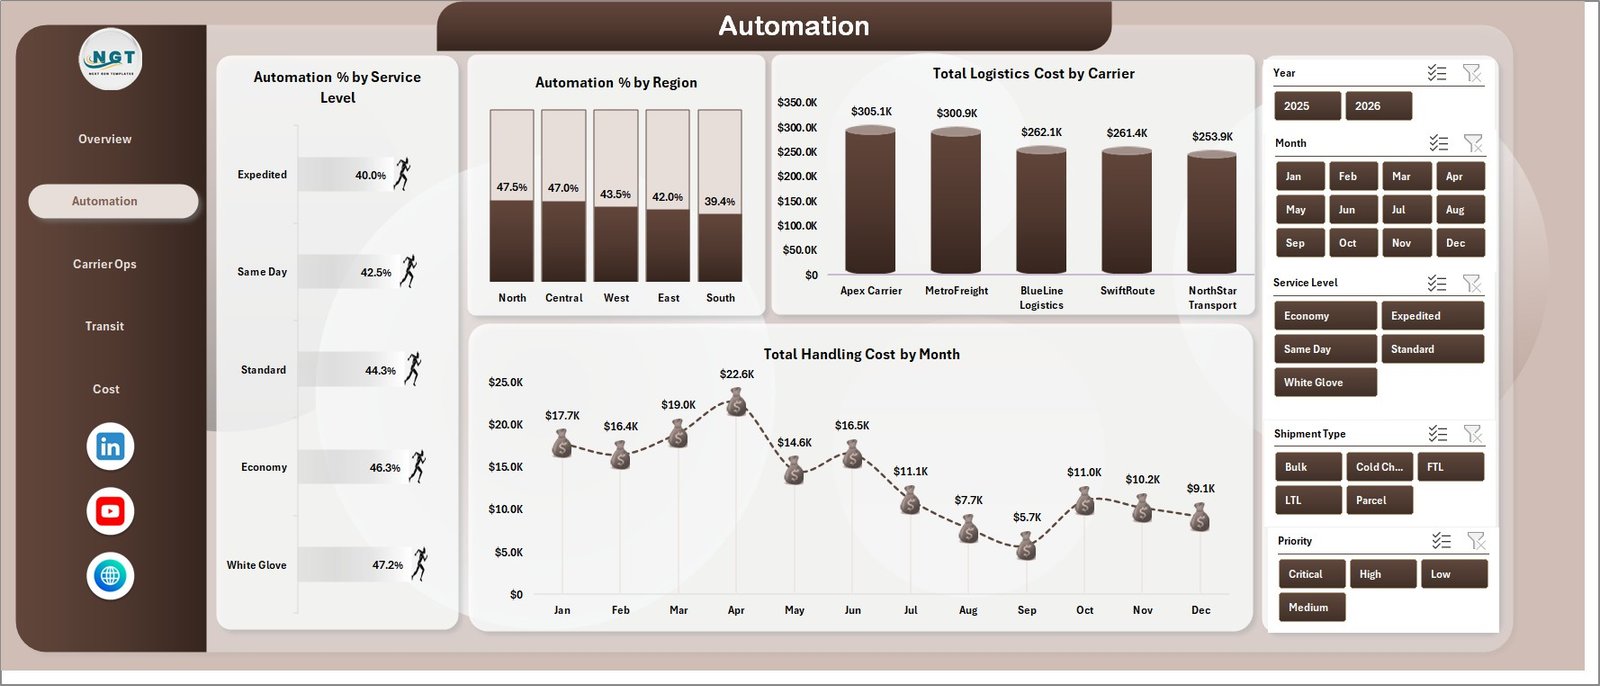
The Automation page focuses on how automation is used across service levels, regions, carriers, and handling activity. Automation % by Service Level compares automation adoption across standard, express, same-day, scheduled, or other service categories. Automation % by Region shows which operating territories are more automated and which may still depend on manual processes. Total Logistics Cost by Carrier connects automation review with carrier cost impact. Total Handling Cost by Month shows whether handling spend is rising or falling over time.
Automation
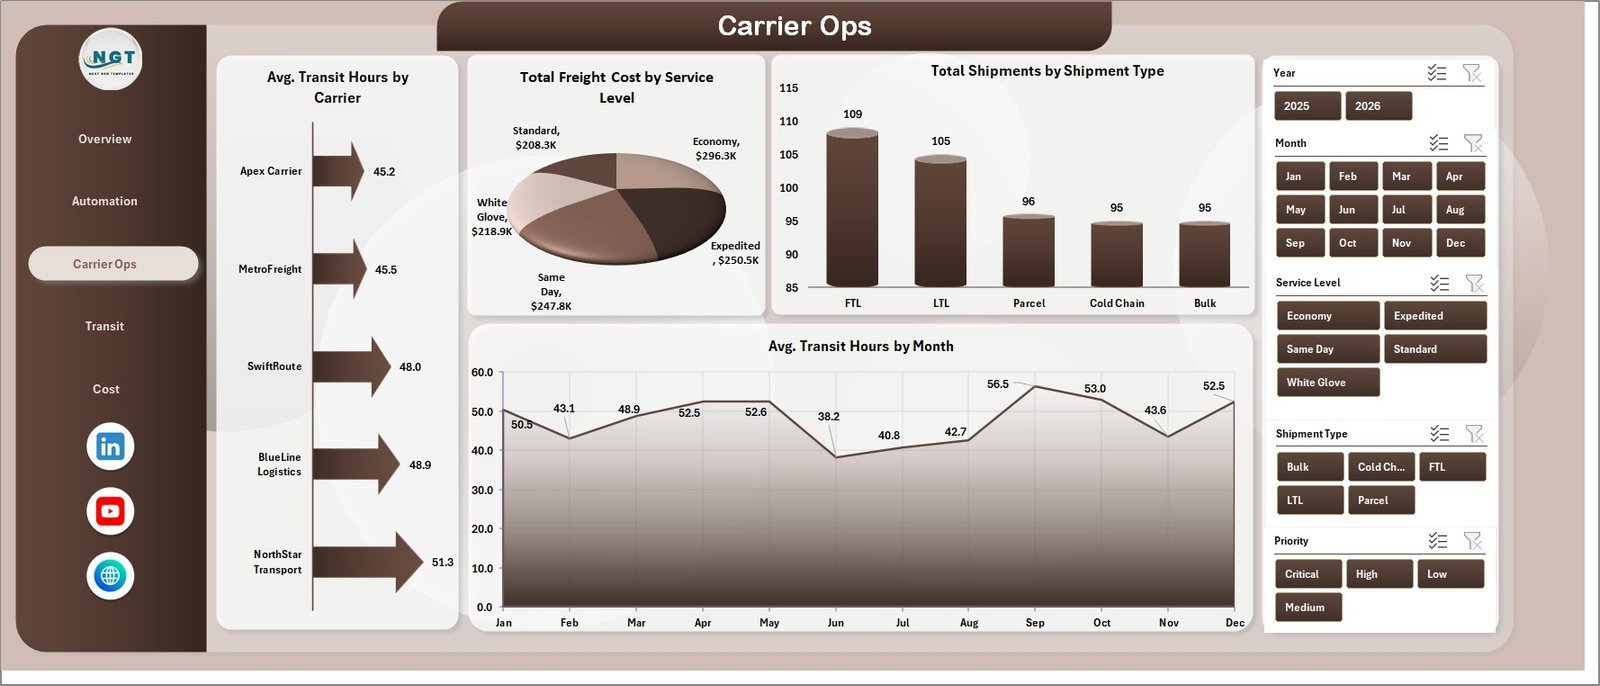
The Carrier Ops page supports carrier and service performance review. Avg. Transit Hours by Carrier helps identify which carriers are faster or slower across the data. Total Freight Cost by Service Level shows how cost changes for premium, standard, urgent, or other service tiers. Total Shipments by Shipment Type reveals how volume is distributed across shipment categories. Avg. Transit Hours by Month makes transit speed trends easier to review during weekly or monthly operations meetings.

Carrier Ops
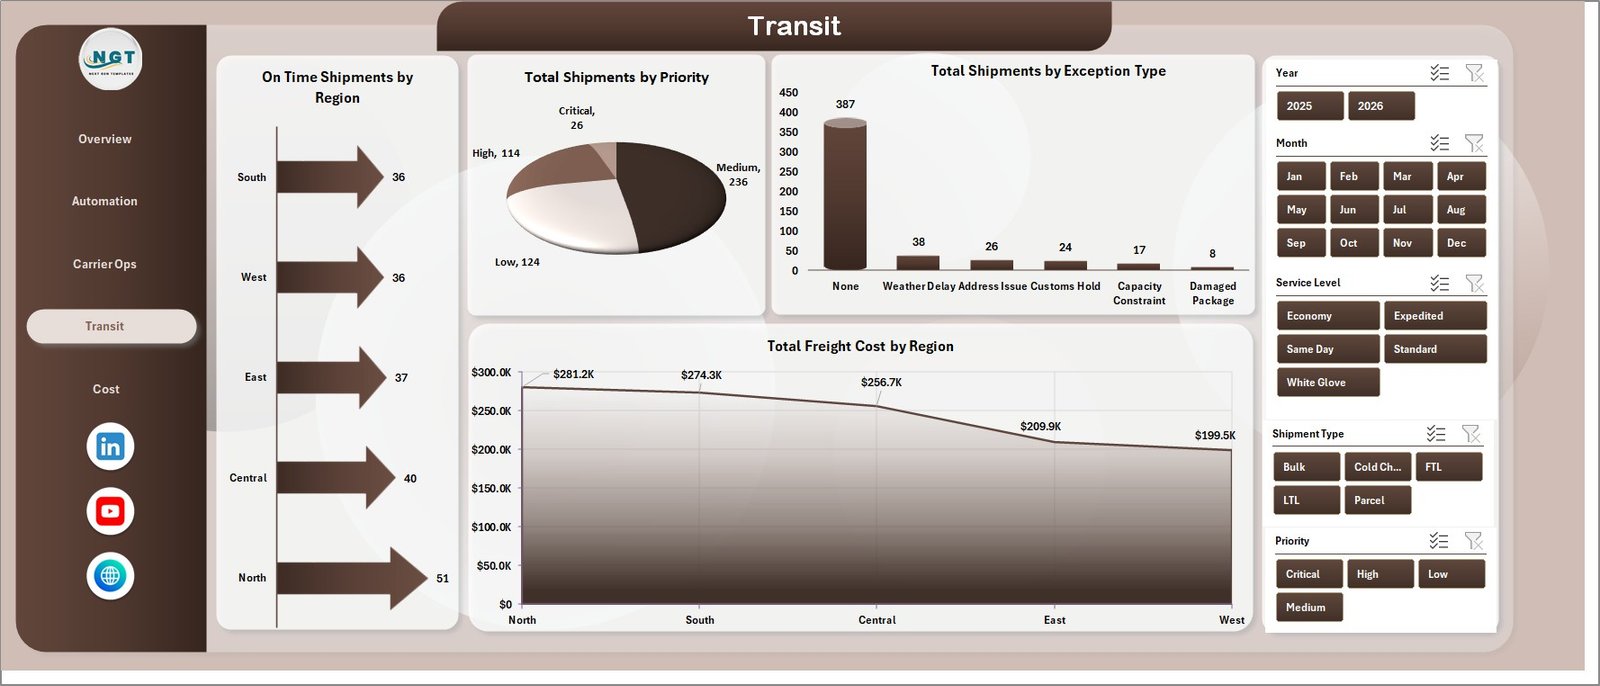
The Transit page highlights delivery reliability and exceptions. On Time Shipments by Region shows where service reliability is strongest or weakest. Total Shipments by Priority helps teams understand workload mix across urgent, high, medium, or standard shipments. Total Shipments by Exception Type shows the most common issue categories. Total Freight Cost by Region helps managers connect transit outcomes with regional cost pressure.
Transit
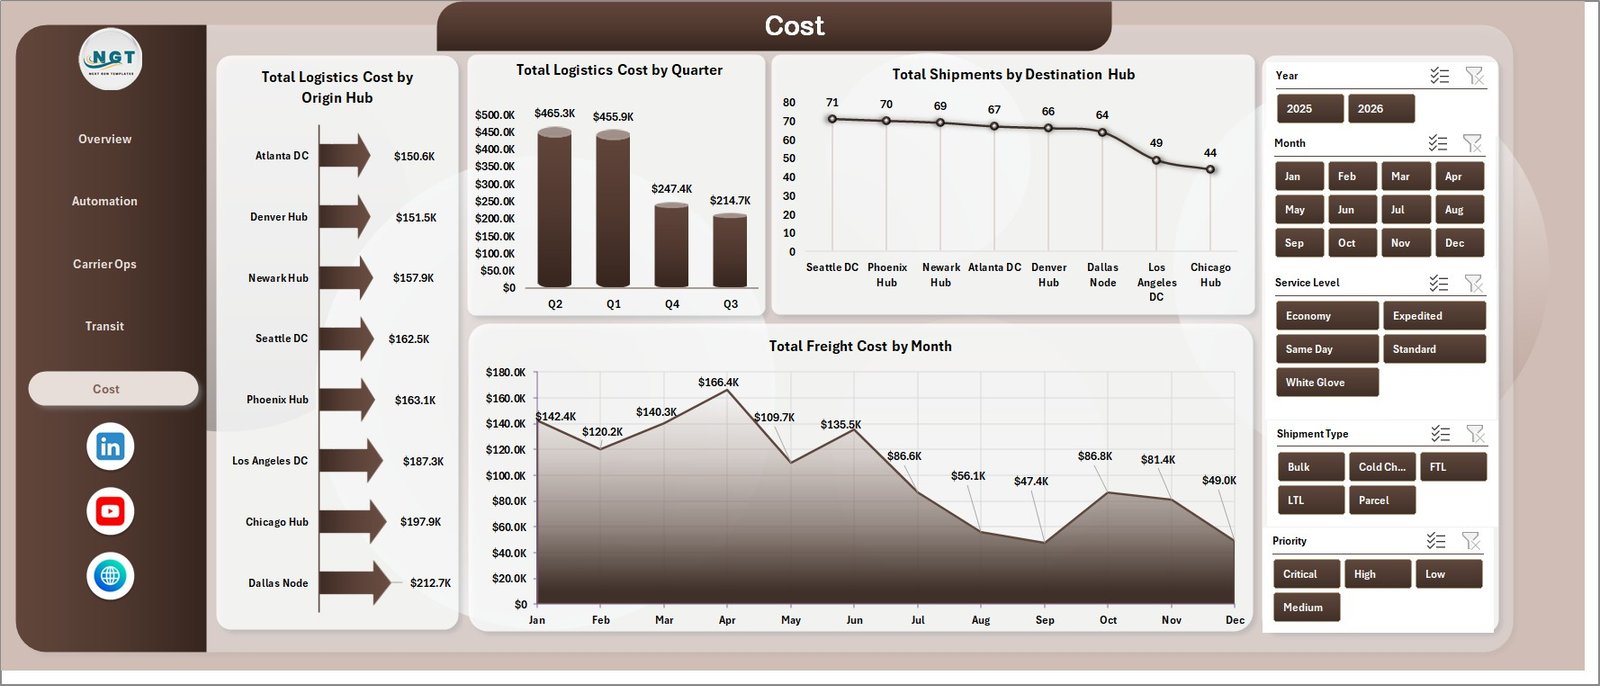
The Cost page is built for deeper cost and hub analysis. Total Logistics Cost by Origin Hub identifies the hubs creating the highest logistics spend. Total Logistics Cost by Quarter supports quarterly cost reviews and budget tracking. Total Shipments by Destination Hub shows where shipments are landing most often. Total Freight Cost by Month gives a clean monthly freight trend for finance and operations teams.
Cost
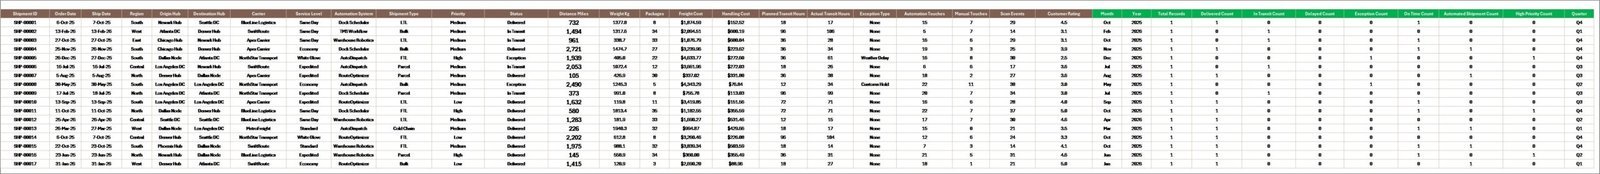
The Data Sheet tab is where you add your logistics records in the same structured format as the sample data. Keep the column names and data layout consistent so the pivot tables, slicers, and charts continue to work correctly.
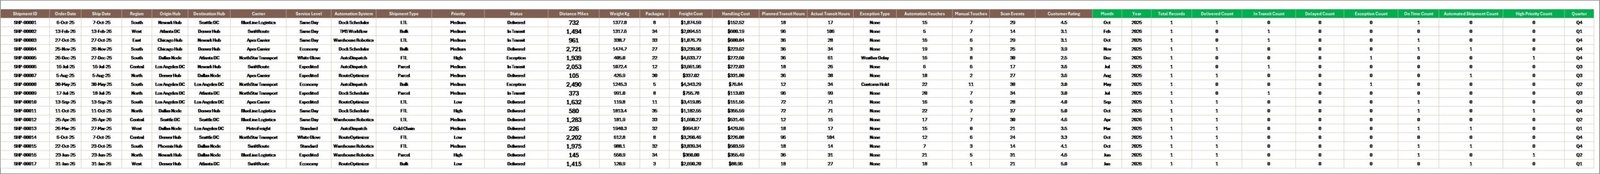
Data Sheet tab
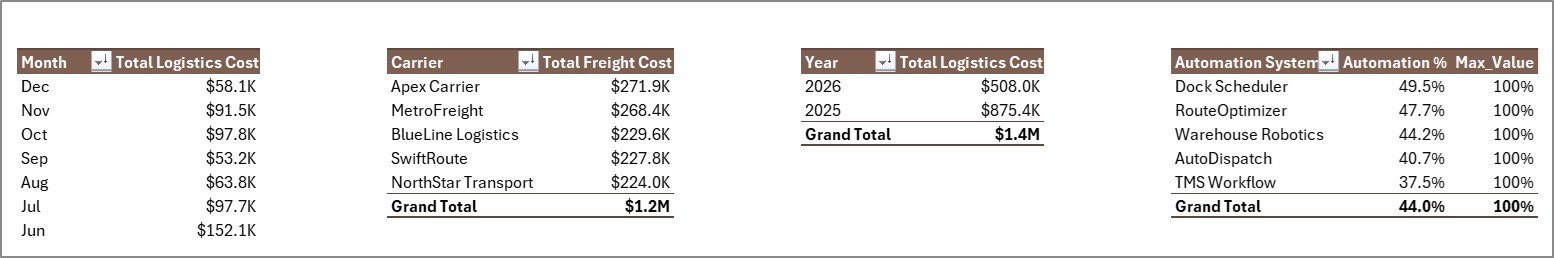
The Support Sheet contains multiple pivot tables used to create the entire dashboard dynamically. After updating the Data Sheet, go to the Data tab in the Excel Ribbon and click Refresh All. All pivots and charts will refresh, and you can keep this sheet hidden for everyday users.
Support Sheet tab
Logistics Automation Dashboard in Excel vs. Google Sheets vs. Paid CRM/SaaS – Where This Fits
| Feature | This Excel dashboard | Google Sheets alternative | Paid logistics SaaS |
|---|---|---|---|
| Cost | $17.99 one-time | Template or custom build | Monthly or annual subscription |
| Platform | Microsoft Excel | Google Sheets | Vendor-hosted system |
| Setup time | Replace sample data and refresh pivots | Import data and adapt formulas | Implementation and onboarding |
| Real-time team collaboration | Available through OneDrive or SharePoint | Native collaboration | Usually included |
| Mobile access | Excel mobile with limitations | Google Sheets mobile | Usually included |
| Customizable fields | Fully editable workbook | Editable sheet | Depends on plan |
| Share with link | Possible through Microsoft 365 | Yes | Login controlled |
| Year-1 cost at 5 users | $17.99 plus Microsoft licensing | Template cost plus maintenance | Often hundreds or thousands |
| Automation analytics | Built in across 5 pages | Must be built or adapted | Depends on vendor module |
Who This Template Is For – and Who It’s Not For
This template is for logistics managers, supply chain analysts, carrier operations teams, warehouse leaders, transportation coordinators, 3PL reporting teams, and consultants who need Excel-based reporting for freight cost, logistics cost, shipments, automation, transit time, exceptions, hubs, regions, priorities, and service levels.
It is not for teams that need live GPS tracking, dispatch execution, warehouse scanning, route optimization, carrier API automation, or transport management system workflow control. Use it as a management reporting workbook after your logistics data is exported or entered into Excel.
How to Use the Logistics Automation Dashboard in Excel
- Download and unzip the Excel dashboard file.
- Open the workbook in Microsoft Excel.
- Replace the sample records in the Data Sheet with your own logistics records.
- Keep the same column structure so pivots and charts read the data correctly.
- Go to the Data tab and click Refresh All.
- Use slicers to filter by month, year, region, carrier, service level, priority, shipment type, automation system, hub, or exception type.
Real-World Use Cases
Ravi, logistics operations manager: Ravi checks total logistics cost, delivered shipments, carrier cost, and on-time shipments before weekly carrier review meetings.
Meera, supply chain analyst: Meera uses the Automation and Cost pages to compare automation adoption, handling cost, origin hub spend, and quarterly logistics cost.
Daniel, 3PL consultant: Daniel prepares client-facing reports that explain carrier transit hours, service-level freight cost, exception types, and destination hub volume.
Frequently Asked Questions
What software do I need?
You need Microsoft Excel. The workbook uses Excel charts, slicers, source data, and pivot tables.
How many dashboard pages are included?
The workbook includes 5 dashboard pages: Overview, Automation, Carrier Ops, Transit, and Cost, plus Data Sheet and Support Sheet tabs.
Can I add my own logistics data?
Yes. Add or paste your records into the Data Sheet in the same format, then refresh all pivots from the Excel Data tab.
Can I customize KPIs and charts?
Yes. You can edit chart titles, slicers, pivot tables, formulas, colors, labels, and workbook layout directly in Excel.
Does this replace logistics software?
No. It is a reporting dashboard, not a dispatch, routing, tracking, or TMS execution platform.
Can I hide the Support Sheet?
Yes. The Support Sheet contains pivot tables used to create the dashboard dynamically and can be hidden after setup.
About the Author
Built by PK – Microsoft Certified Professional with 15+ years of Excel, Google Sheets, and Power BI experience. Founder of NextGenTemplates, reaching 300K+ subscribers across YouTube channels. Every template is hand-built and tested before release.
Explore Related Templates
Explore more Excel dashboard templates and logistics Excel templates. Related options include Last-mile Delivery Dashboard in Excel, Freight Insurance Providers Dashboard in Excel, Freight Cost KPI Dashboard in Excel, and Last-Mile Delivery KPI Dashboard in Excel.
Ready to analyze logistics automation in Excel? Download the Logistics Automation Dashboard in Excel, update the Data Sheet, refresh the pivots, and start reviewing logistics performance today.
Last updated: July 4, 2026


Reviews
There are no reviews yet.