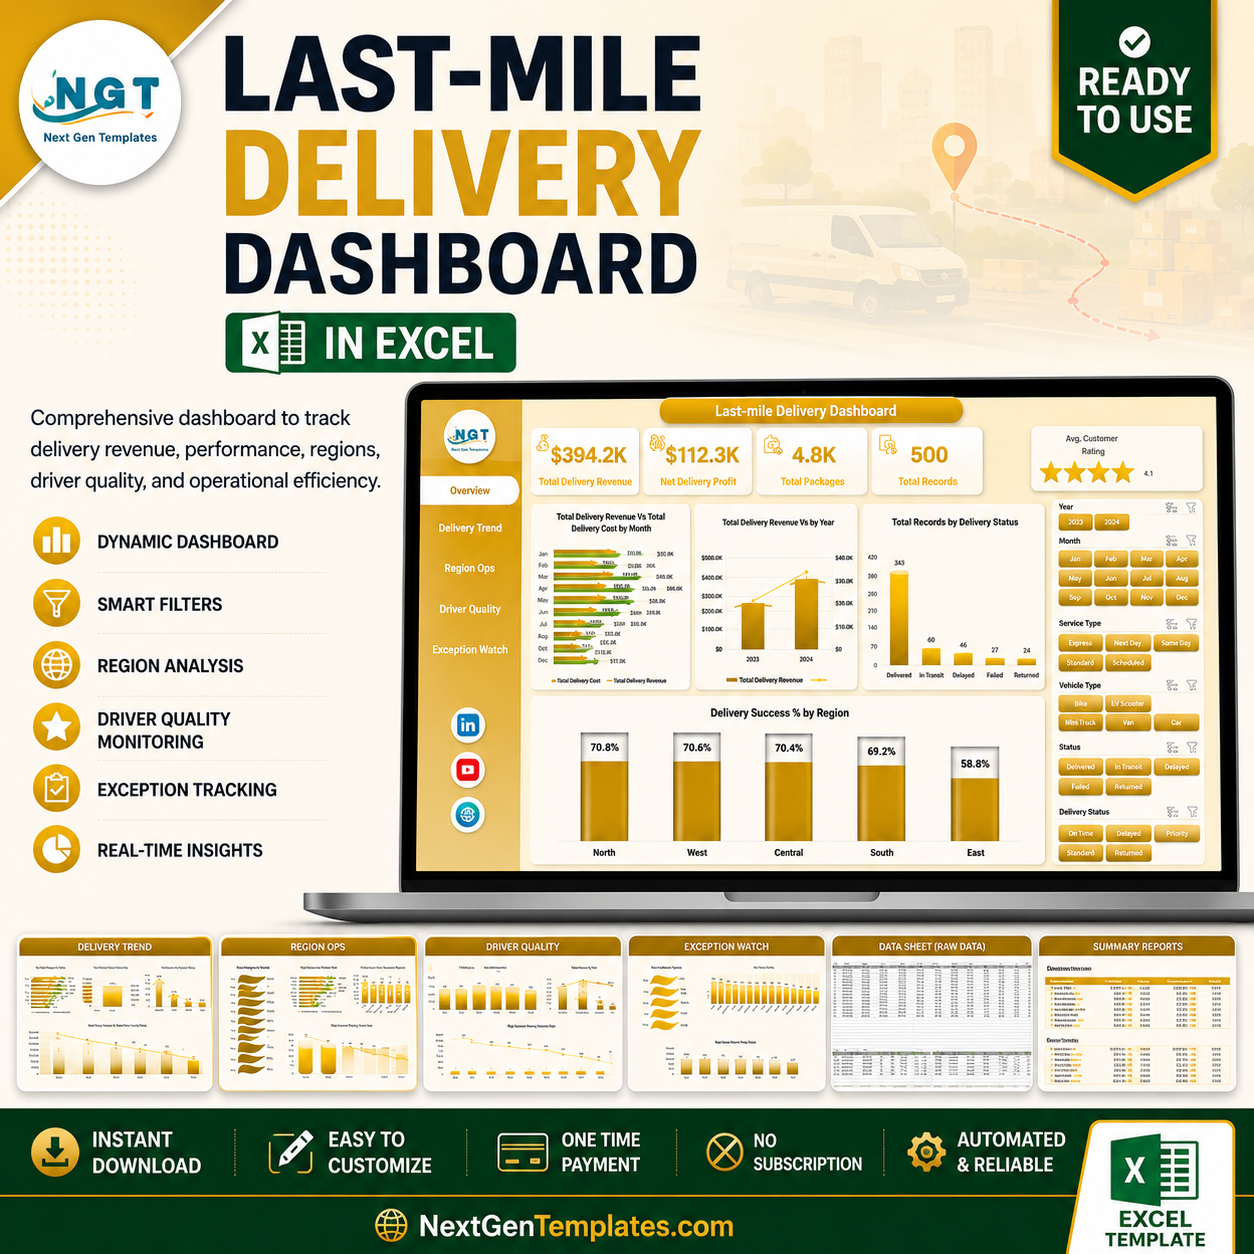


Last-mile Delivery Dashboard in Excel helps delivery, ecommerce, courier, and logistics teams track revenue, delivery cost, package volume, delivery status, on-time performance, driver quality, customer rating, penalties, and incidents in one editable Excel workbook. Instead of building reports manually across dispatch files and carrier exports, this dashboard gives you 5 interactive analysis pages, 5 executive KPI cards, slicers, a Data Sheet, and a pivot-powered Support Sheet. Join 8,400+ teams using NextGenTemplates to replace recurring reporting software with one-time editable templates. Instant download, lifetime file access, and a practical risk reversal: replace the sample data, refresh the workbook, and adapt the reporting flow to your operation.
Key Features of Last-mile Delivery Dashboard in Excel
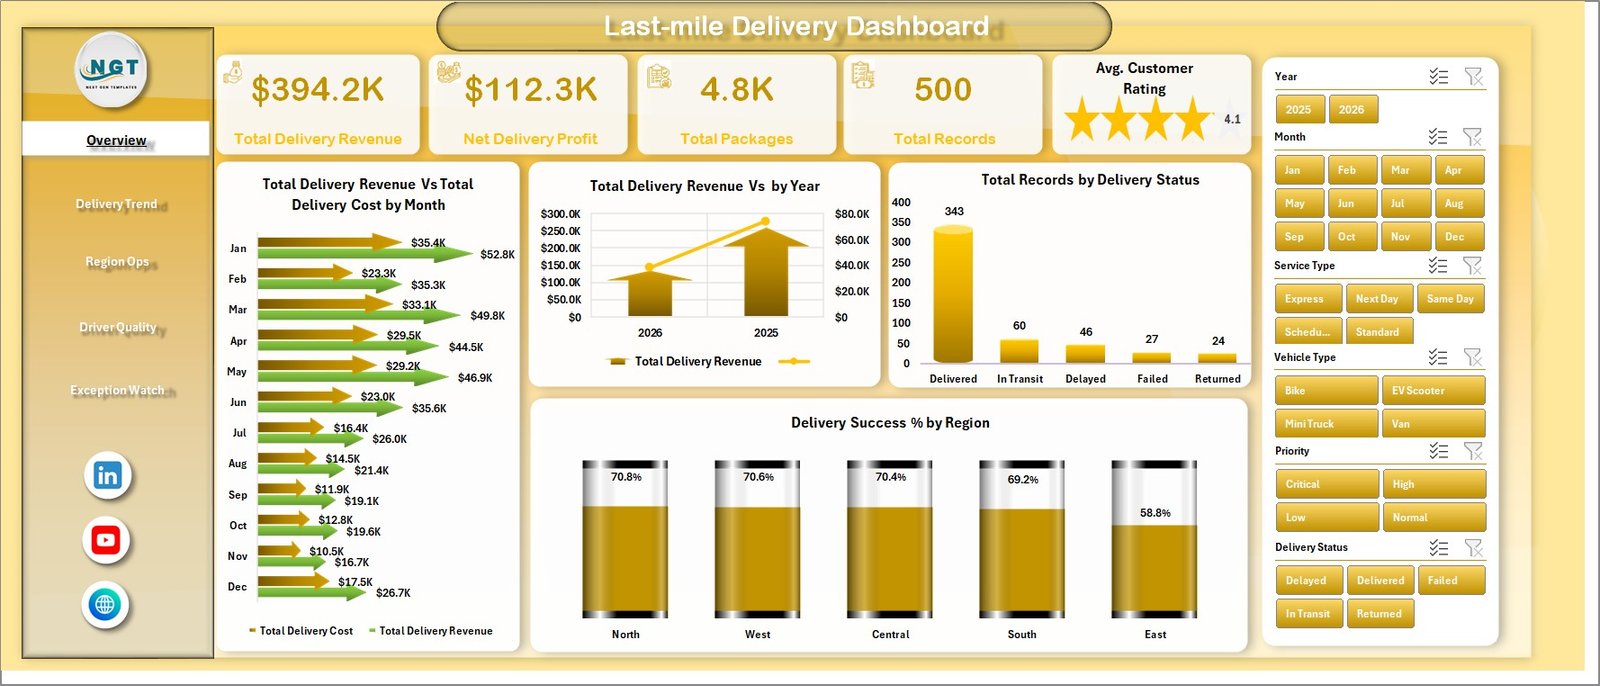
- Executive KPI cards: Total Delivery Revenue, Net Delivery Profit, Total Packages, Total Records, and Avg. Customer Rating.
- 5 dashboard pages: Overview Page, Delivery Trend, Region Ops, Driver Quality, and Exception Watch.
- Interactive slicers: Filter quickly by delivery period, region, city, service type, vehicle type, priority, driver, delivery status, or customer segment depending on your source fields.
- Revenue and cost visibility: Compare Total Delivery Revenue against Total Delivery Cost by month and by region.
- Operations analysis: Review packages, delivery hours, distance, status, success percentage, on-time rate, and penalty amount.
- Driver and quality tracking: Analyze on-time percentage, customer rating, and delivery success by driver, priority, and service type.
- Exception monitoring: Track incidents by region, on-time percentage by city, and average delivery hours by vehicle type.
- Pivot-driven Excel design: Update the Data Sheet, click Refresh All, and the charts refresh dynamically.
What’s Inside the Last-mile Delivery Dashboard in Excel
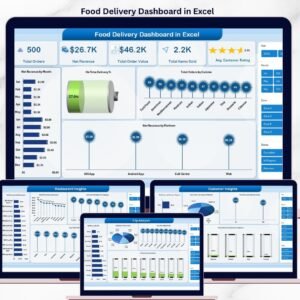
The Overview Page gives leadership a fast view of delivery health with five high-level cards: Total Delivery Revenue, Net Delivery Profit, Total Packages, Total Records, and Avg. Customer Rating. It also includes charts for Total Delivery Revenue vs Total Delivery Cost by Month, Total Delivery Revenue by Year, Total Records by Delivery Status, and Delivery Success % by Region. The revenue vs cost chart shows whether delivery margin is improving month by month. The delivery status and regional success visuals make it easy to spot fulfillment issues before they become customer complaints.
Last-mile Delivery Dashboard in Excel
The Delivery Trend page tracks Total Packages by Month, Avg. Delivery Hours by Service Type, Total Penalty Amount by Priority, and Total Delivery Revenue vs Total Delivery Cost by Region. Use it to understand seasonal package movement, service-level speed, priority-based penalties, and regional margin pressure.
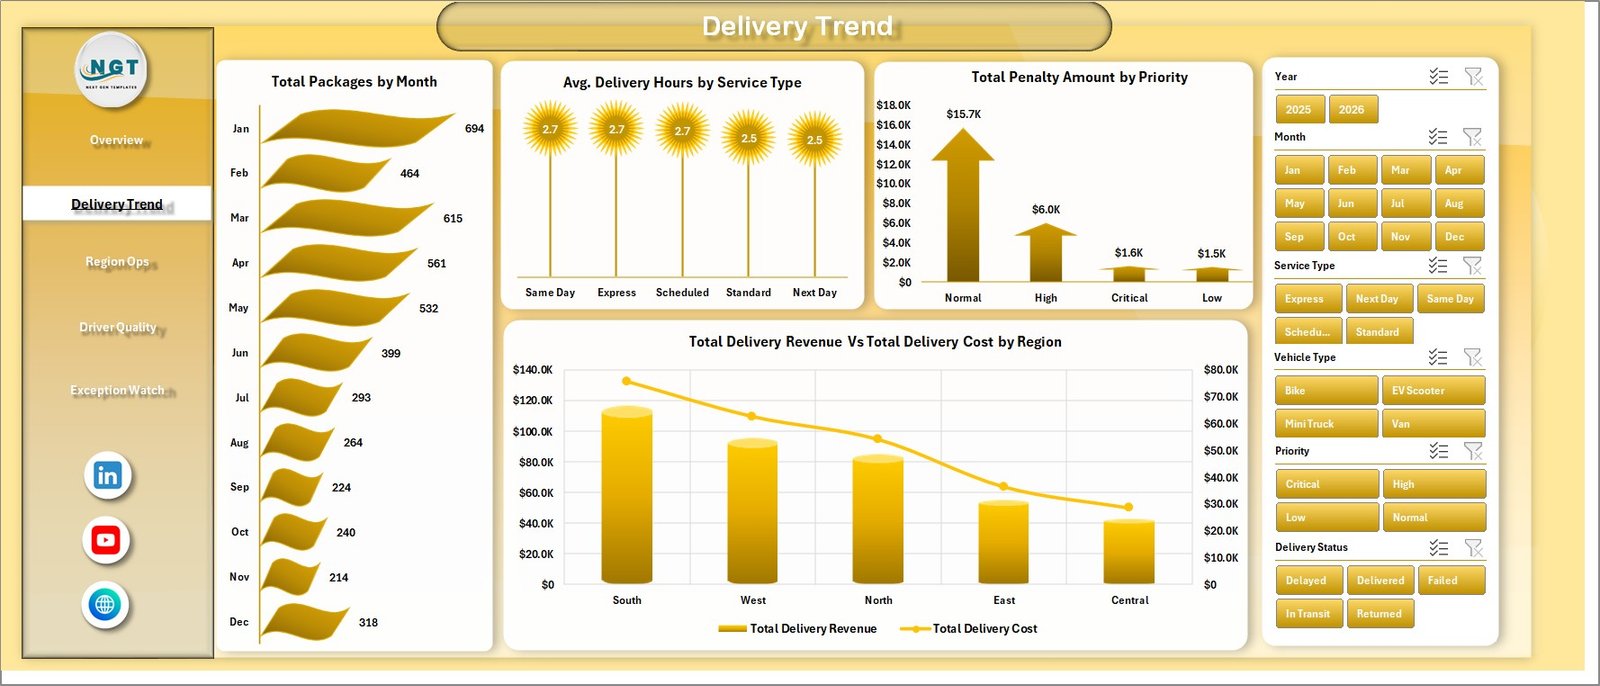
Delivery Trend
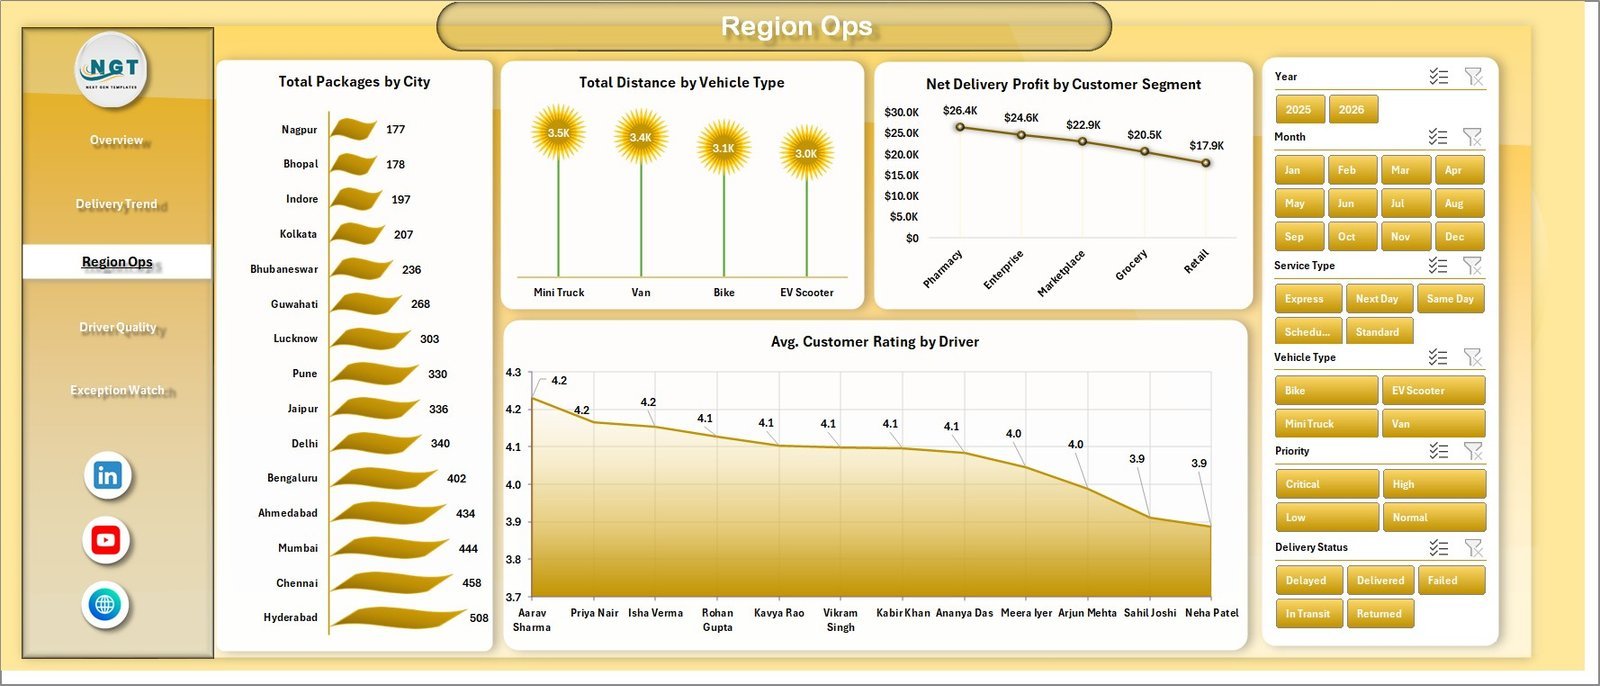
The Region Ops page shows Total Packages by City, Total Distance by Vehicle Type, Net Delivery Profit by Customer Segment, and Avg. Customer Rating by Driver. This page helps operations managers compare city workload, route distance, customer segment profitability, and driver-level service quality.

Region Ops
The Driver Quality page focuses on On Time % by Driver, Delivery Success % by Priority, Total Records by Year, and Avg. Customer Rating by Service Type. These views support driver coaching, service-type review, priority handling checks, and year-over-year reporting.
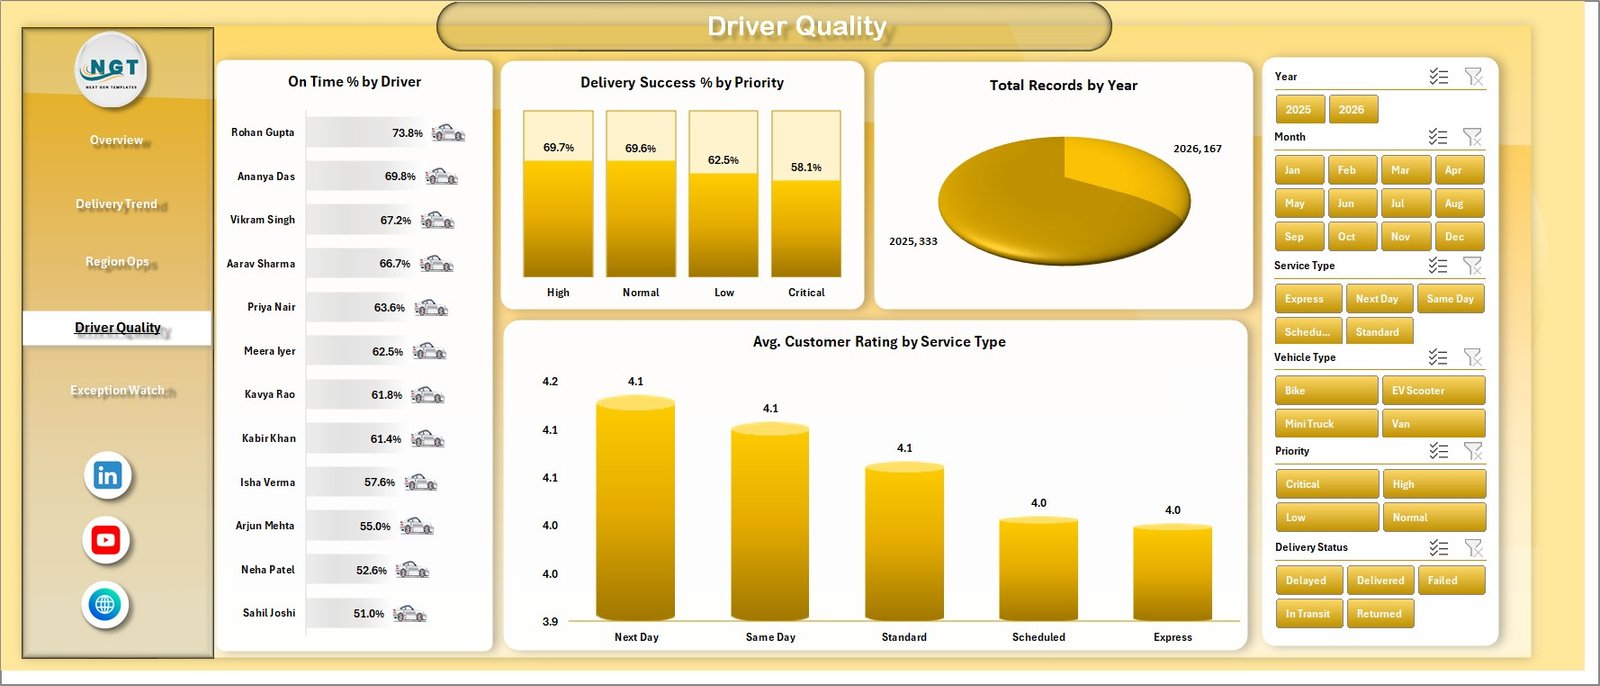
Driver Quality
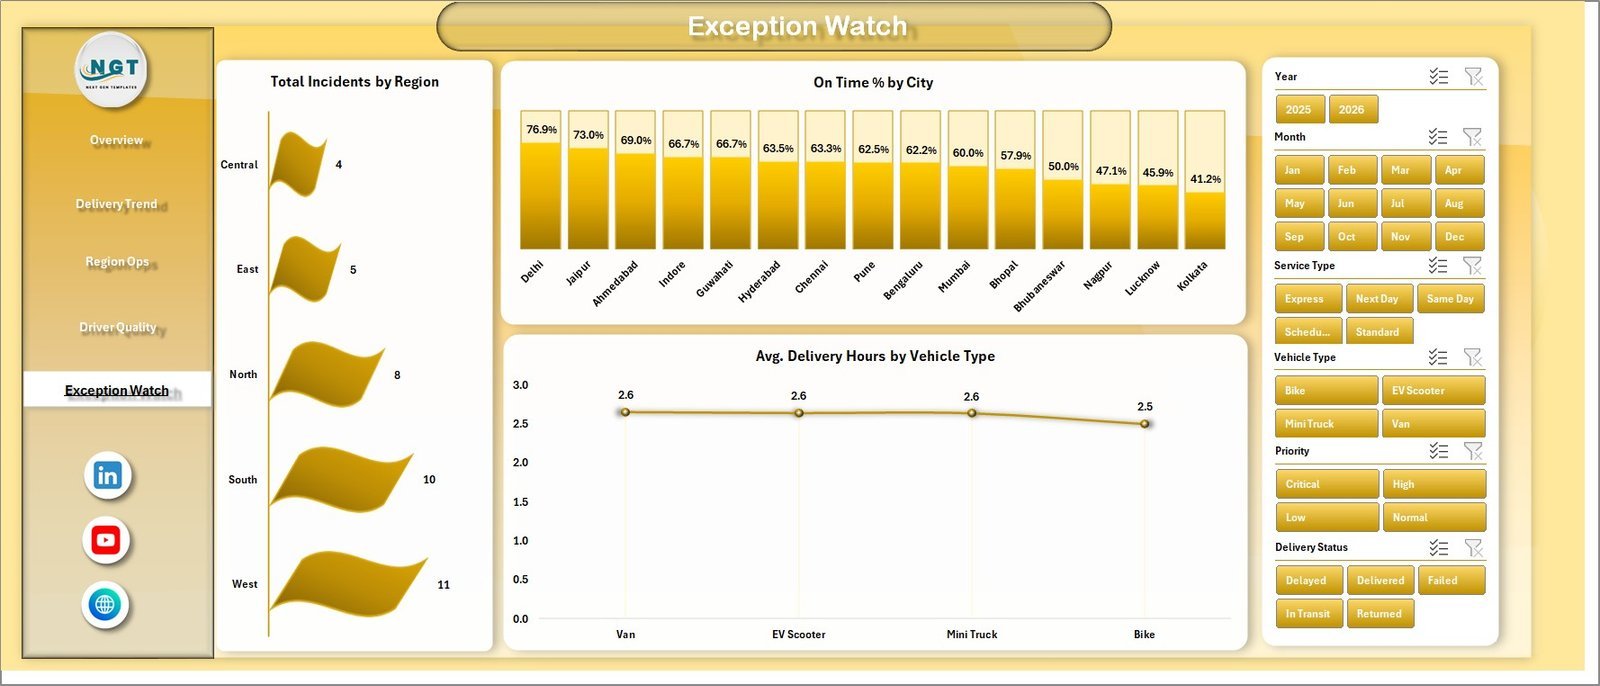
The Exception Watch page monitors Total Incidents by Region, On Time % by City, and Avg. Delivery Hours by Vehicle Type. It is built for daily and weekly exception review so teams can identify incident-heavy regions, slow cities, and vehicle types that create delays.

Exception Watch
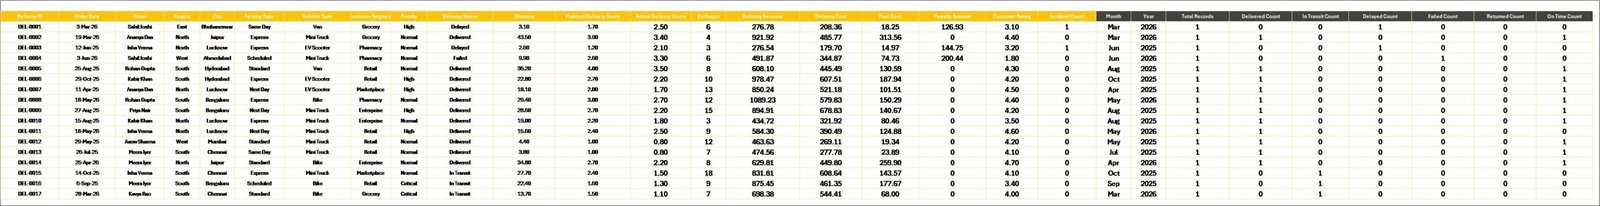
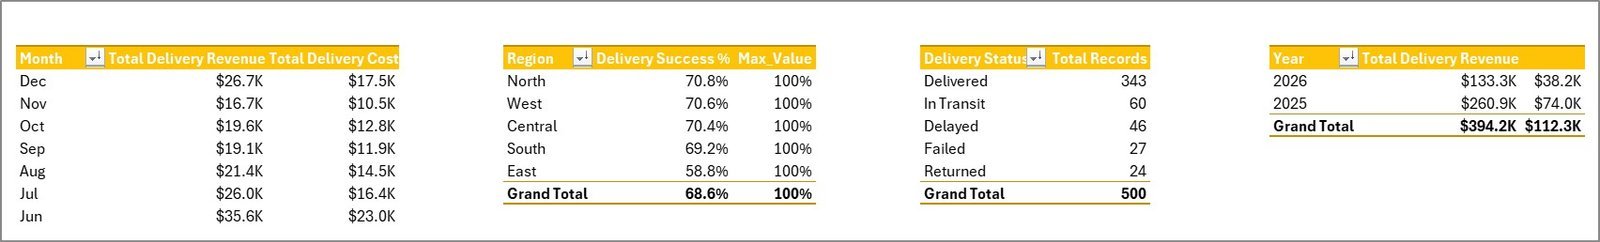
The Data Sheet tab is where you add your delivery records in the same structured format. The Support Sheet contains the pivot tables used to build the dashboard dynamically. After updating the Data Sheet, go to the Data tab in the Excel Ribbon and click Refresh All. You can keep the Support Sheet hidden for everyday users.
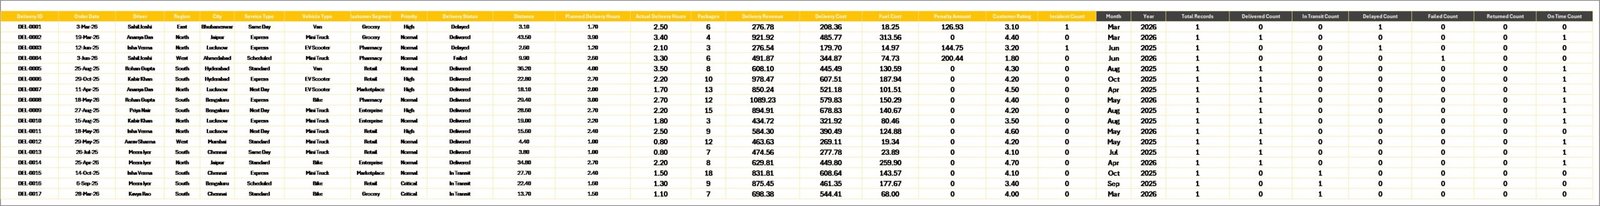
Data Sheet tab
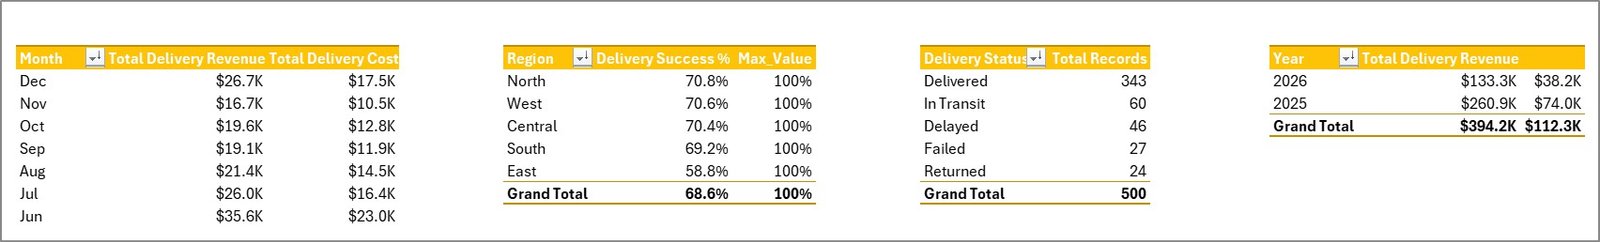
Support Sheet tab
Last-mile Delivery Dashboard in Excel vs. Google Sheets vs. Paid CRM/SaaS – Where This Fits
| Feature | This Excel dashboard | Google Sheets alternative | Paid delivery SaaS |
|---|---|---|---|
| Cost | $17.99 one-time | Template or custom build | Monthly subscription |
| Platform | Microsoft Excel | Google Sheets | Vendor-hosted system |
| Setup time | Replace sample data and refresh pivots | Import data and adapt formulas | Onboarding and configuration |
| Real-time team collaboration | Available through OneDrive/SharePoint | Native collaboration | Usually included |
| Mobile access | Excel mobile with limitations | Google Sheets mobile | Usually included |
| Customizable fields | Fully editable workbook | Editable sheet | Depends on plan |
| Share with link | Possible through Microsoft 365 | Yes | Login controlled |
| Year-1 cost at 5 users | $17.99 plus Microsoft licensing | Template cost plus maintenance | Often hundreds or thousands |
| Last-mile analytics | Built in across 5 pages | Must be built or adapted | Depends on vendor module |
Who This Template Is For – and Who It’s Not For
This template is for ecommerce operations managers, courier teams, 3PL analysts, fleet coordinators, delivery supervisors, regional logistics leads, and consultants who need Excel-based reporting for revenue, cost, packages, delivery status, success rate, on-time performance, driver rating, incidents, penalties, and distance.
It is not for teams that need live GPS tracking, driver mobile apps, barcode scanning, dispatch automation, proof-of-delivery capture, or API-based routing optimization. Use it as a management reporting workbook after your delivery data is exported or entered into Excel.
How to Use the Last-mile Delivery Dashboard in Excel
- Download and unzip the Excel dashboard file.
- Open the workbook in Microsoft Excel.
- Replace the sample records in the Data Sheet with your own delivery records.
- Keep the same column structure so pivots and charts read the data correctly.
- Go to the Data tab and click Refresh All.
- Use slicers to filter delivery performance by month, region, city, service type, vehicle, priority, status, driver, and segment.
Real-World Use Cases
Ravi, ecommerce operations manager: Ravi checks delivery revenue, cost, success %, and customer rating every Monday before his courier performance meeting.
Meera, regional logistics analyst: Meera uses the Region Ops and Exception Watch pages to compare city workload, vehicle distance, incidents, and on-time performance.
Daniel, 3PL consultant: Daniel prepares client-facing delivery reports that show service-type speed, driver rating, priority handling, and penalty trends.
Frequently Asked Questions
What software do I need?
You need Microsoft Excel. The workbook uses Excel charts, slicers, source data, and pivot tables.
How many dashboard pages are included?
The workbook includes 5 dashboard pages: Overview Page, Delivery Trend, Region Ops, Driver Quality, and Exception Watch, plus Data Sheet and Support Sheet tabs.
Can I add my own delivery data?
Yes. Add or paste your records into the Data Sheet in the same format, then refresh all pivots from the Excel Data tab.
Can I customize KPIs and charts?
Yes. You can edit chart titles, slicers, pivot tables, formulas, colors, labels, and workbook layout directly in Excel.
Does this replace delivery management software?
No. It is a reporting dashboard, not a dispatch, route-planning, driver-app, or live tracking system.
Can I hide the Support Sheet?
Yes. The Support Sheet contains pivot tables used to create the dashboard dynamically and can be hidden after setup.
About the Author
Built by PK – Microsoft Certified Professional with 15+ years of Excel, Google Sheets, and Power BI experience. Founder of NextGenTemplates, reaching 300K+ subscribers across YouTube channels. Every template is hand-built and tested before release.
Explore Related Templates
Explore more Excel dashboard templates and logistics Excel templates. Related options include Freight Insurance Providers Dashboard in Excel, Freight Cost KPI Dashboard in Excel, Last-Mile Delivery KPI Dashboard in Excel, and Procurement and Vendor Management Kit.
Ready to analyze delivery performance in Excel? Download the Last-mile Delivery Dashboard in Excel, update the Data Sheet, refresh the pivots, and start reviewing delivery performance today.
Last updated: June 30, 2026


Reviews
There are no reviews yet.