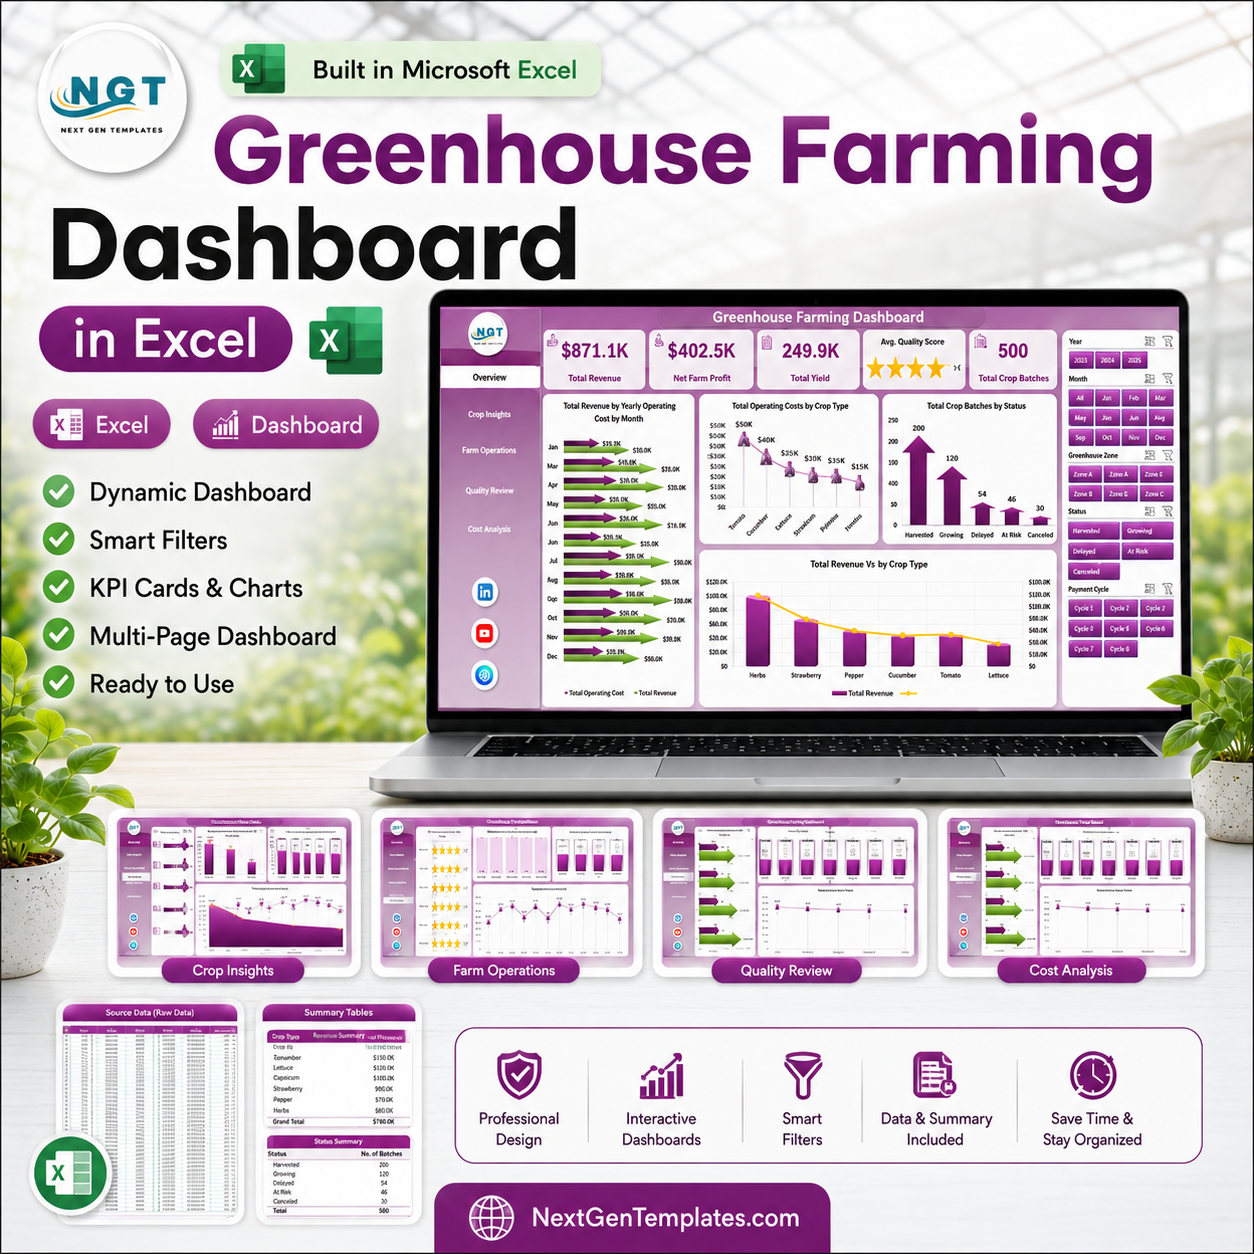


Greenhouse Farming Dashboard in Excel helps greenhouse owners, farm managers, agribusiness analysts, and operations teams review revenue, operating cost, crop yield, quality score, crop batches, waste, climate risk, inspection results, and profit from one editable Excel file. Many greenhouse teams manage 100+ crop batches across zones, sites, crop types, varieties, irrigation systems, and harvest cycles, but still rely on scattered sheets for reporting. This template gives you 5 dashboard pages, a structured data sheet, pivot-backed support sheet, KPI cards, slicers, and ready-made charts. Instant download. One-time payment. Editable Excel workbook. No monthly farm software subscription.
Greenhouse Farming Dashboard in Excel
Key Features of Greenhouse Farming Dashboard in Excel
- 5 dashboard pages covering Overview, Crop Insights, Farm Operations, Quality Review, and Cost Analysis.
- 5 executive KPI cards for Total Revenue, Net Farm Profit, Total Yield, Avg. Quality Score, and Total Crop Batches.
- Crop performance insights by crop type, variety, growing method, harvest cycle, and farm site.
- Operations analysis for greenhouse zone, irrigation system, climate strategy, and inspection result.
- Quality and waste tracking with quality score, waste rate, harvest completion, and profit trends.
- Cost analysis views for quarterly revenue vs cost, profit margin by crop type, and total waste by site.
- Interactive slicers to filter dashboards quickly without rebuilding formulas or charts.
- Structured data sheet so users can replace sample records with their own greenhouse data.
- Support sheet with pivot tables that can be refreshed from Excel’s Data tab after data updates.
What’s Inside the Greenhouse Farming Dashboard in Excel
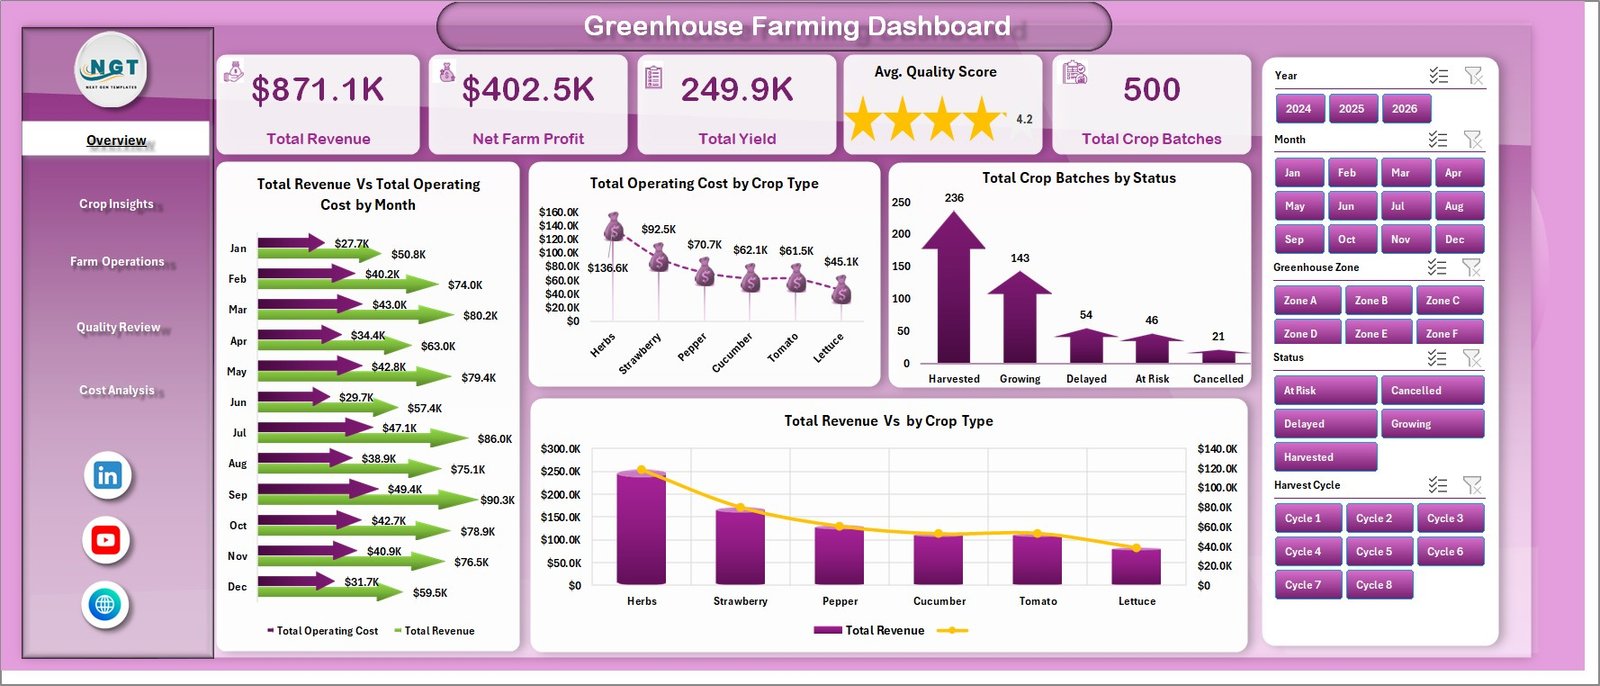
1. Overview Page
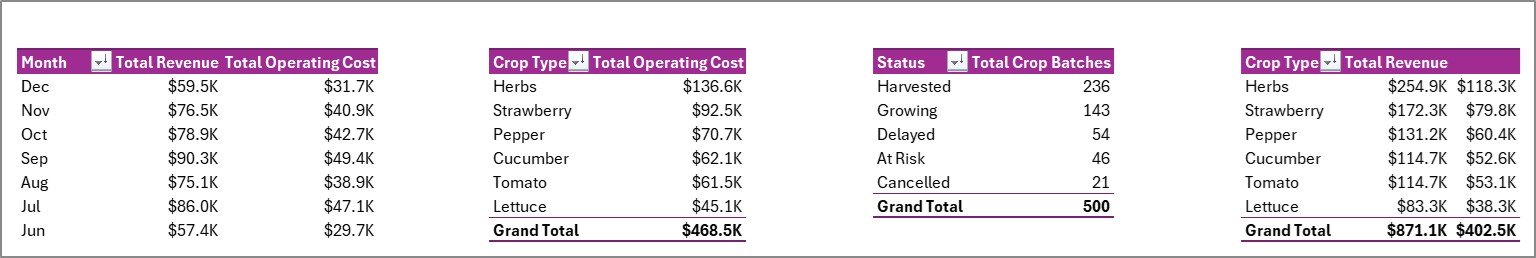
The Overview page gives leadership a high-level summary of greenhouse financial, production, quality, and batch performance. KPI cards show Total Revenue, Net Farm Profit, Total Yield, Avg. Quality Score, and Total Crop Batches so users can understand the operation before drilling into detailed tabs.
Total Revenue Vs Total Operating Cost by Month: This chart compares monthly income against operating cost. It helps identify periods where revenue growth is strong but production expenses may be reducing margin.
Total Operating Cost by Crop Type: This view highlights which crop types consume the largest share of cost. It supports crop planning, procurement review, and better cost control.
Total Crop Batches by Status: This chart shows how many batches are active, completed, delayed, or at risk. It helps operations teams see workload and risk status quickly.
Total Revenue Vs by Crop Type: This chart compares revenue contribution across crop types. It helps managers focus attention on crops that drive the largest commercial result.
2. Crop Insights
The Crop Insights page studies crop-level performance across variety, growing method, harvest cycle, and farm site. Users can compare Total Operating Cost by Variety, Avg. Quality Score by Growing Method, Harvest Completion % by Harvest Cycle, and Total Revenue Vs Total Operating Cost by Farm Site.
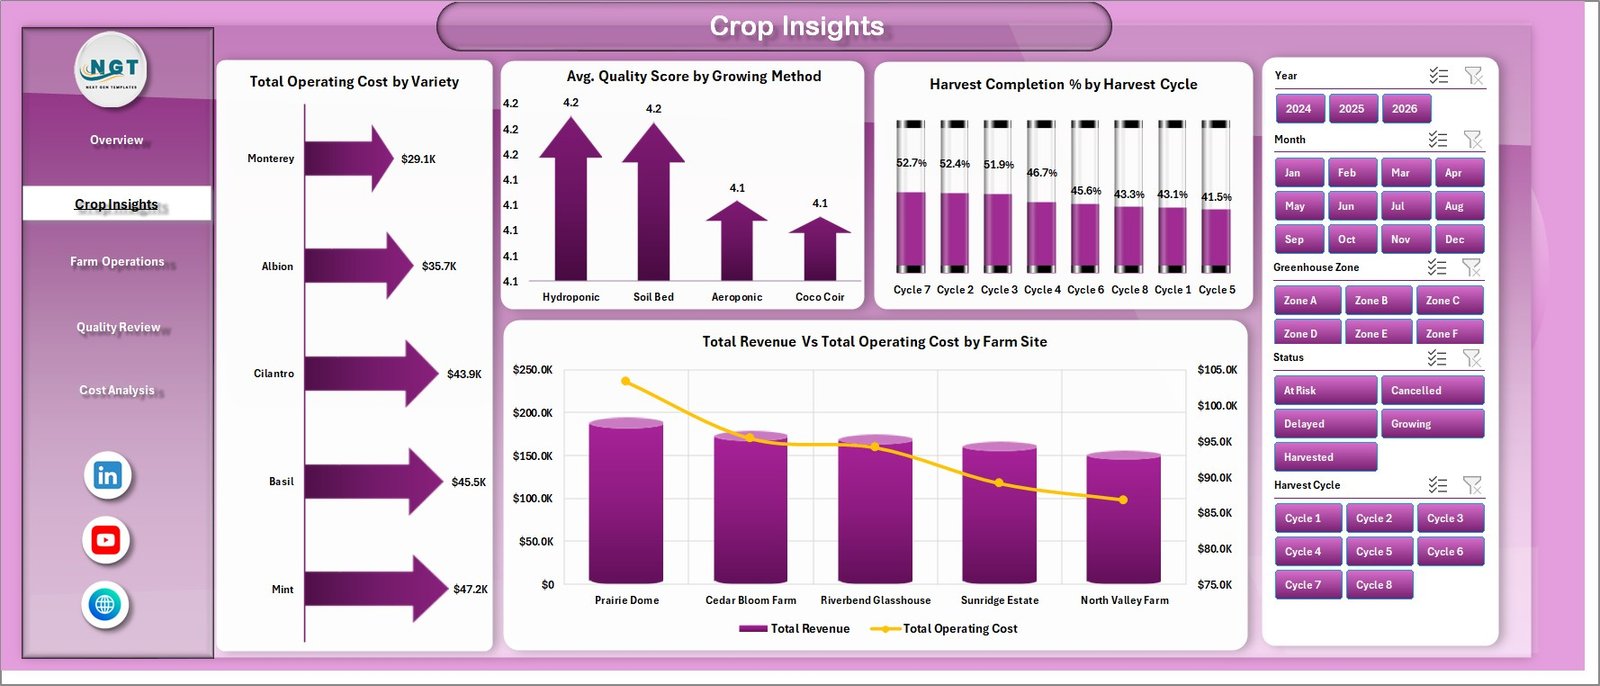
Crop Insights
3. Farm Operations
The Farm Operations page focuses on execution across greenhouse zones, irrigation systems, climate strategies, and inspections. It includes Net Farm Profit by Greenhouse Zone, Avg. Quality Score by Irrigation System, At Risk Batches by Climate Strategy, and Total Crop Batches by Inspection Result.
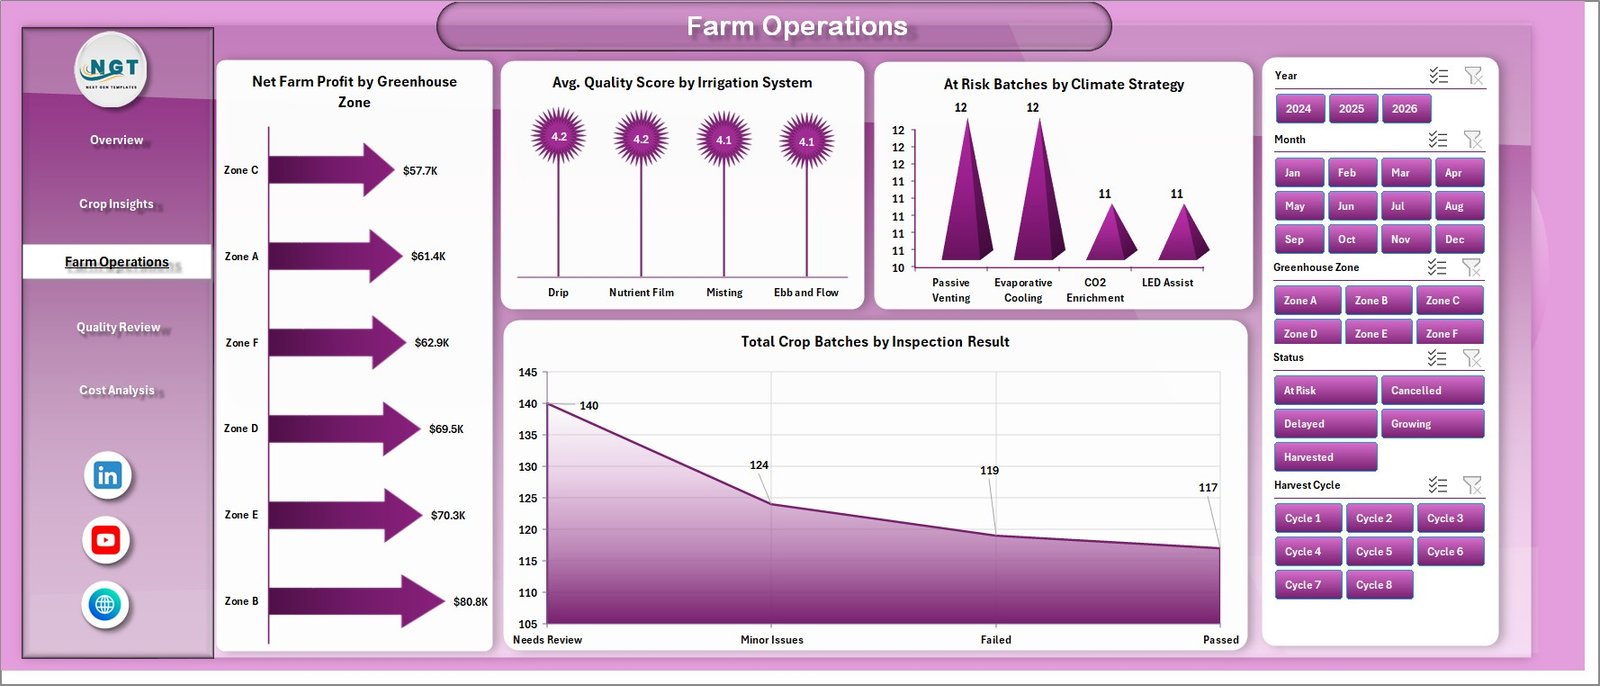
Farm Operations
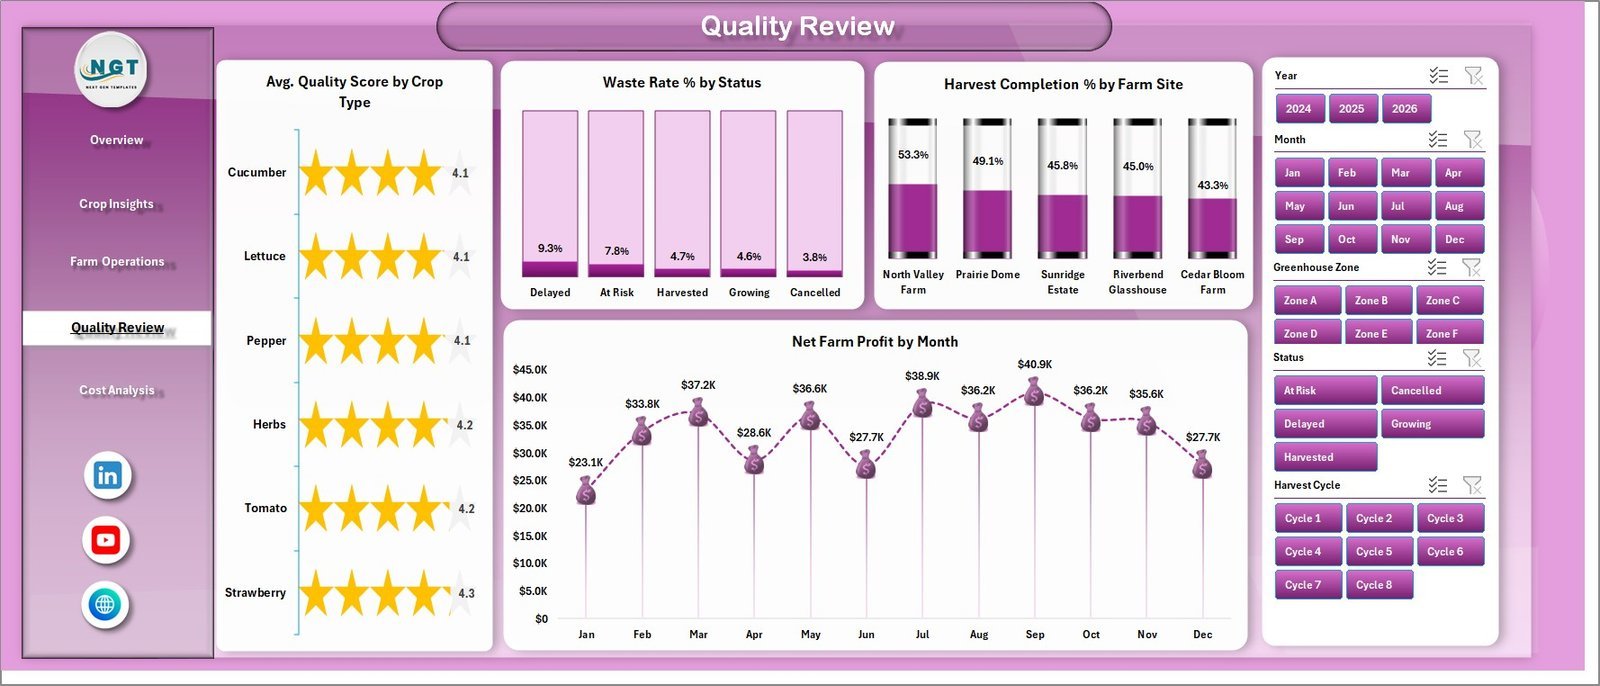
4. Quality Review
The Quality Review page helps users connect crop quality, waste, harvest completion, and profit movement. It includes Avg. Quality Score by Crop Type, Waste Rate % by Status, Harvest Completion % by Farm Site, and Net Farm Profit by Month.

Quality Review
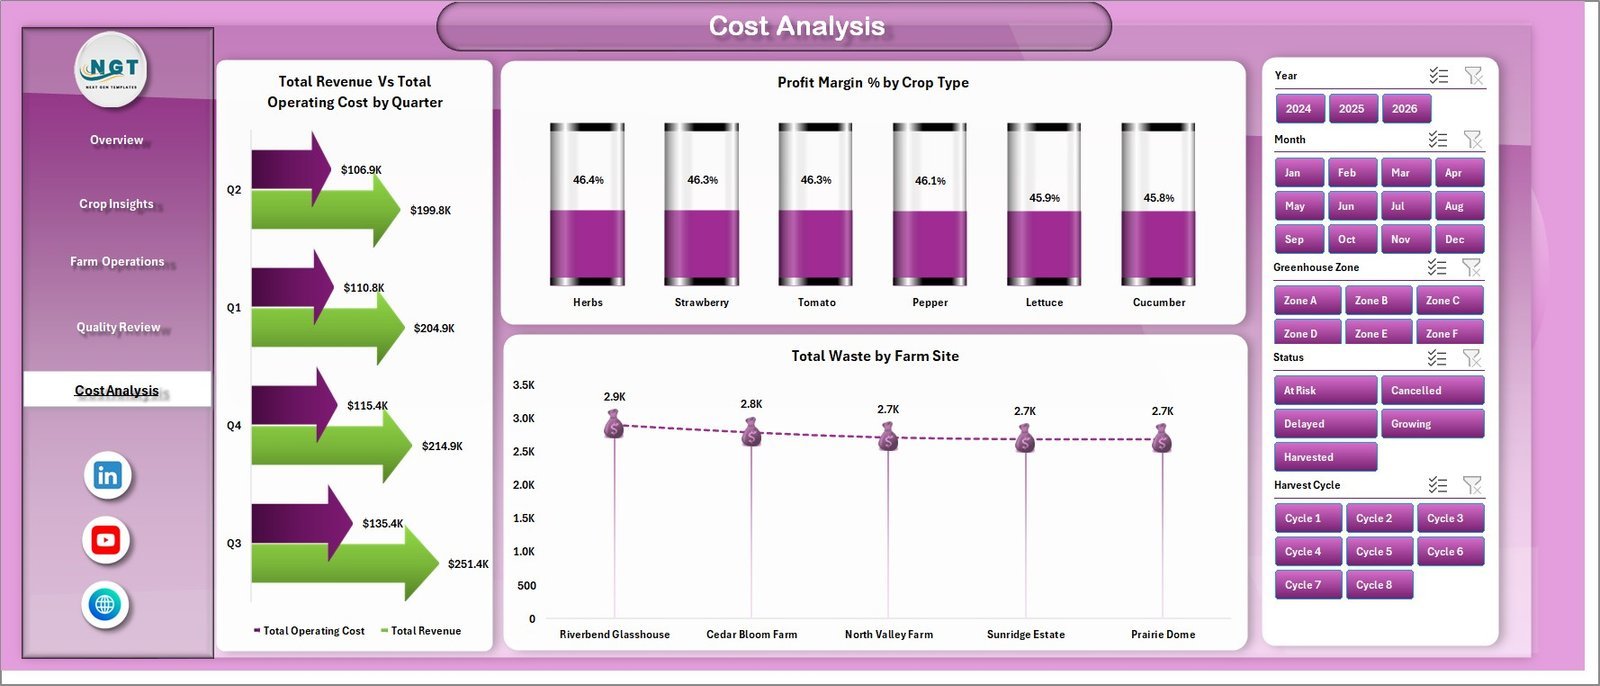
5. Cost Analysis
The Cost Analysis page gives a financial lens on greenhouse performance. Total Revenue Vs Total Operating Cost by Quarter shows seasonal cost behavior, Profit Margin % by Crop Type identifies crop-level profitability, and Total Waste by Farm Site shows where losses need attention.

Cost Analysis
6. Data Sheet Tab
The Data sheet is where users add or replace records in the same structured format. After updating the data, refresh the workbook so pivots, charts, slicers, cards, and dashboard pages reflect the new greenhouse records.
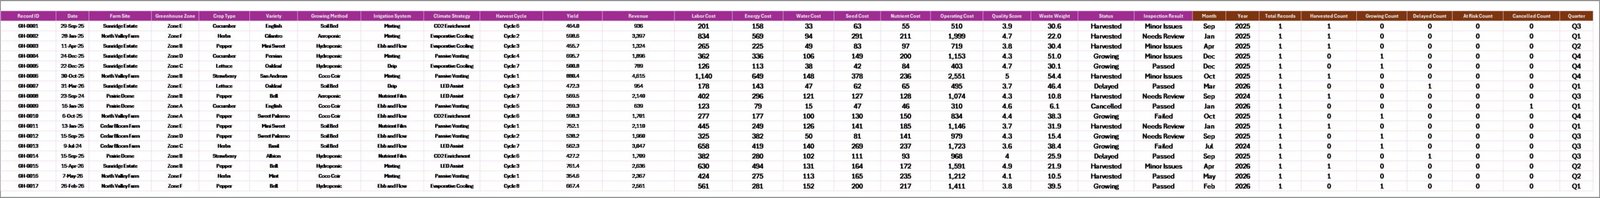
Data Sheet tab
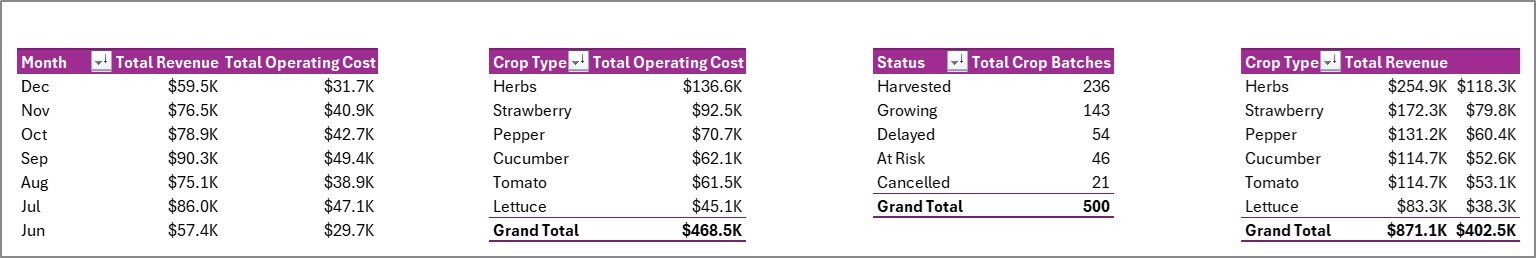
7. Support Sheet
The Support sheet contains pivot tables used to create the dynamic dashboard. After updating the Data sheet, go to the Data tab in the Excel ribbon and click Refresh All. You can keep this sheet hidden during normal use.
Support sheet tab
Greenhouse Farming Dashboard in Excel vs. Google Sheets vs. Paid Farm SaaS – Where This Fits
| Feature | This Excel Dashboard | Google Sheets Alternative | Paid Farm SaaS |
|---|---|---|---|
| Cost | $17.99 one-time | Usually free to low cost, but dashboard must be built or adapted | Monthly or annual subscription |
| Platform | Microsoft Excel workbook | Browser-based spreadsheet | Vendor cloud platform |
| Setup time | Replace sample data and refresh | Import data and rebuild formulas or charts | Requires onboarding and configuration |
| Real-time team collaboration | Available through OneDrive or SharePoint | Native collaboration | Usually included |
| Mobile access | Possible with Excel mobile or web | Strong browser/mobile access | Usually included |
| Customizable fields | Editable columns, pivots, charts, and formulas | Editable but structure may need rebuilding | Limited by vendor settings |
| Share with link | Possible through Microsoft 365 sharing | Native link sharing | Usually included |
| Year-1 cost at 5 users | $17.99 plus Microsoft licensing you already use | Low if self-managed | Often hundreds or thousands |
| Pivot-backed refresh | Built in with Refresh All | Requires equivalent query or pivot setup | Vendor controlled |
Who This Template Is For – and Who It’s Not For
Best for: greenhouse farm owners, controlled-environment agriculture teams, farm operations managers, quality teams, agribusiness consultants, and Excel users who need a ready reporting workbook for structured greenhouse data.
Not for: teams that need IoT sensor automation, live climate control, ERP integration, payroll, inventory purchasing workflows, pesticide compliance management, or a custom database application.
How to Use the Greenhouse Farming Dashboard in Excel
- Download and unzip the template file.
- Open the workbook in Microsoft Excel.
- Review the sample records in the Data sheet.
- Replace sample data with your greenhouse records using the same column format.
- Go to the Data tab in Excel and click Refresh All.
- Use slicers to filter the dashboard by site, crop type, status, method, zone, or available fields.
- Review Overview, Crop Insights, Farm Operations, Quality Review, and Cost Analysis pages.
- Keep the Support sheet hidden if you only want end users to see dashboard tabs.
Real-World Use Cases
Priya, greenhouse owner: Priya reviews revenue, operating cost, yield, quality score, and batch status every week before making crop allocation decisions.
Marco, farm operations manager: Marco filters by greenhouse zone and irrigation system to find where quality scores are improving and where at-risk batches need intervention.
Elena, agribusiness consultant: Elena compares profit margin, waste, harvest completion, and farm site performance for client review meetings.
Frequently Asked Questions
What does this Excel dashboard track?
It tracks revenue, operating cost, net farm profit, yield, crop batches, quality score, harvest completion, waste, crop type, variety, growing method, farm site, greenhouse zone, irrigation system, climate strategy, inspection result, and month or quarter trends.
Do I need advanced Excel skills?
No. You only need to replace sample data, refresh the workbook, and use slicers. Advanced users can also edit pivots, formulas, and charts.
Can I use my own greenhouse data?
Yes. Add your records to the Data sheet in the same format, then refresh all pivots and charts from the Excel Data tab.
Can I hide the Support sheet?
Yes. The Support sheet contains pivot tables used by the dashboard and can be kept hidden during normal use.
Is this a greenhouse management system?
No. It is an Excel analytics dashboard for reporting and review. It does not replace live climate automation, inventory software, or ERP systems.
Is this a subscription?
No. It is a one-time downloadable Excel template purchase.
About the Author
Built by PK – Microsoft Certified Professional with 15+ years of Excel, Google Sheets, and Power BI experience. Founder of NextGenTemplates, reaching 300K+ subscribers across YouTube channels. Every template is hand-built and tested before release.
Explore Related Templates
Pair this template with Greenhouse Farming KPI Dashboard in Excel, Agriculture Farm Dashboard in Google Sheets, and Drone Farming Startups Dashboard in Power BI. Browse more Excel Dashboard templates and MS Excel templates.
Download the Greenhouse Farming Dashboard in Excel today and start reviewing revenue, cost, yield, quality, crop batches, waste, harvest completion, and profitability from one editable workbook.
Last updated: June 18, 2026


Reviews
There are no reviews yet.