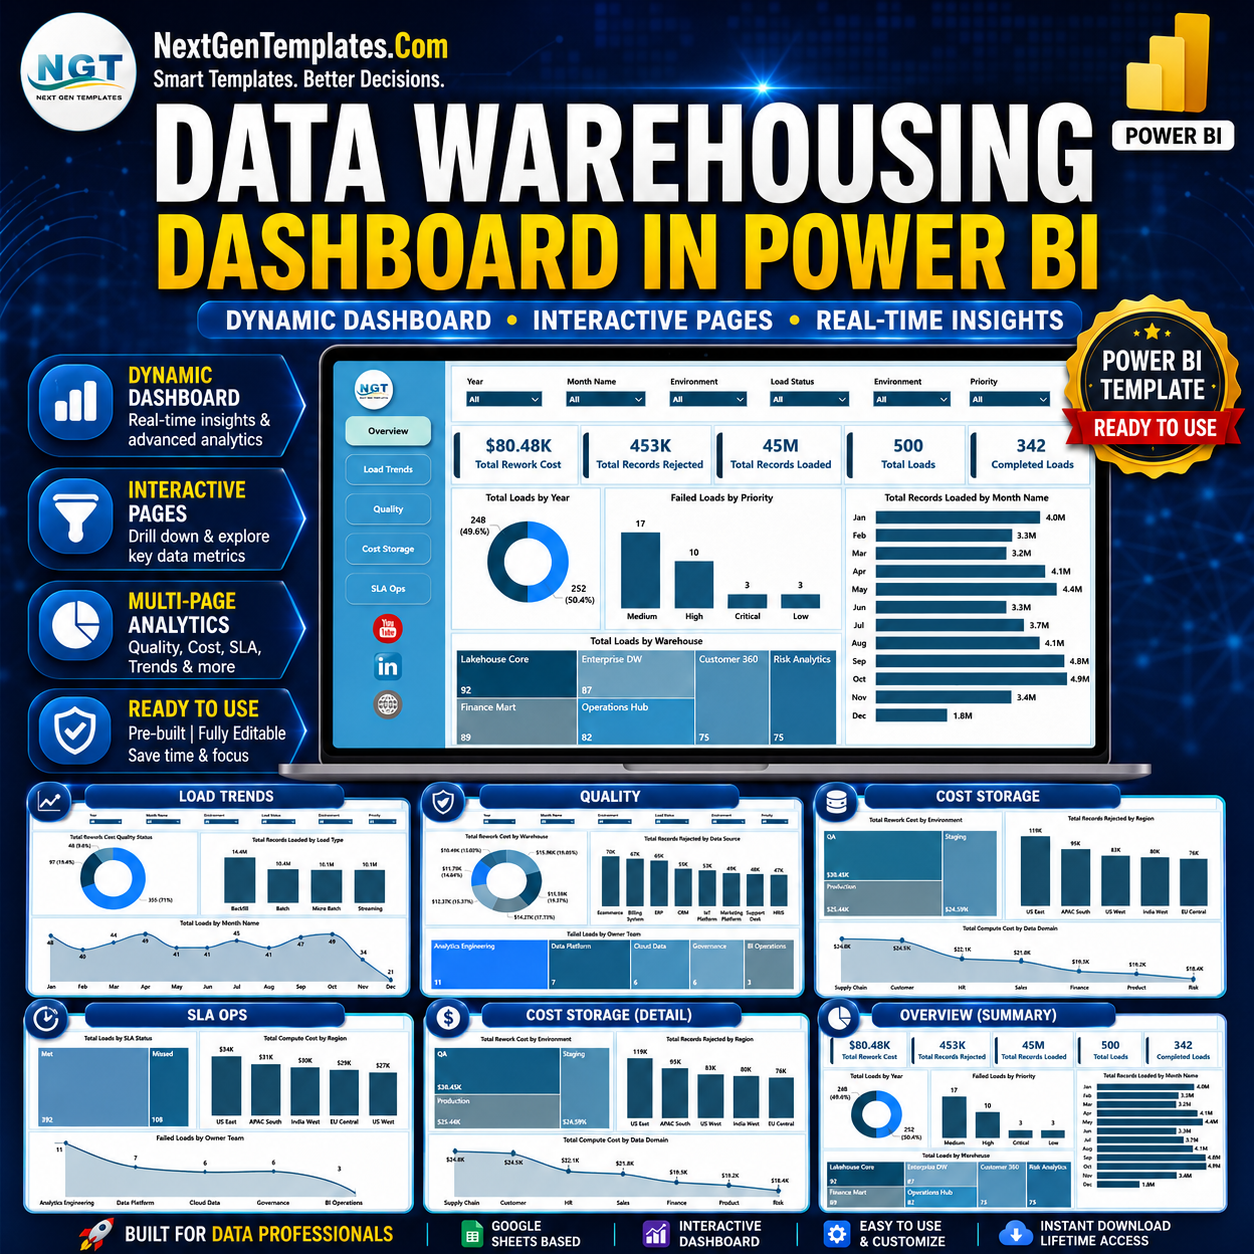


The Data Warehousing Dashboard in Power BI gives data engineering, BI, and analytics teams a ready-made view of warehouse loads, rejected records, rework cost, compute cost, and SLA health across 5 interactive report pages. Instead of rebuilding pipeline reports manually or paying for another monitoring tool, you can open the .pbix file, connect or replace the sample data, refresh the model, and review performance in minutes.
Join 8,400+ teams in 40+ countries using NextGenTemplates to replace repetitive reporting work with one-time-purchase Excel, Google Sheets, Power BI, and HTML templates. Instant download, lifetime access, no subscription, and no per-user fees.
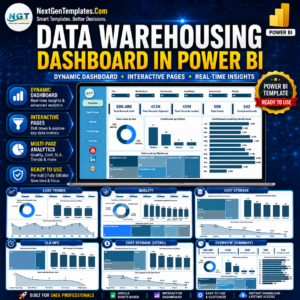
Key Features of Data Warehousing Dashboard in Power BI
- 5 connected Power BI pages: Overview, Load Trends, Quality, Cost Storage, and SLA Ops give leaders both executive summary and operational drill-down views.
- High-level KPI cards: Track Total Rework Cost, Total Records Rejected, Total Records Loaded, Total Loads, and Completed Loads from one model.
- Interactive slicers: Filter by date, warehouse, owner team, load type, environment, priority, region, data source, and SLA status depending on the page.
- Operational load monitoring: See load volume by year, month, warehouse, quality status, and load type.
- Quality and rejection analysis: Identify rejected-record patterns by data source, owner team, warehouse, and region.
- Cost visibility: Review rework and compute cost by environment, region, and data domain.
What’s Inside the Data Warehousing Dashboard in Power BI
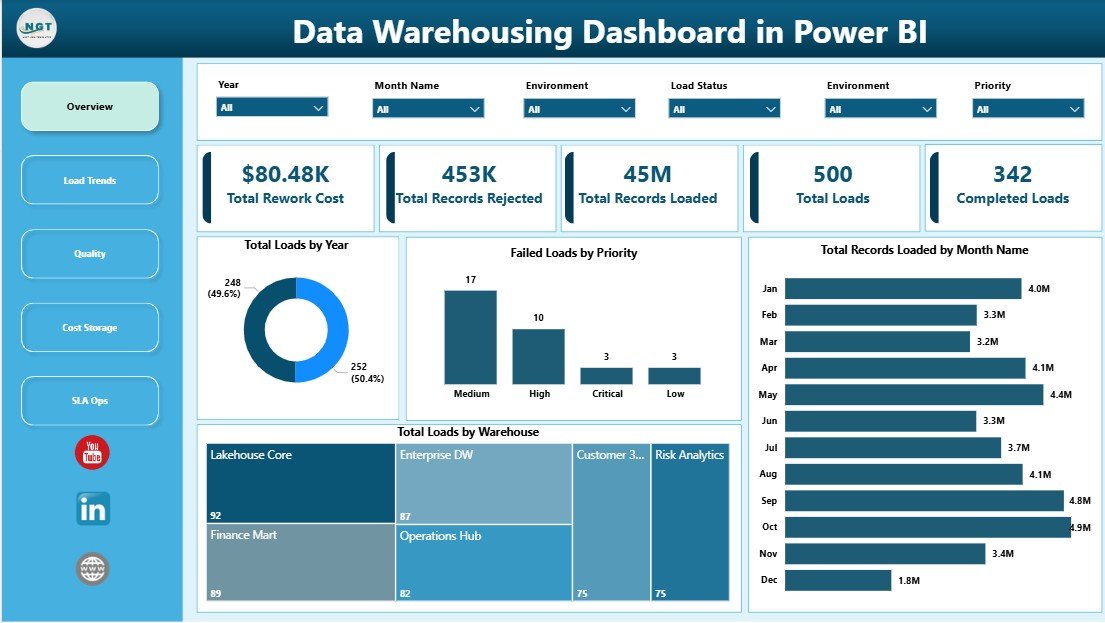
Overview Page
The Overview page gives a quick executive read of warehouse performance with cards for Total Rework Cost, Total Records Rejected, Total Records Loaded, Total Loads, and Completed Loads.
Total Loads by Year: This chart shows annual load volume so teams can spot growth, seasonality, and operational pressure over time. It helps managers compare current-year activity against prior years and plan capacity more clearly.
Failed Loads by Priority: This view separates failed loads by business priority to show where failures carry the highest risk. Teams can focus recovery work on high-priority pipelines instead of treating every issue the same.
Total Records Loaded by Month Name: Monthly record volume highlights recurring peaks and troughs in warehouse activity. It is useful for spotting heavy-processing months and planning compute resources.
Total Loads by Warehouse: This chart compares load counts across warehouses so leaders can see where activity is concentrated. It also helps identify underused or overloaded warehouse environments.
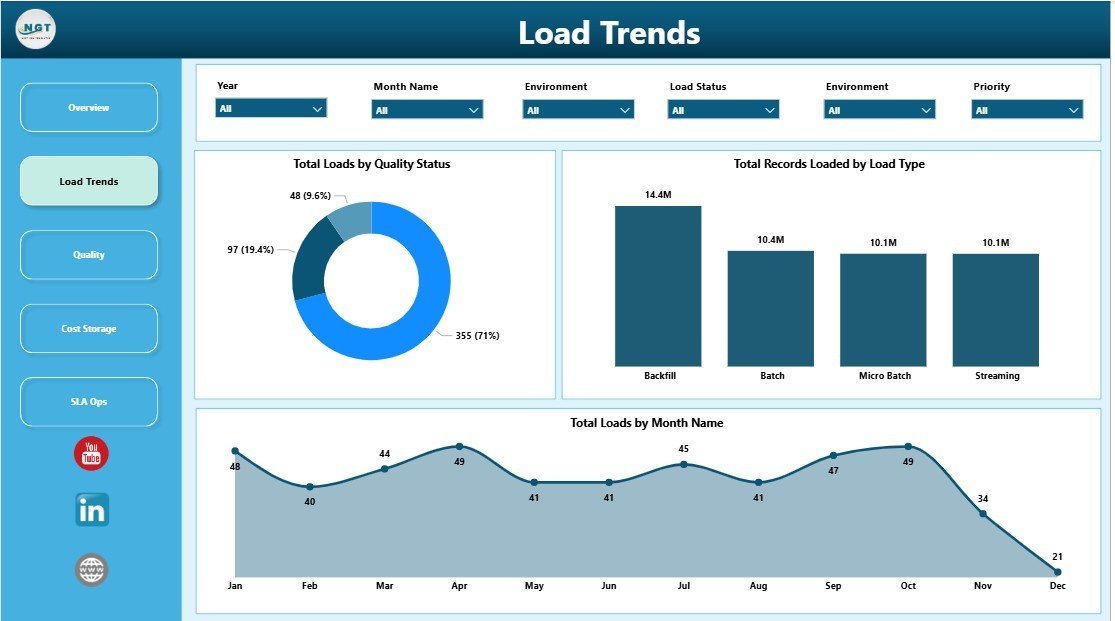
Load Trends
Total Loads by Quality Status: This chart separates successful, warning, and failed load outcomes so teams can judge data reliability quickly. It shows whether quality issues are isolated or becoming a trend.
Total Records Loaded by Load Type: Compare full, incremental, batch, and streaming-style loads to understand which methods move the most records. This helps teams optimize scheduling and warehouse processing strategy.
Total Loads by Month Name: Monthly load counts show how workload changes through the year. This is helpful for capacity planning, release planning, and spotting abnormal activity spikes.

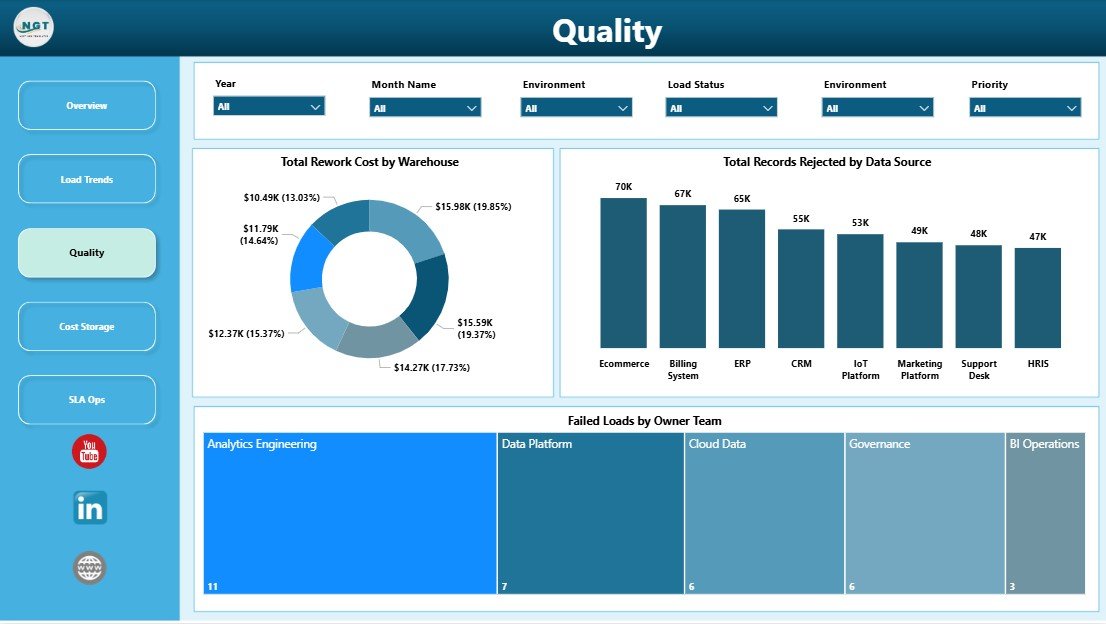
Quality
Total Rework Cost by Warehouse: This chart shows where data issues are creating the most rework expense. It helps engineering leaders decide which warehouse or process needs deeper quality review.
Total Records Rejected by Data Source: Rejected records by source expose feeds that regularly fail validation or mapping rules. Teams can use this to prioritize source-system fixes and reduce recurring cleanup work.
Failed Loads by Owner Team: This view connects load failures to responsible teams for clearer accountability. It supports faster follow-up during daily standups or weekly operations reviews.
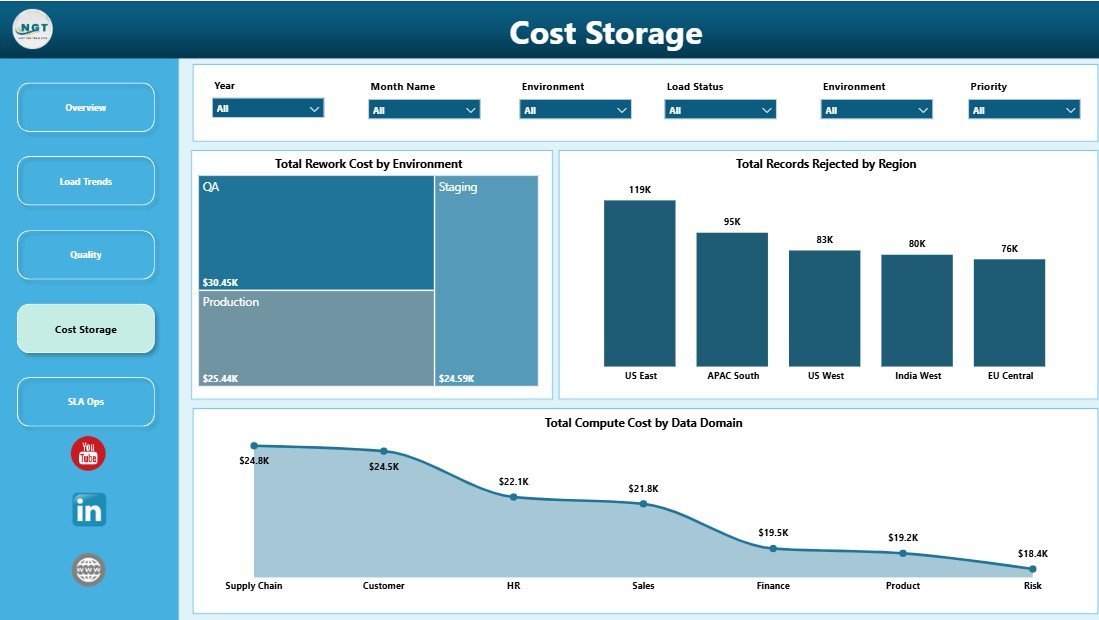
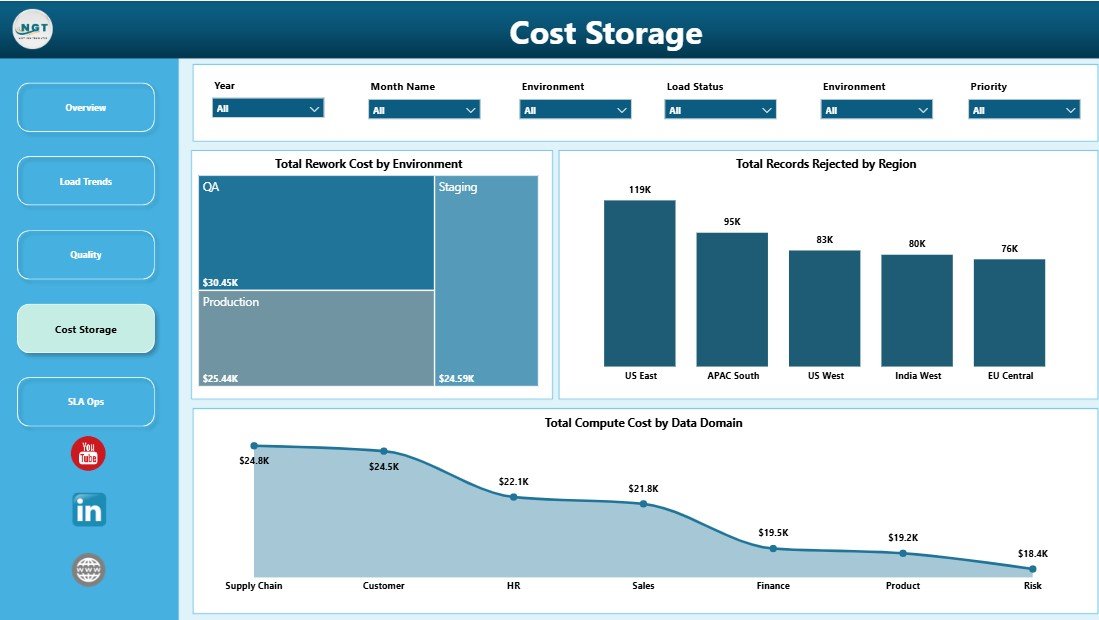
Cost Storage
Total Rework Cost by Environment: This chart compares rework cost across production, test, development, or other environments. It helps reveal whether avoidable cost is coming from live operations or pre-production testing.
Total Records Rejected by Region: Regional rejection patterns show whether certain geographies or business units are creating more data-quality friction. This is useful when warehouse feeds are split by market.
Total Compute Cost by Data Domain: Compute cost by domain shows which subject areas consume the most warehouse resources. Teams can use it to optimize expensive pipelines and support budget discussions.
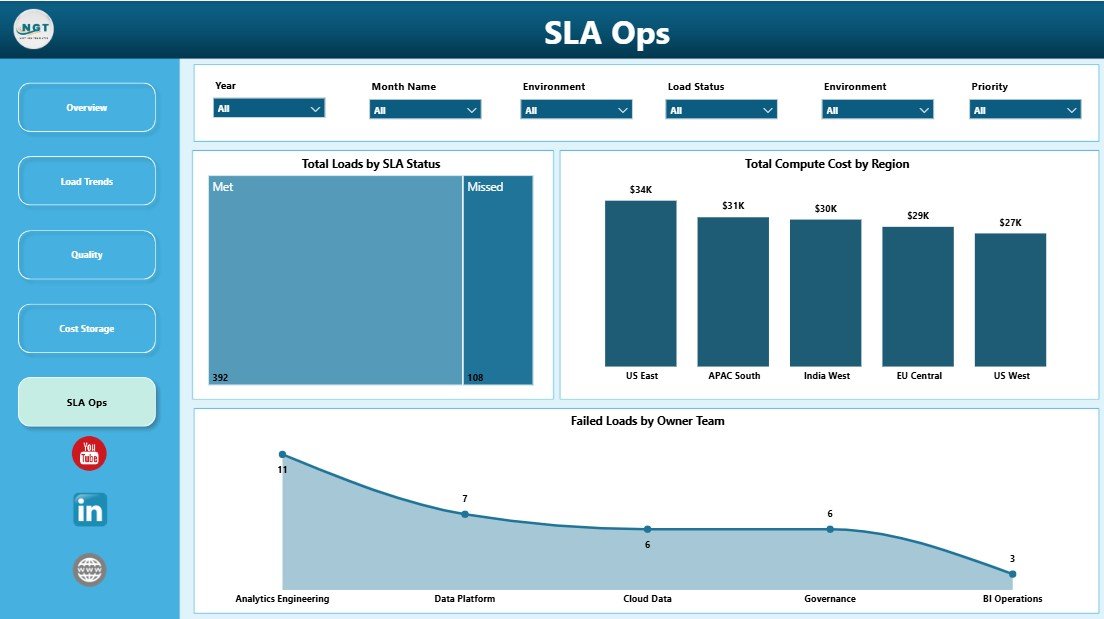
SLA Ops
Total Loads by SLA Status: This chart shows how many loads met, missed, or are at risk against SLA expectations. It gives operations teams a clean reliability signal for daily monitoring.
Total Compute Cost by Region: Regional compute cost highlights where warehouse processing is most expensive. It supports chargeback, budgeting, and cloud-cost optimization conversations.
Failed Loads by Owner Team: Owner-team failure counts reveal where support attention is needed most. This chart also helps leaders coach teams and reduce repeated operational breaks.
Data Warehousing Dashboard in Power BI vs. Tableau or Qlik vs. Paid Data Observability SaaS – Where This Fits
| Feature | Data Warehousing Dashboard in Power BI | Tableau or Qlik Build | Paid Data Observability SaaS |
|---|---|---|---|
| Cost | $17.99 one-time | License plus build time | Recurring platform fees |
| Platform | Power BI Desktop and Power BI Service | Tableau or Qlik | Vendor cloud platform |
| Setup time | Minutes after data replacement | Hours or days to model | Days or weeks of connector setup |
| Pipeline reporting | Built into 5 report pages | Custom build required | Advanced live monitoring |
| Customizable fields | Full Power BI model access | Full model access | Often vendor-defined |
| Year-1 cost at 5 users | $17.99 plus your Power BI licensing | Often hundreds or thousands | Often thousands or more |
Who This Template Is For – and Who It’s Not For
This template is ideal for data engineers, BI managers, analytics consultants, operations leaders, and IT teams that need a clean Power BI report for warehouse load performance. It is especially useful when you already have load logs, ETL output, or warehouse operational data and want a faster reporting layer.
It is not the right fit if you need real-time alerting, automatic incident creation, or direct observability-agent monitoring. In those cases, a dedicated data observability platform may be a better operational system.
How to Use the Data Warehousing Dashboard in Power BI
- Download and unzip the product file.
- Open the .pbix file in Power BI Desktop.
- Replace the sample data with your own warehouse load records or connect the model to your source.
- Refresh the report so cards, charts, and slicers update.
- Use the Overview page for leadership reporting and the other pages for operational drill-downs.
Real-World Use Cases
Data engineering lead: Review failed loads, owner-team accountability, and monthly load trends before the weekly platform review.
BI consultant: Deliver a polished Power BI warehouse operations dashboard to a client without building every page from scratch.
IT finance analyst: Use compute cost by region and data domain to support cloud-cost conversations.
Frequently Asked Questions
Do I need Power BI Desktop?
Yes. The .pbix file opens in Power BI Desktop, which is free from Microsoft. You only need Power BI Service licensing if you want publishing, scheduled refresh, or broader team sharing.
Can I replace the sample data?
Yes. The dashboard is designed so you can replace the sample load records with your own data and refresh the model.
What KPIs are included?
The main cards include Total Rework Cost, Total Records Rejected, Total Records Loaded, Total Loads, and Completed Loads.
Is this a live monitoring tool?
No. It is a Power BI reporting template. You can connect it to refreshed data sources, but it does not replace real-time alerting tools.
Can I customize the visuals?
Yes. Because it is a Power BI file, you can edit visuals, fields, DAX measures, colors, and pages based on your reporting needs.
Is this a one-time purchase?
Yes. It is a one-time purchase with instant download and no subscription from NextGenTemplates.
About the Author
Built by PK – Microsoft Certified Professional with 15+ years of Excel, Google Sheets, and Power BI experience. Founder of NextGenTemplates, reaching 300K+ subscribers across YouTube channels. Every template is hand-built and tested before release.
Explore Related Templates
Pair this product with the Data Warehousing Dashboard in Excel, the Data Privacy Office Dashboard in Power BI, and more Power BI Dashboard Templates.
Download the Data Warehousing Dashboard in Power BI today and turn warehouse load logs into clear operational insight.
Watch the step-by-step video tutorial:


Reviews
There are no reviews yet.