

The Small Business KPI Scorecard in Google Sheets tracks 15+ key performance indicators across 4 dedicated worksheets, with MTD and YTD comparison views, 12-month trend charts, and color-coded performance indicators. Setup takes under 10 minutes — just replace the sample data with your own and every metric updates automatically.
🌍 Join 8,400+ teams in 40+ countries using NextGenTemplates to replace paid SaaS tools with one-time-purchase Excel, Google Sheets, Power BI, and HTML templates.
✅ Instant download · One-time payment · No subscription · No per-user fees · Lifetime access
🔑 Key Features of Small Business KPI Scorecard in Google Sheets
📊 Scorecard Dashboard – The main interface displays all KPIs with actual vs target values, MTD and YTD comparisons, and color-coded visual indicators. Select the month from a dropdown to instantly view that period’s performance across every metric.
📈 KPI Trend Analysis – Select any KPI from the dropdown on range C3 to view its 12-month trend chart showing Actual, Target, and Prior Year data side by side. The sheet also displays the KPI Group, Unit, Type (Lower the Better or Upper the Better), Formula, and Definition for the selected metric.
🗓️ Flexible Time Period Views – Toggle between Monthly, MTD (Month-to-Date), and YTD (Year-to-Date) views using dropdown menus. This scorecard tracks metrics like revenue growth rate, customer acquisition cost, gross profit margin, employee productivity, and cash flow ratio.
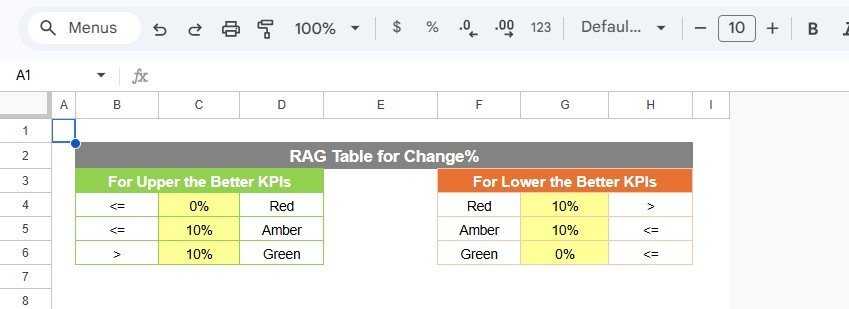
🎨 Conditional Formatting – Traffic-light color coding automatically highlights KPIs that are on track (green), at risk (amber), or underperforming (red). No manual formatting needed — the template calculates status based on actual vs target variance.
📝 Custom KPI Definitions – Define each KPI’s name, group, unit, formula, and business definition on the dedicated KPI Definition sheet. Supports both “Upper the Better” (e.g., revenue) and “Lower the Better” (e.g., cost per acquisition) metric types.
📦 What’s Inside the Small Business KPI Scorecard in Google Sheets
This template includes 4 worksheets designed for complete KPI tracking:
1. Scorecard Sheet
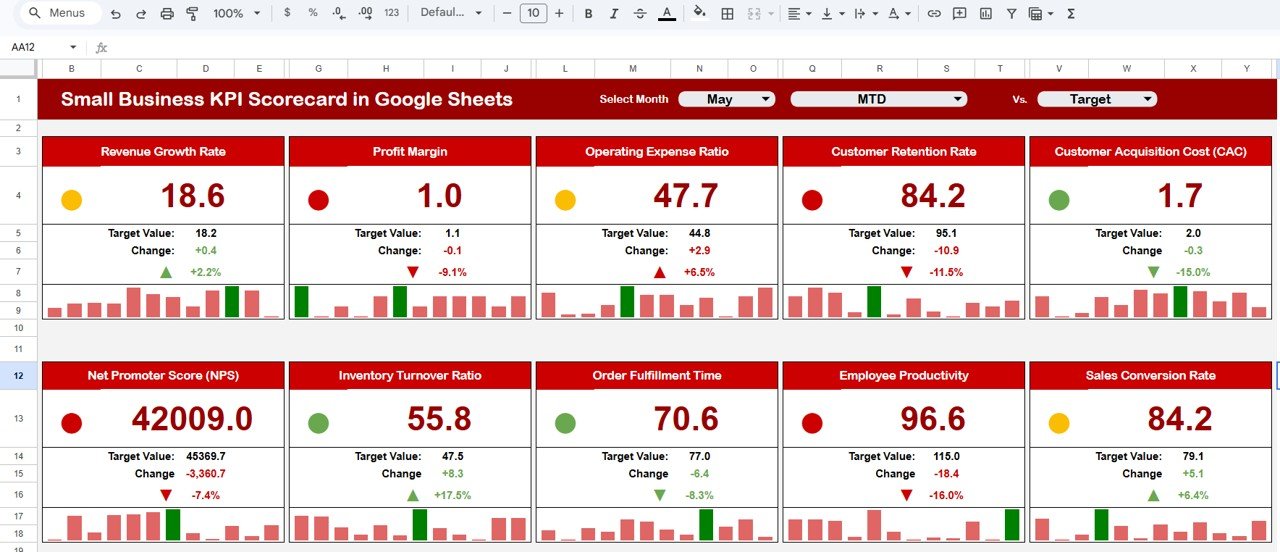 Small Business KPI Scorecard in Google Sheets
The Scorecard sheet is the main interface where you can view KPI performance. It includes dropdown menus to select the month, MTD, or YTD for performance analysis. Compare actual performance against targets for each KPI with color-coded visual indicators for quick status checks.
2. KPI Trend Sheet
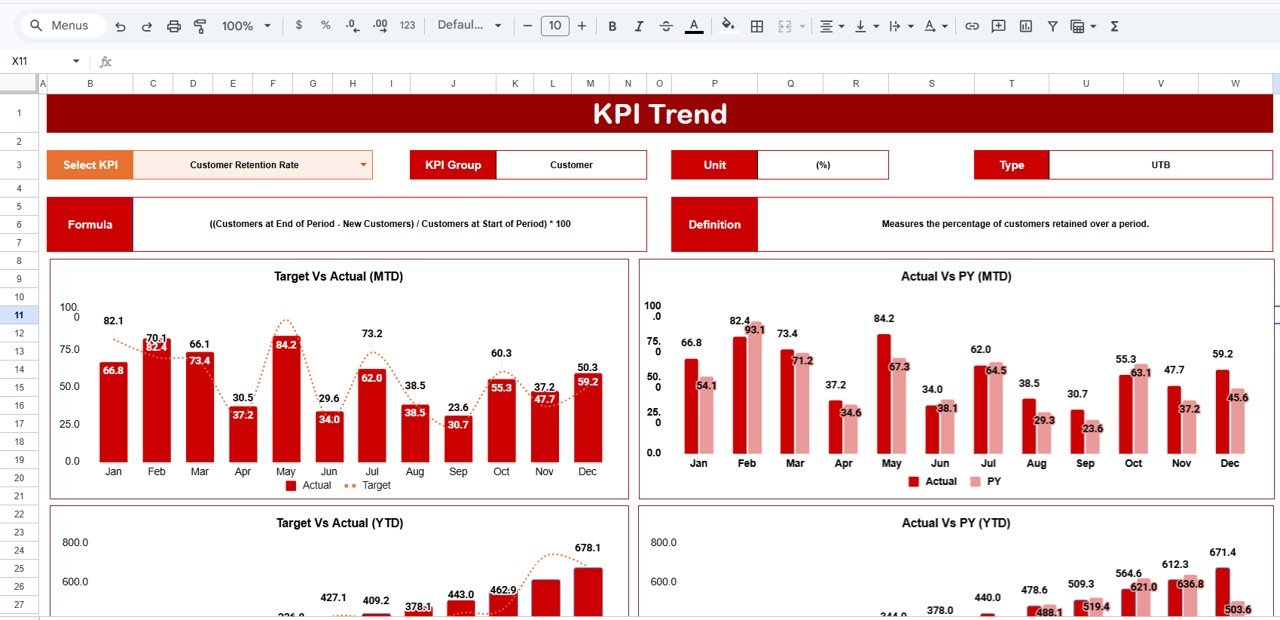 KPI Trend Sheet
Select any KPI name from the dropdown available on range C3. The sheet displays the KPI Group, Unit, Type, Formula, and Definition. MTD and YTD trend charts show Actual, Target, and Prior Year numbers for the selected KPI.
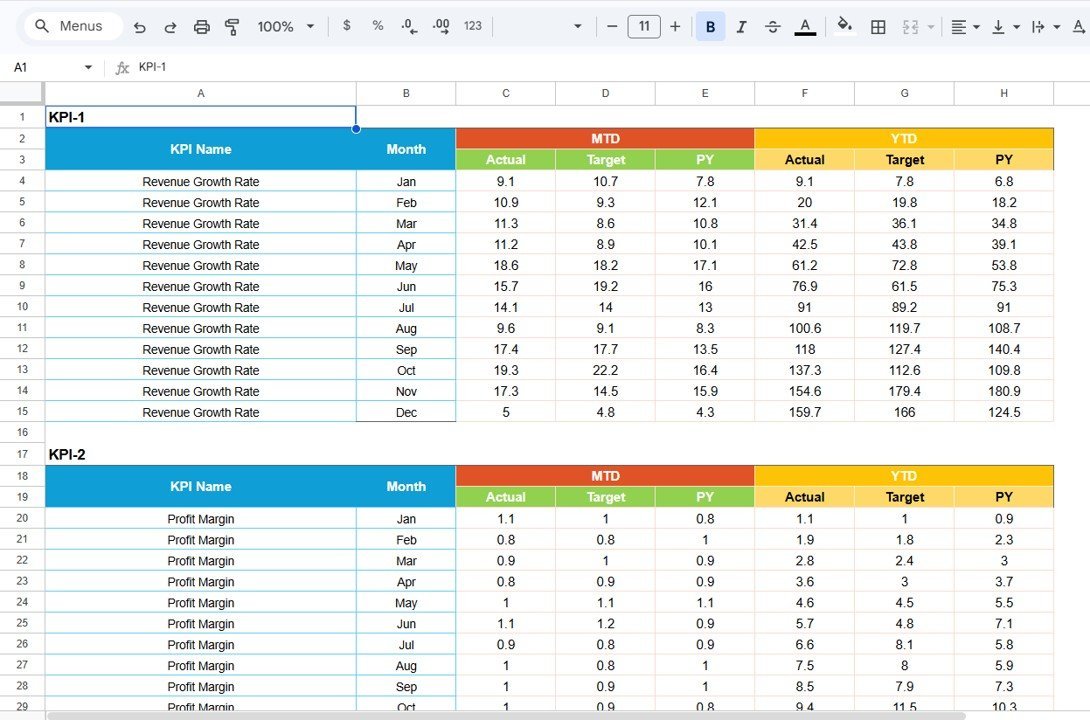
3. Input Data Sheet
 Input Data Sheet
Record actual values, targets, and other metrics for each KPI. Update data as new results become available to keep the scorecard current.
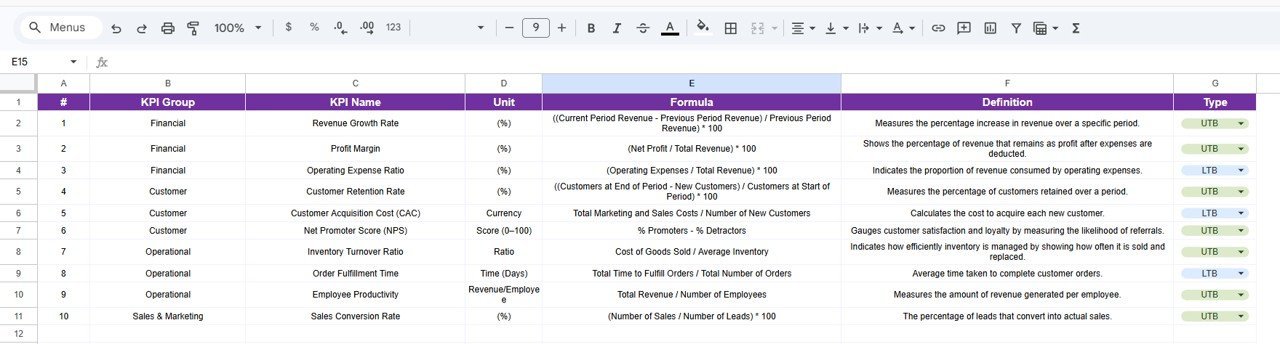
4. KPI Definition Sheet
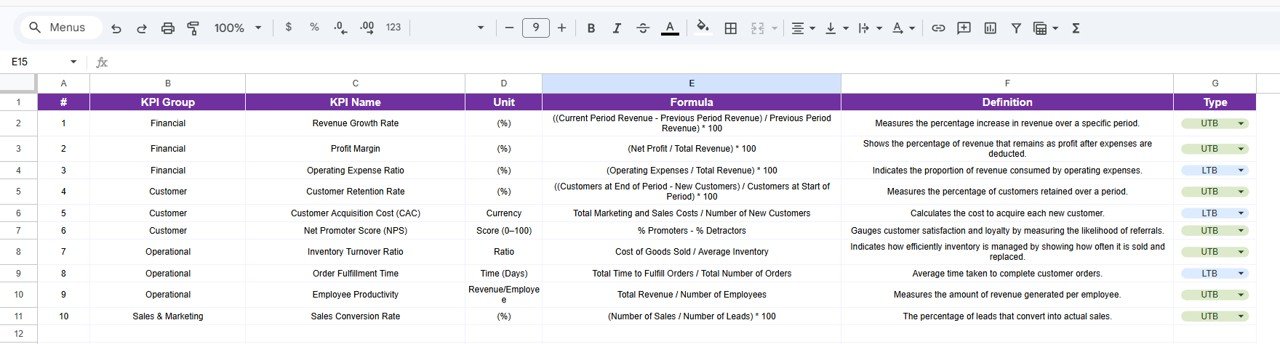 KPI Definition Sheet
Enter the KPI Name, KPI Group, Unit, Formula, and KPI definition for each metric you want to track.
📊 Small Business KPI Scorecard in Google Sheets vs. Microsoft Excel vs. Paid SaaS — Where This Fits
| Feature | Small Business KPI Scorecard in Google Sheets | Microsoft Excel Scorecard | Databox / Klipfolio |
|---|---|---|---|
| Cost | $8.99 one-time | $12-20 one-time (template) + Excel license | $47-135 / month |
| Platform | Google Sheets (free, browser-based) | Microsoft Excel (license required) | Cloud SaaS |
| Setup Time | Under 10 minutes | 15-30 minutes | 1-3 hours + integrations |
| Real-time Team Collaboration | ✅ Built-in (Google Sheets) | ❌ Limited (OneDrive only) | ✅ Yes |
| Mobile Access | ✅ Any browser or Google Sheets app | ❌ Desktop-first | ✅ Mobile app |
| Customizable KPIs | ✅ Full control over definitions | ✅ Yes | ⚠️ Limited on lower plans |
| Share with Link | ✅ One-click sharing | ❌ Email attachment | ✅ Dashboard links |
| Year-1 Cost at 5 Users | $8.99 total | $15 + $70/yr/user (M365) | $564-1,620 |
| MTD/YTD Trend Charts | ✅ Built-in with Actual/Target/PY | ✅ Manual setup needed | ✅ Auto-generated |
For small business owners who want KPI tracking without paying monthly SaaS fees, the Small Business KPI Scorecard in Google Sheets sits in the sweet spot.
👥 Who This Template Is For — and Who It’s Not For
✅ This template is built for:
- Small business owners tracking 10-25 KPIs across sales, finance, operations, and customer service
- Startup founders who need a quick, affordable performance tracking tool without SaaS subscriptions
- Business managers at companies with 5-100 employees who report KPIs to leadership monthly
- Freelancers and solopreneurs monitoring revenue, expenses, and client metrics in one place
❌ This template is NOT for:
- Enterprise teams needing real-time API integrations with 50+ data sources (use Databox or Klipfolio)
- Organizations requiring SOC 2 compliance and enterprise-grade access controls
- Teams tracking 100+ KPIs across multiple business units simultaneously
⚙️ How to Use the Small Business KPI Scorecard in Google Sheets
1. Open the PDF guide included in your download and click the Google Sheets copy link to create your own editable version in Google Drive.
2. Go to the KPI Definition sheet and enter your KPI names, groups, units, formulas, and definitions.
3. Navigate to the Input Data sheet and enter your monthly actual values and targets for each KPI.
4. Switch to the Scorecard sheet, select a month from the dropdown, and review your KPI performance with color-coded indicators.
5. Use the KPI Trend sheet to select individual KPIs and analyze their 12-month performance trends.
6. Share the Google Sheet with your team using the Share button for real-time collaboration.
💼 Real-World Use Cases
Ravi runs a 15-person digital marketing agency in Bangalore. He uses the Small Business KPI Scorecard in Google Sheets to track client acquisition cost, monthly recurring revenue, employee utilization rate, and project delivery timelines. Each Monday, he opens the Scorecard sheet, selects the current month, and shares the link with his operations lead — replacing a $99/month Databox subscription.
Maria owns a bakery with 3 locations in Austin. She enters weekly sales, food cost percentage, customer satisfaction scores, and waste reduction targets into the Input Data sheet. The MTD and YTD trend charts help her identify which location is underperforming before it shows up on the P&L statement.
David is a freelance IT consultant in London. He tracks billable hours, invoice collection rate, lead conversion rate, and monthly revenue using this scorecard. The KPI Definition sheet lets him customize every metric to match his consulting practice — no IT department needed to set it up.
❓ Frequently Asked Questions
What KPIs does the Small Business KPI Scorecard in Google Sheets track?
The Small Business KPI Scorecard in Google Sheets tracks 15+ key performance indicators including revenue, profit margin, customer acquisition cost, employee productivity, and cash flow. You can customize every KPI on the KPI Definition sheet to match your business.
Can I add my own custom KPIs to this scorecard?
Yes. The KPI Definition sheet lets you define custom KPI names, groups, units, formulas, and descriptions. You can add, remove, or modify any metric to fit your specific small business needs.
How does the Small Business KPI Scorecard compare to Databox?
The Small Business KPI Scorecard costs $8.99 one-time versus Databox at $47-135 per month. For small businesses that manually enter KPI data monthly, this Google Sheets scorecard delivers the same MTD/YTD tracking at a fraction of the cost.
Does this template work on mobile devices?
Yes. Since it runs in Google Sheets, you can view and edit the scorecard from any smartphone or tablet using the Google Sheets app or any mobile browser. No desktop software required.
How long does setup take for the Small Business KPI Scorecard?
Setup takes under 10 minutes. Open the Google Sheets copy link, define your KPIs on the Definition sheet, enter your first month of data on the Input Data sheet, and the Scorecard and Trend sheets update automatically.
Can multiple team members access this scorecard at the same time?
Yes. Google Sheets supports real-time collaboration. Share the scorecard link with your team and everyone can view or edit simultaneously — no version conflicts or email attachments needed.
What if I need to track more than 15 KPIs?
The template supports additional KPIs. Simply add new rows on the KPI Definition sheet and corresponding data entries on the Input Data sheet. The Scorecard and Trend charts will include the new metrics automatically.
👤 About the Author
Built by PK — Microsoft Certified Professional with 15+ years of Excel, Google Sheets, and Power BI experience. Founder of NextGenTemplates, reaching 300K+ subscribers across YouTube channels (@PK-AnExcelExpert, @NextGenTemplates, @NeoTechNavigators). Every template is hand-built and tested before release.
🔗 Explore Related Templates
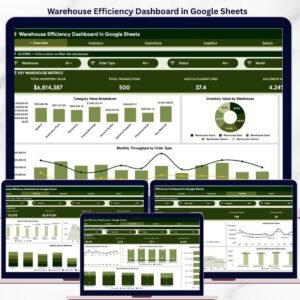
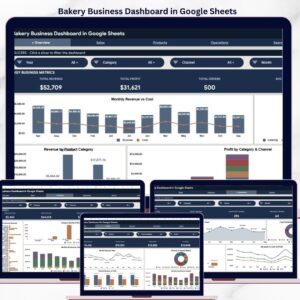
📊 Bakery Business Dashboard in Google Sheets – Track sales, inventory, and profitability across multiple bakery locations with 5 interactive pages.
📊 Ecommerce Conversion Rate KPI Dashboard in Google Sheets – Monitor conversion funnels, cart abandonment, and revenue per visitor with automated trend analysis.
📊 Pet Care Business Dashboard in Google Sheets – Track appointments, revenue, customer retention, and service metrics for pet care businesses.
📊 Catering Business KPI Scorecard in Excel – Need the Excel version? Track catering KPIs with the same scorecard format in Microsoft Excel.
Browse all Google Sheets Dashboard Templates to find the right fit for your business.
📖 Click here to read the Detailed Blog Post
🎥 Visit our YouTube channel for step-by-step video tutorials
👉 YouTube.com/@NextGenTemplates


Reviews
There are no reviews yet.