Whether you run IT, HR, finance, or procurement as part of a shared services model, this Google Sheets scorecard gives your team a single source of truth for monthly performance reviews. Replace fragmented reports with a structured, visual scorecard that updates as soon as you enter new data — no formulas to build, no charts to create manually. The Shared Services KPI Scorecard in Google Sheets is designed for mid-market operations teams who need results fast without enterprise software overhead.Shared Services KPI Scorecard in Google Sheets
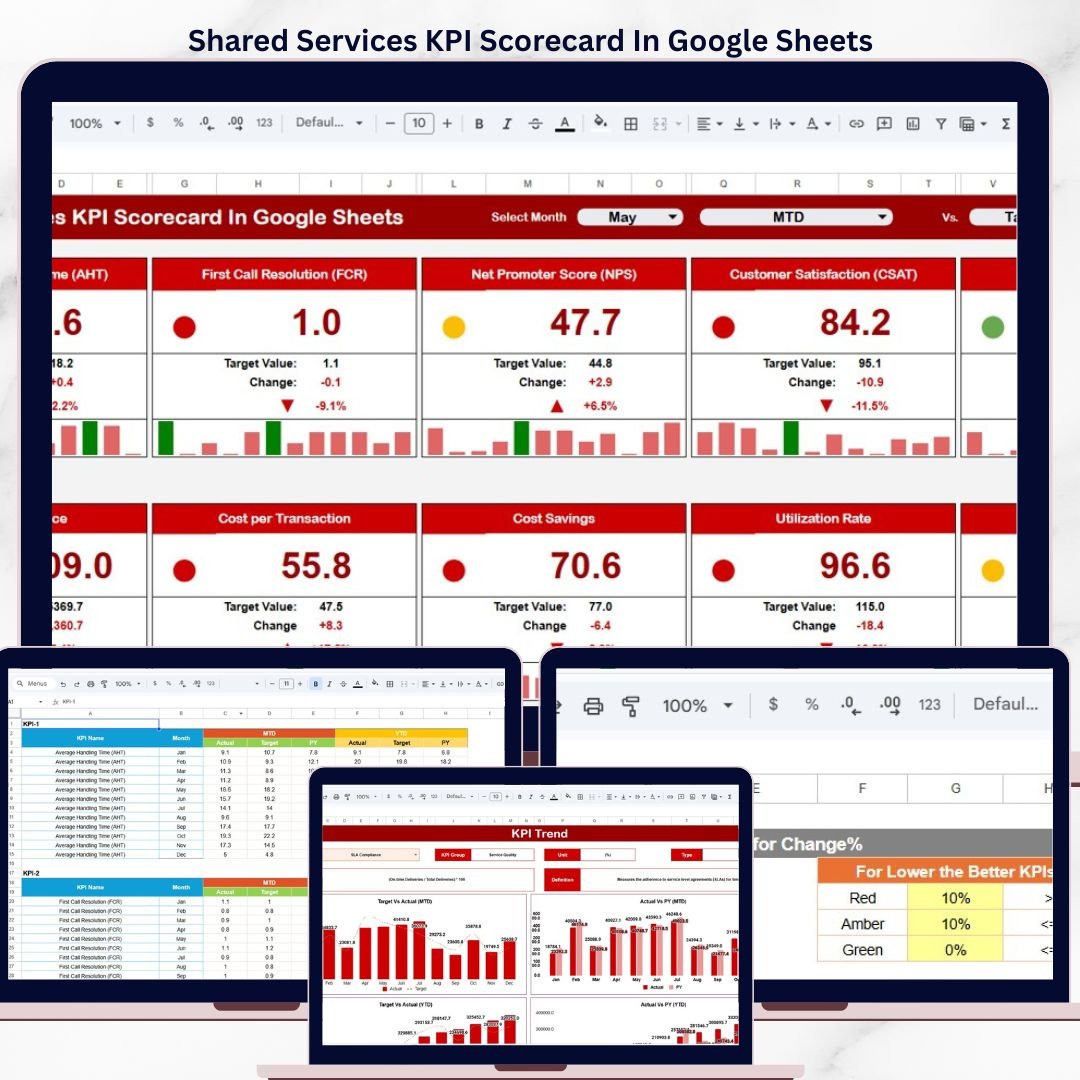
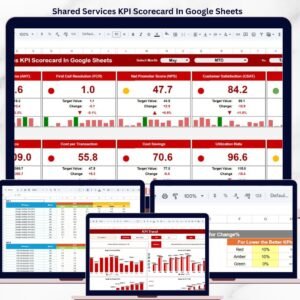
Shared Services KPI Scorecard In Google Sheets
Key Features of Shared Services KPI Scorecard In Google Sheets
The Shared Services KPI Scorecard In Google Sheets includes 4 purpose-built worksheets: a Scorecard sheet with dropdown filters for monthly, MTD, and YTD views; a KPI Trend sheet with 12-month actual-vs-target-vs-prior-year trend charts; an Input Data sheet for centralized data entry; and a KPI Definition sheet documenting every metric’s formula, group, and purpose.
Each KPI displays its actual value, target value, variance, and a color-coded status indicator — green for on-track, red for underperforming. The scorecard tracks performance across every function you manage, from IT helpdesk resolution time to accounts payable cycle days. The KPI Trend sheet lets you select any individual metric from a dropdown on cell C3 and instantly view its MTD and YTD trend, along with the KPI Group, Unit, Type (Lower the Better or Upper the Better), Formula, and Definition.
This template supports unlimited KPI customization through the KPI Definition sheet, where you control every metric’s name, group, unit, formula, and description. If your shared services team manages 10 functions or 50 KPIs, the structure scales without modifications. For teams already using Google Sheets dashboards, also explore the Startup Growth KPI Scorecard in Google Sheets for growth-stage metric tracking.
Dashboard Pages Explanation
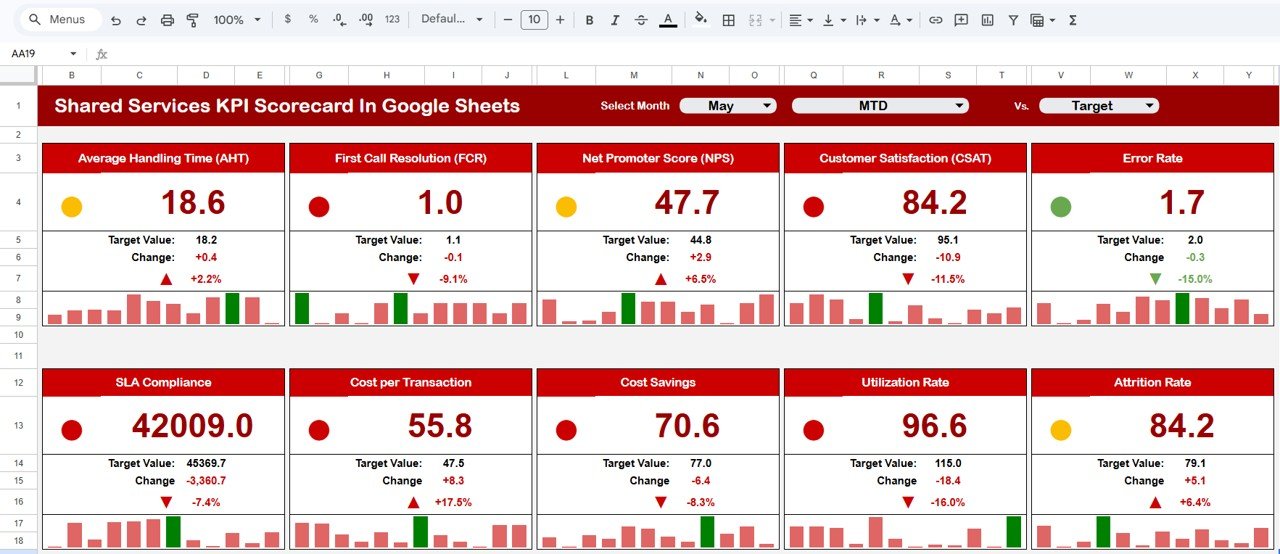
Scorecard Sheet
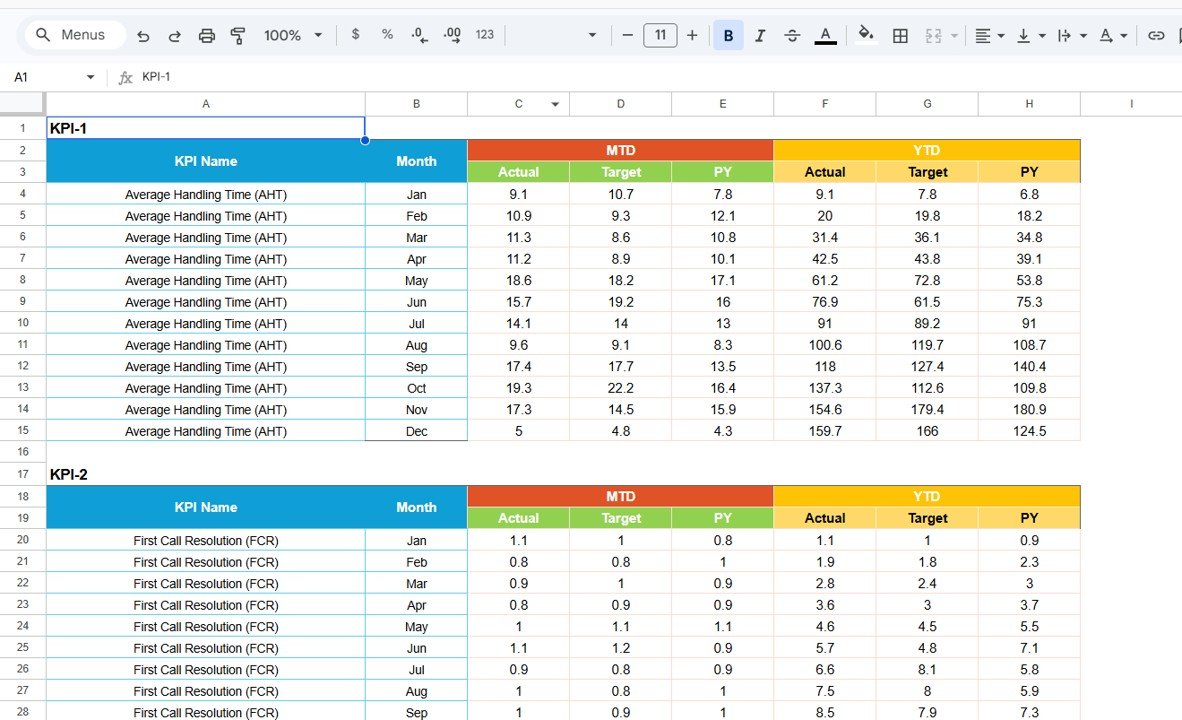
The Scorecard sheet is the main interface for reviewing shared services KPI performance. It includes dropdown menus at the top to select the reporting period — monthly, MTD (Month-to-Date), or YTD (Year-to-Date). For each KPI, the sheet displays the actual value, target value, percentage achievement, and a visual indicator showing whether the metric is on track, at risk, or underperforming.
The layout groups KPIs by service function, making it straightforward to scan IT metrics separately from HR or finance metrics during monthly reviews. Conditional formatting automatically highlights cells based on performance thresholds, so your leadership team can identify problem areas in seconds rather than digging through raw numbers.
Shared Services KPI Scorecard In Google Sheets
KPI Trend Sheet
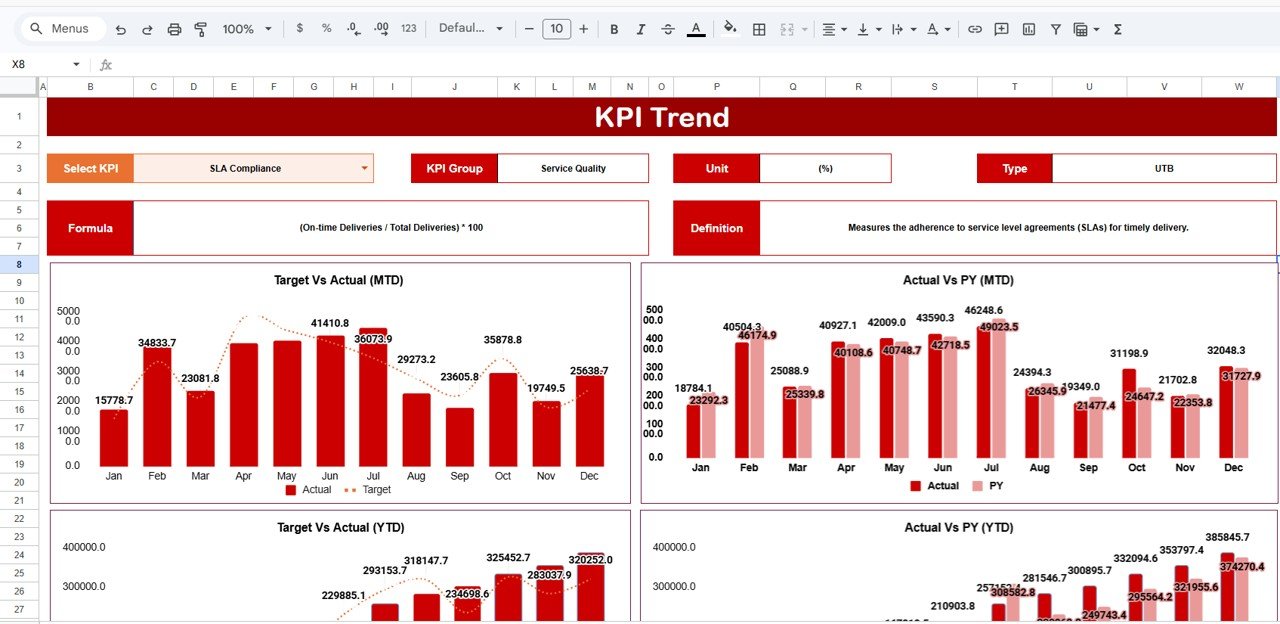
The KPI Trend sheet provides a detailed view of individual KPI performance over time. Select any KPI from the dropdown available on cell C3, and the sheet immediately populates with that metric’s 12-month history. It displays the KPI Group, Unit of measurement, Type (Lower the Better or Upper the Better), Formula, and Definition — ensuring everyone reading the report understands exactly what’s being measured.
Below the metadata, MTD and YTD trend charts compare Actual, Target, and Prior Year numbers side by side. This view helps you spot seasonal patterns, identify persistent underperformance, and prepare data-backed commentary for quarterly business reviews. Teams at organizations like Google Sheets power users find this format especially effective for stakeholder presentations.
KPI Trend Sheet
Input Data Sheet
The Input Data sheet is your centralized data entry hub. Record actual values, targets, and supplementary metrics for every KPI by month. The sheet is structured so that updates flow directly into the Scorecard and Trend sheets without any manual linking or formula adjustments. As new monthly results become available, simply enter them here and the entire scorecard refreshes.
Input Data Sheet
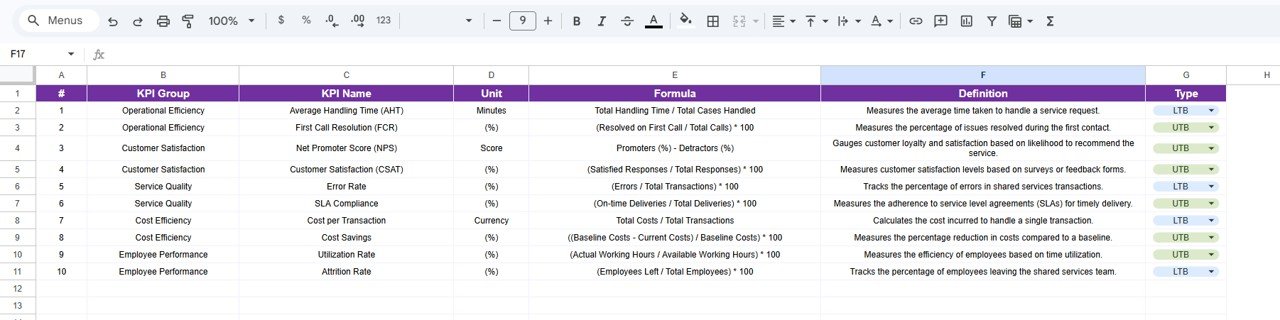
KPI Definition Sheet
The KPI Definition sheet documents every metric your shared services team tracks. Enter the KPI Name, KPI Group (e.g., IT, HR, Finance), Unit (percentage, days, count), Formula (how it’s calculated), and a plain-language Definition. This sheet ensures all stakeholders share a consistent understanding of each metric, which is especially important when multiple departments contribute data to the same scorecard. For a similar structure applied to general business operations, see the General Management KPI Scorecard in HTML.
KPI Definition Sheet
Shared Services KPI Scorecard vs. Microsoft Excel Scorecard vs. ServiceNow — Feature Comparison
| Feature | Shared Services KPI Scorecard (Google Sheets) | Microsoft Excel Scorecard | ServiceNow Performance Analytics |
|---|---|---|---|
| Cost | $8.99 one-time | $14.99+ one-time | $50-150/user/month |
| Platform | Google Sheets (free) | Microsoft Excel (license required) | Cloud SaaS (browser) |
| Setup Time | Under 10 minutes | 15-30 minutes | Weeks to months |
| Real-Time Collaboration | ✅ Built-in (Google Sheets) | Requires OneDrive/SharePoint | ✅ Yes |
| Mobile Access | ✅ Google Sheets app | Limited on mobile | ✅ Yes |
| Custom KPI Definitions | ✅ Dedicated sheet | Manual setup | ✅ Admin-configured |
| Trend Charts | ✅ MTD + YTD built-in | Manual chart creation | ✅ Advanced analytics |
| Year-1 Cost at 5 Users | $8.99 total | $14.99 + Excel licenses | $3,000-9,000 |
| No IT Department Needed | ✅ Self-service | ✅ Self-service | ❌ IT setup required |
For teams that want structured KPI tracking without enterprise software costs, the Shared Services KPI Scorecard in Google Sheets sits in the sweet spot.
Who Should Use This Template
Perfect for:
- Shared services managers tracking KPIs across IT, HR, finance, and procurement functions at organizations with 50-5,000 employees
- Operations directors who need a single monthly scorecard view for all internal service departments
- CFOs and COOs running quarterly business reviews with data from multiple service lines
- Management consultants building KPI frameworks for clients transitioning to shared services models
Not a fit if:
- You operate an enterprise shared services center with 10,000+ employees requiring API integrations to SAP, Oracle, or Workday
- Your team needs real-time automated data feeds from ITSM tools like ServiceNow or Jira Service Management
- You require SOC 2 compliance, audit trails, and role-based access control for KPI data changes
Real-World Use Cases
Rajesh leads shared services at a 200-person manufacturing firm in Pune. His team manages IT helpdesk, HR onboarding, and accounts payable for 3 plant locations. Before this scorecard, monthly reporting meant collecting data from 5 different email threads and building a PowerPoint from scratch. Now he enters numbers into the Input Data sheet, and the Scorecard sheet generates a presentation-ready view with MTD/YTD comparisons that leadership reviews in their monthly operational review meeting.
Maria manages a shared services center for a 4-hospital network in Texas. She tracks patient billing accuracy, vendor payment turnaround, and facility maintenance response time across all locations. The KPI Trend sheet helps her identify which facilities consistently miss targets on specific metrics, enabling proactive resource reallocation before issues escalate to quarterly reviews. She also uses the Expense Management KPI Dashboard in Google Sheets for her department’s budget trackingShared Services KPI Scorecard in Google Sheets
David is a management consultant helping mid-market companies in Southeast Asia set up shared services for the first time. He uses the KPI Definition sheet as a collaborative framework during discovery workshops — defining metrics with client stakeholders before any data enters the system. Within a single 2-week engagement, the scorecard transitions from a consulting tool to the client’s ongoing performance management platform.Shared Services KPI Scorecard in Google Sheets
Advantages of Shared Services KPI Scorecard In Google Sheets
- Zero software cost — Google Sheets is free for any Google account holder. The template itself costs $8.99 one-time with no recurring fees, compared to $3,000-9,000 per year for enterprise performance analytics tools.
- Built-in collaboration — Unlike Excel, Google Sheets allows multiple users to view and edit simultaneously. Share a single link with your leadership team and eliminate version-control headaches.
- Customizable to any KPI set — The KPI Definition sheet lets you define metrics specific to your organization’s shared services model. Track 10 KPIs or 50 — the structure adapts without any modifications.
- Instant visual reporting — Conditional formatting, trend charts, and MTD/YTD dropdowns turn raw numbers into presentation-ready performance views within seconds of data entry.
- Works on any device — Access your scorecard from desktop, tablet, or phone via the Google Sheets app. Review KPI performance from anywhere.
Opportunities for Improvement
- The template does not pull data automatically from source systems — you’ll need to enter monthly actuals manually or use Google Sheets add-ons for data imports.
- For organizations with 100+ KPIs across 10+ departments, the single-sheet Scorecard view may become dense. Consider breaking into department-specific copies linked to a master summary.
- No built-in role-based access control — all collaborators with edit access can modify any cell. Use Google Sheets’ protected ranges feature to limit input areas for different team members.
- Trend charts show monthly granularity only — weekly or daily tracking would require structural modifications to the Input Data sheet.
Best Practices
- Start by completing the KPI Definition sheet first — clearly defined metrics prevent confusion when multiple departments contribute data later.
- Assign a data steward for each shared services function (IT, HR, Finance, Procurement) to enter their monthly actuals by a fixed deadline (e.g., 5th of each month).
- Use the KPI Trend sheet during quarterly reviews to identify metrics that have been underperforming for 3+ consecutive months — these warrant root-cause analysis.
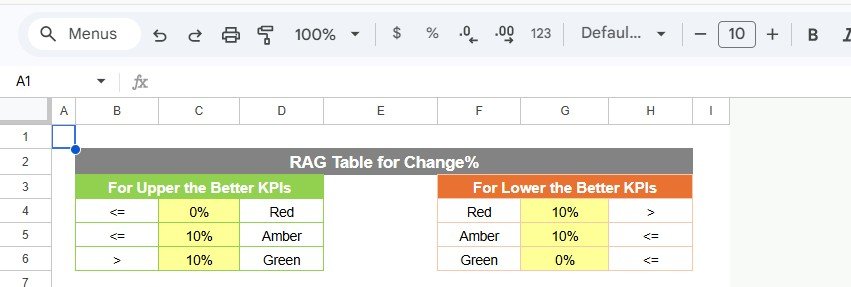
- Set the KPI Type (Lower the Better vs. Upper the Better) accurately in the Definition sheet — this determines how the scorecard interprets performance against targets.
- Share the scorecard as view-only with executives and edit-access with data stewards to maintain data integrity.Shared Services KPI Scorecard in Google Sheets
📖 Click here to read the Detailed Blog Post
🎥 Visit our YouTube channel for step-by-step tutorials: Youtube.com/@NeoTechNavigators


Reviews
There are no reviews yet.