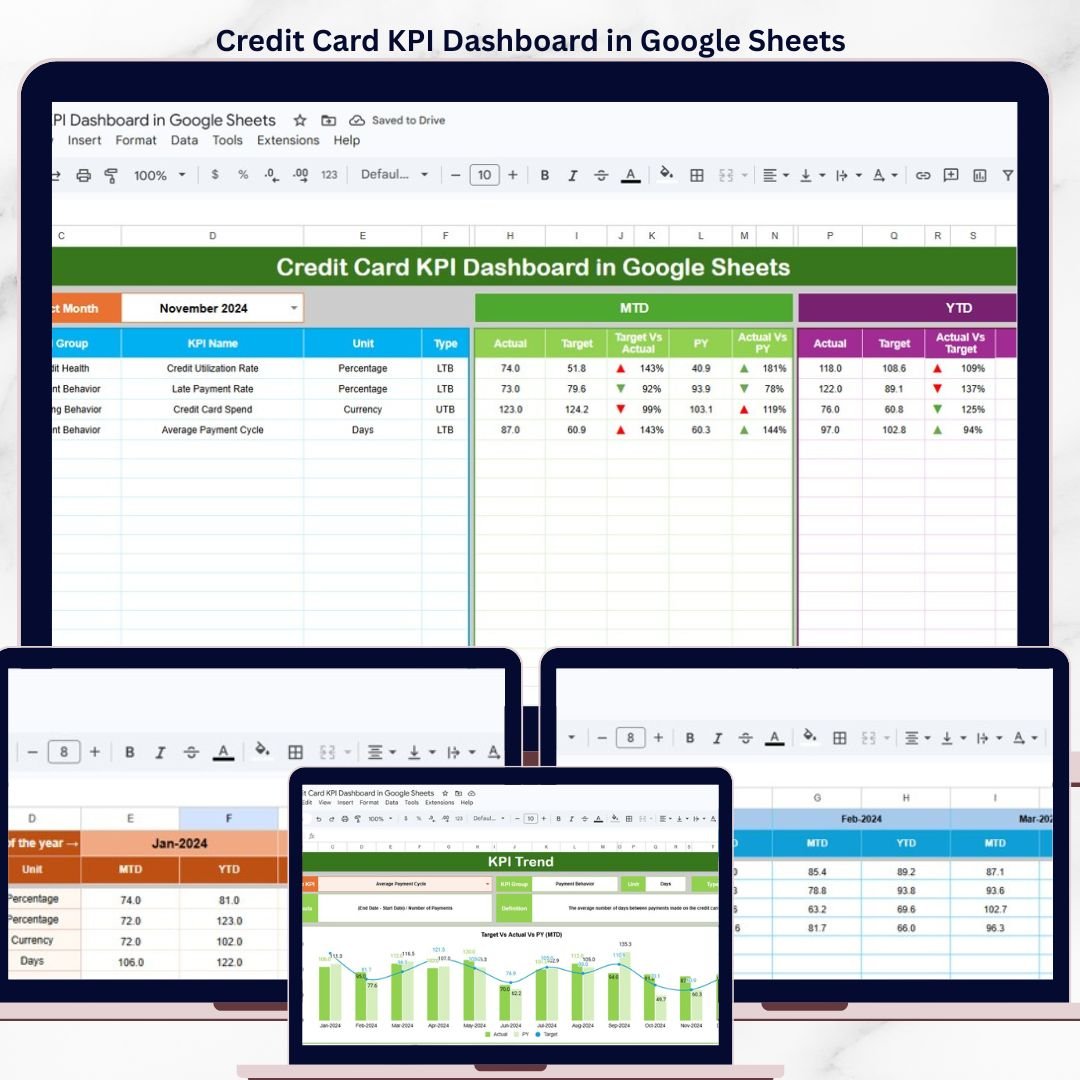

The Credit Card KPI Dashboard in Google Sheets tracks credit card performance across 6 interactive worksheets, with MTD and YTD comparisons against targets and previous-year benchmarks. It includes trend charts for every KPI, conditional-formatting arrows for instant status checks, and built-in LTB/UTB logic. Setup takes under 10 minutes — replace the sample data and the entire dashboard updates automatically.Credit Card KPI Dashboard in Google Sheets
🌍 Join 8,400+ teams in 40+ countries using NextGenTemplates to replace paid SaaS tools with one-time-purchase Excel, Google Sheets, Power BI, and HTML templates.Credit Card KPI Dashboard in Google Sheets
✅ Instant download · One-time payment of $8.99 · No subscription · No per-user fees · Lifetime access
🔑 Key Features of the Credit Card KPI Dashboard in Google Sheets
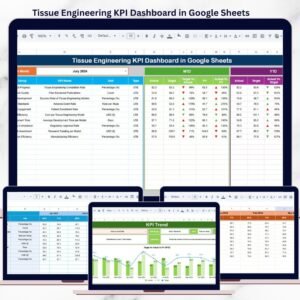
📊 6-sheet dashboard architecture – A main Dashboard sheet, a KPI Trend sheet with combo charts, three input sheets for Actual, Target and Previous Year numbers, and a KPI Definition reference sheet that drives all calculations.
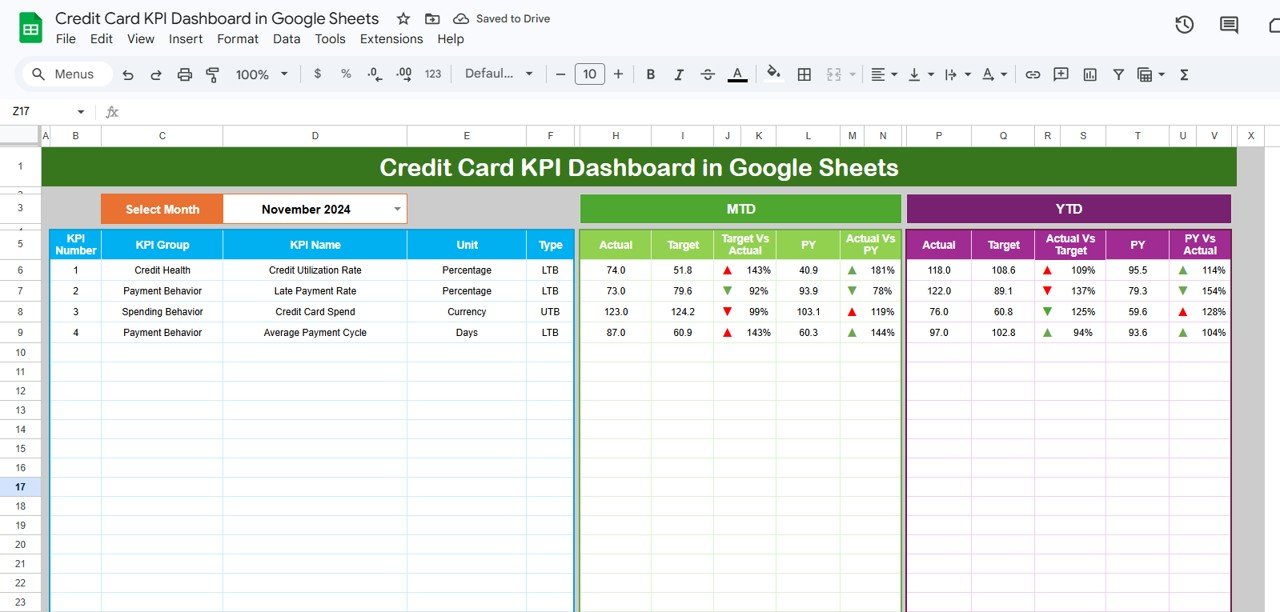
🎯 MTD and YTD comparison engine – Every credit card KPI shows Actual vs Target and Actual vs Previous Year for both month-to-date and year-to-date periods, giving finance teams a full picture in one view.
🟢🔴 Conditional formatting status arrows – Green ▲ and red ▼ arrows appear automatically next to each metric based on whether performance is above or below target — no manual formatting required.
📈 Interactive KPI trend charts – Select any KPI from the dropdown on the Trend sheet and instantly see 12-month MTD and YTD line charts plotting Actual, Target and Previous Year side by side.
🔄 Single-dropdown month filter – Change the month on cell D3 of the Dashboard sheet and all numbers, comparisons and arrows refresh across the entire workbook.
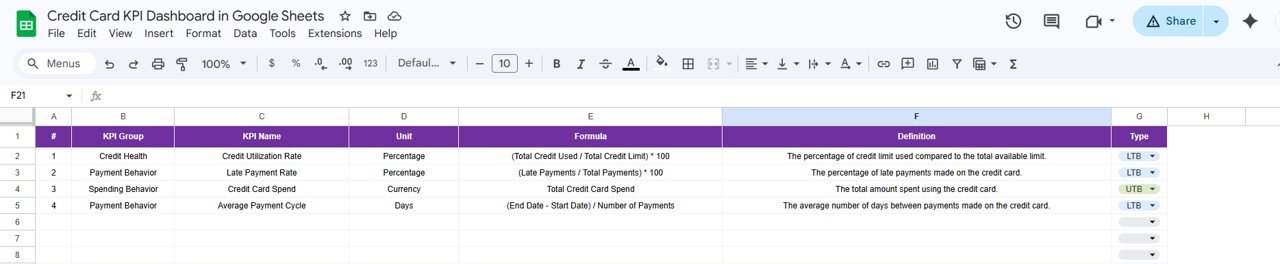
📋 Structured KPI definitions – Each metric includes its KPI Group, Unit, Formula, Definition and Type (LTB or UTB) so every team member interprets the numbers consistently.
If you manage credit card portfolios or oversee card-issuer operations, you may also want to explore our Expense Management KPI Dashboard in Google Sheets for a broader expense-tracking view.
📦 What’s Inside the Credit Card KPI Dashboard
The template contains 6 worksheets designed to cover every aspect of credit card KPI tracking:
📌 Dashboard Sheet – The main view. Select a month from the dropdown on D3 and the full KPI table updates with MTD Actual, Target, Previous Year data plus YTD Actual, Target, Previous Year data. Conditional formatting arrows show Target vs Actual and PY vs Actual performance at a glance.
Credit Card KPI Dashboard in Google Sheets
📌 KPI Trend Sheet – Pick any KPI from the dropdown on C3. The sheet displays the KPI Group, Unit, Type (LTB or UTB), Formula and Definition. Below that, MTD and YTD trend charts plot Actual, Target and Previous Year across all 12 months.
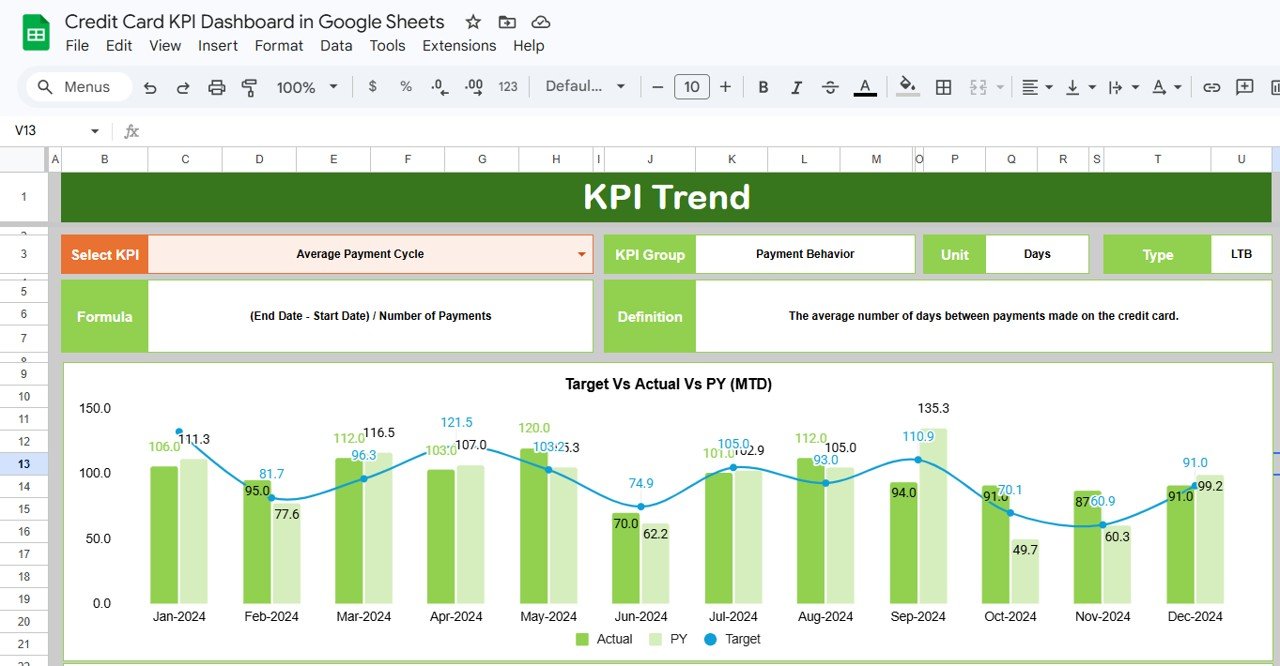
KPI Trend Sheet
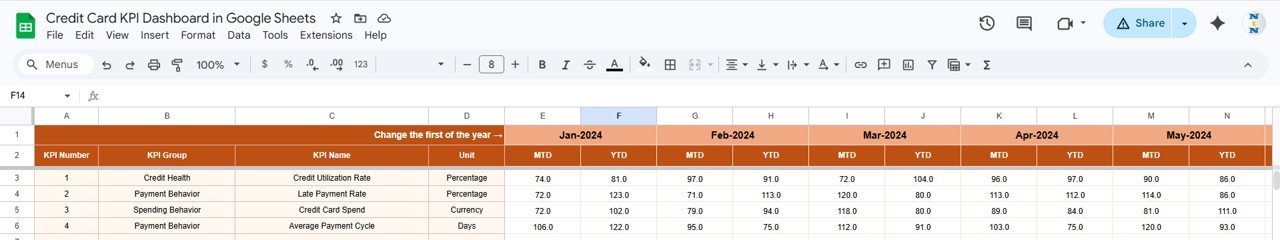
📌 Actual Numbers Input Sheet – Enter the actual MTD and YTD numbers for each KPI by month. Change the starting month on cell E1 to align with your fiscal year.
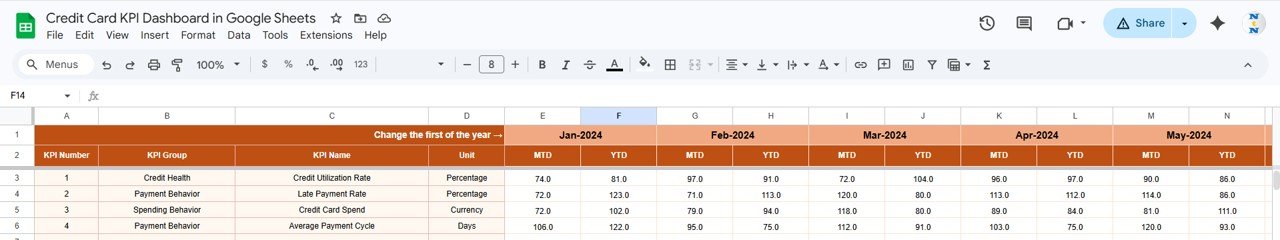
Actual Numbers Input Sheet
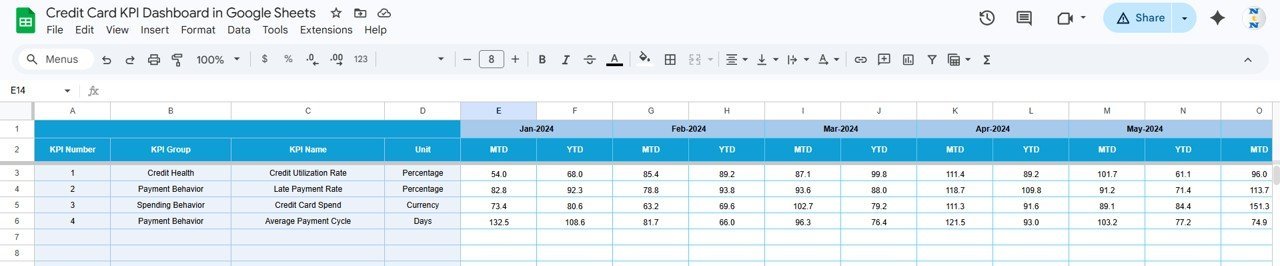
📌 Target Number Input Sheet – Enter monthly MTD and YTD targets for each KPI. The dashboard compares these against actual numbers automatically.

Target Number Input Sheet
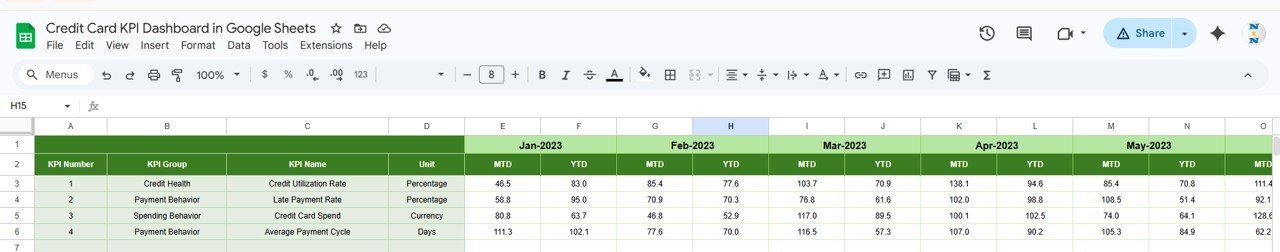
📌 Previous Year Number Sheet – Enter prior-year numbers in the same format as the current year so the dashboard can calculate year-over-year variance.

Previous Year Number Input Sheet
📌 KPI Definition Sheet – Enter KPI Name, KPI Group, Unit, Formula and Definition. In the last column, set each KPI type as LTB (Lower the Better) or UTB (Upper the Better) to control how conditional formatting arrows work.
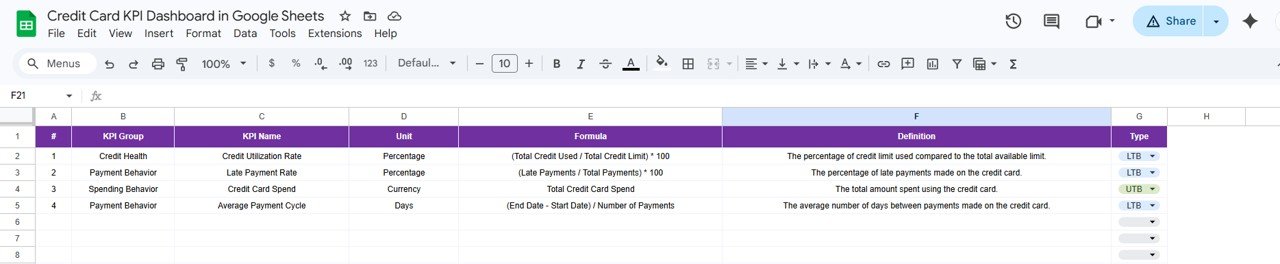
KPI Definition Sheet
Looking for a broader personal finance view? Check the Financial Transactions Dashboard in Google Sheets or the Net Worth Tracker in Google Sheets.
📊 Credit Card KPI Dashboard vs. Microsoft Excel Dashboard vs. Paid FinTech SaaS — Where This Fits
| Feature | Credit Card KPI Dashboard (Google Sheets) | Microsoft Excel Dashboard | Adaptive Insights / Mosaic |
|---|---|---|---|
| Cost | $8.99 one-time | $15-25 one-time + Excel license | $25-100/user/month |
| Platform | Google Sheets (browser-based) | Microsoft Excel (desktop) | Cloud SaaS |
| Setup Time | Under 10 minutes | 15-30 minutes | 2-4 weeks onboarding |
| Real-Time Collaboration | ✅ Built-in | Limited | ✅ Yes |
| Mobile Access | ✅ Google Sheets app | Limited | ✅ Yes |
| Customizable KPIs | ✅ Add/edit any KPI | ✅ (manual formulas) | ✅ (admin setup) |
| Share with Link | ✅ One-click share | ❌ Email attachment | ✅ Yes |
| Year-1 Cost at 5 Users | $8.99 total | $15-25 + 5× licenses | $1,500-6,000 |
| LTB/UTB Logic | ✅ Built-in per KPI | Manual IF formulas | ✅ Configurable |
For finance teams that want credit card KPI tracking without paying monthly SaaS fees, the Credit Card KPI Dashboard in Google Sheets sits in the sweet spot.
👥 Who This Template Is For — and Who It’s Not For
✅ This template is built for:
- Credit card portfolio managers at banks and NBFCs tracking card-level KPIs monthly
- Finance analysts monitoring credit card approval rates, delinquency rates and spend trends
- Small fintech teams that need a lightweight KPI tracker without enterprise SaaS costs
- Freelance financial consultants delivering monthly KPI reports to card-issuer clients
❌ This template is NOT for:
- Enterprise card issuers needing real-time API-connected dashboards with millions of transaction rows
- Teams requiring SOC 2 compliance and SSO-based access controls
- Organizations needing automated data ingestion from core banking systems
⚙️ How to Use the Credit Card KPI Dashboard in Google Sheets
- Open the PDF guide included in your download and click the Google Sheets copy link to create your own editable copy in Google Drive.
- Go to the KPI Definition sheet and enter your credit card KPI names, groups, units, formulas, definitions and LTB/UTB type.
- Fill the Actual Numbers Input sheet with your current-year MTD and YTD actual data for each KPI by month.
- Fill the Target Number Input sheet with MTD and YTD targets for each KPI.
- Fill the Previous Year Number sheet with prior-year data in the same format.
- Open the Dashboard sheet and select any month from the dropdown on D3.
- Use the KPI Trend sheet to select individual KPIs and review their 12-month trend charts.
💼 Real-World Use Cases
Ravi manages a credit card portfolio at a mid-size Indian bank. He uses the Credit Card KPI Dashboard in Google Sheets to track 15 KPIs including approval rate, delinquency rate, average transaction value and card activation rate — replacing a manual report that took half a day.
Lisa is a financial analyst at a US-based fintech startup. She uses the KPI Trend sheet to identify which metrics trend below target across quarters. The LTB/UTB logic means she never accidentally flags a declining cost-per-acquisition as a negative trend.
Omar runs a boutique consulting firm in Dubai. He delivers monthly credit card performance reports to three banking clients using view-only Google Sheets links. The $8.99 template replaced a $200/month reporting tool.
❓ Frequently Asked Questions
What KPIs does the Credit Card KPI Dashboard in Google Sheets track?
The dashboard tracks any credit card KPIs you define — approval rate, delinquency rate, average spend per card, activation rate, chargeback rate and more. Configure them in the KPI Definition sheet.
How long does it take to set up?
Under 10 minutes. Open the Google Sheets copy link, enter KPI definitions and paste your numbers. Everything updates automatically.
Can I add more KPIs?
Yes. Add new rows in the KPI Definition sheet and corresponding rows in the input sheets. Formulas extend automatically.
Does it work on mobile?
Yes. Google Sheets works on any device via the app or mobile browser.
How does this compare to Adaptive Insights?
Adaptive Insights costs $25-100/user/month with 2-4 weeks onboarding. This costs $8.99 one-time with 10-minute setup.
Can I customize conditional formatting?
Yes. Edit arrow symbols, colors and thresholds in standard Google Sheets format settings.
Is there an Excel or Power BI version?
NextGenTemplates offers KPI dashboards in Excel, Google Sheets, Power BI and HTML. Browse the Google Sheets KPI Dashboard collection.
👤 About the Author
Built by PK — Microsoft Certified Professional with 15+ years of Excel, Google Sheets, and Power BI experience. Founder of NextGenTemplates, reaching 300K+ subscribers across YouTube channels (@PK-AnExcelExpert, @NextGenTemplates, @NeoTechNavigators). Every template is hand-built and tested before release.
🔗 Explore Related Templates
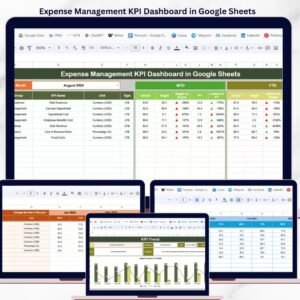
📌 Expense Management KPI Dashboard in Google Sheets – Track expense KPIs with the same MTD/YTD structure
📌 Financial Transactions Dashboard in Google Sheets – Analyze transaction-level financial data
📌 Debt Payoff Calculator in Google Sheets – Plan credit card and loan payoff schedules
📌 Net Worth Tracker in Google Sheets – Monitor assets, liabilities and net worth
📌 Browse all Google Sheets KPI Dashboard Templates
📖 Click here to read the Detailed Blog Post
🎥 Visit our YouTube channel for step-by-step video tutorials
👉 YouTube.com/@NextGenTemplates


Reviews
There are no reviews yet.