The Real Estate Property Tracker in Google Sheets monitors 5 portfolio KPIs across 7 interactive pages, with 14+ pre-built charts and slicer filters. Setup takes under 10 minutes — just replace the sample data and every chart, card, and calculation updates automatically.
🌍 Join 8,400+ teams in 40+ countries using NextGenTemplates to replace paid SaaS tools with one-time-purchase Excel, Google Sheets, Power BI, and HTML templates.
✅ Instant download · One-time payment · No subscription · No per-user fees · Lifetime access
🔑 Key Features of Real Estate Property Tracker in Google Sheets
This tracker consolidates property details, tenant records, income and expense tracking, maintenance logs, and an investment calculator into a single Google Sheets file with 7 dedicated pages. It tracks 5 KPIs — Total Properties, Portfolio Value, Monthly Rental Income, Occupancy Rate, and Average Property Value — displayed as cards on the Overview page.
📊 14+ Charts and Visualizations — Property Status Distribution by Status, Property Value by Type, Income vs Expenses by Property, Monthly Rental Income by Month, Current Value by Property, Monthly Rent by Property, Rental Income by Month, Mortgage Payment by Property, Operating Expenses by Property, Maintenance Cost by Month, Net Income by Property, and more.
🔍 Instant Property Search — Select any Property ID from a dropdown and view all details including Address, City, State, Type, Purchase Date, Purchase Price, Current Value, Monthly Rent, Tenant Name, Lease Start/End, and Status instantly.
💰 Built-In Investment Calculator — Enter Purchase Price, Closing Costs, Renovation Costs, Down Payment, Mortgage Rate, and Loan Term alongside Monthly Income and Expenses (Rental Income, Mortgage Payment, Insurance, Property Tax, Maintenance, Management Fee, Vacancy Reserve) to calculate ROI on any property.
🛠️ Maintenance Log Tracking — Record issues by category, track estimated vs actual costs by vendor, monitor priority levels and completion dates for every maintenance request across your portfolio.
👥 Tenant Management — Store lease periods, monthly rent, security deposits, payment status, and emergency contact details for every tenant linked to their property.
Browse more Google Sheets Dashboard Templates for other business needs.
📦 What’s Inside the Real Estate Property Tracker in Google Sheets
The tracker includes 7 pages designed for real estate investors, property managers, and landlords:
📌 Overview Page — 5 KPI cards (Total Properties, Portfolio Value, Monthly Rental Income, Occupancy Rate, Avg Property Value) plus 4 charts: Property Status Distribution by Status, Property Value by Type, Income vs Expenses by Property, and Monthly Rental Income by Month. Slicer filters let you slice the dashboard by any dimension.
📌 Properties Tracker — Property Details by Property ID, Current Value by Property, Monthly Rent by Property, Status by Property Type, Lease Period by Tenant, and Insurance and Property Tax by Property.
📌 Income and Expenses — Rental Income by Month, Mortgage Payment by Property, Operating Expenses by Property, Maintenance Cost by Month, and Net Income by Property.
📌 Maintenance Log — Maintenance Records by Property, Issue Description by Category, Estimated and Actual Cost by Vendor, Status by Priority, and Completion Date by Maintenance ID.
📌 Tenant Information — Tenant Details by Tenant ID, Lease Period by Tenant, Monthly Rent by Property, Security Deposit by Tenant, Payment Status by Tenant, and Emergency Contact by Tenant.
📌 Investment Calculator — Enter Investment Details such as Purchase Price, Closing Costs, Renovation Costs, Down Payment, Mortgage Rate and Loan Term, along with Monthly Income and Expenses including Rental Income, Mortgage Payment, Insurance, Property Tax, Maintenance, Management Fee, and Vacancy Reserve.
📌 Property Search — Use the Search by Property ID dropdown to instantly display Address, City, State, Type, Purchase Date, Purchase Price, Current Value, Monthly Rent, Tenant Name, Lease Start and End dates, and Status without scrolling through long lists.
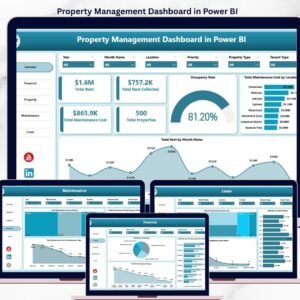
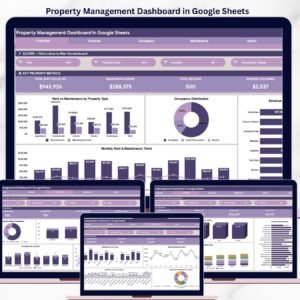
If you manage rental properties, also check out the Property Management Dashboard in Google Sheets and the Rental Property Investment Dashboard in Excel.
📊 Real Estate Property Tracker in Google Sheets vs. Excel Property Tracker vs. Wise Agent CRM — Where This Fits
| Feature | Real Estate Property Tracker (Google Sheets) | Excel-Based Property Tracker | Wise Agent CRM |
|---|---|---|---|
| Cost | $6.99 one-time | $15-30 one-time | $49/month per user |
| Platform | Google Sheets (browser-based) | Microsoft Excel (desktop) | Cloud SaaS |
| Setup Time | Under 10 minutes | 15-30 minutes | 1-3 hours onboarding |
| Real-Time Team Collaboration | ✅ Built-in (Google Sheets) | ❌ Requires OneDrive/SharePoint | ✅ Yes |
| Mobile Access | ✅ Google Sheets app | ❌ Limited on mobile | ✅ Mobile app |
| Customizable Fields | ✅ Fully editable | ✅ Fully editable | ⚠️ Limited to plan |
| Investment Calculator | ✅ Built-in | ⚠️ Build manually | ❌ Not included |
| Share with Link | ✅ One click | ❌ Requires file sharing | ✅ Yes |
| Year-1 Cost (5 Users) | $6.99 total | $15-30 total | $2,940/year |
For property managers who want portfolio-level tracking, tenant management, and investment calculations without paying $49/month per user, the Real Estate Property Tracker in Google Sheets sits in the sweet spot.
👥 Who This Template Is For — and Who It’s Not For
✅ This template is built for:
- Independent landlords managing 1-50 rental properties who need a single view of their portfolio
- Property managers at small to mid-size firms who track tenants, maintenance, and finances in spreadsheets
- Real estate investors who want an investment calculator and income vs expenses breakdown per property
- Teams that already use Google Workspace and want instant collaboration on property data
❌ This template is NOT for:
- Enterprise property management companies with 500+ units needing API integrations with accounting software
- Real estate agents focused on lead generation and CRM — check out a dedicated Property Management Dashboard in HTML instead
- Teams requiring automated rent payment processing or tenant portal access
⚙️ How to Use the Real Estate Property Tracker in Google Sheets
- Open the Google Sheets Link — Click the copy link from the PDF guide in your download to create your own editable copy in Google Drive.
- Replace Sample Data — Go to each sheet tab and replace the sample property, tenant, income, expense, and maintenance data with your own records.
- Review the Overview Dashboard — All 5 KPI cards and 4 charts update automatically once your data is entered.
- Use Slicer Filters — Apply slicers on the Overview page to filter the dashboard by property type, status, or any other dimension.
- Track Maintenance — Log maintenance requests in the Maintenance Log sheet with category, vendor, cost estimates, priority, and status.
- Calculate Investment Returns — Enter purchase details and monthly income/expenses in the Investment Calculator to evaluate ROI on any property.
- Search Properties Instantly — Use the Property Search page to select any Property ID and view all details in one place.
💼 Real-World Use Cases
Raj manages 12 rental apartments in Bangalore. He uses the Real Estate Property Tracker in Google Sheets to monitor monthly rent collection from each tenant, track maintenance requests from plumbers and electricians by vendor cost, and calculate whether a new property purchase fits his budget using the Investment Calculator — all without paying for property management software.
Lisa owns 6 vacation rental properties across Texas. She shares the tracker with her property manager via Google Sheets so both can update tenant lease dates, track occupancy rates in real time, and review income vs expenses per property each quarter before tax filing.
A small real estate firm with 3 agents uses the tracker to maintain a centralized portfolio of 35 client-owned properties. The Property Search page lets any agent pull up a property’s full details — address, tenant, rent, lease dates, and status — in seconds during client calls.
❓ Frequently Asked Questions
What KPIs does the Real Estate Property Tracker in Google Sheets track?
The Real Estate Property Tracker in Google Sheets tracks 5 key performance indicators: Total Properties, Portfolio Value, Monthly Rental Income, Occupancy Rate, and Average Property Value. All KPIs update automatically when you replace sample data with your own property records.
How long does it take to set up this property tracker?
Setup takes under 10 minutes. Open the Google Sheets copy link, replace the sample data in each sheet tab with your property, tenant, and financial records, and the Overview dashboard with all charts and KPI cards updates instantly.
Can multiple team members edit the tracker at the same time?
Yes. Since this runs in Google Sheets, multiple users can view and edit the tracker simultaneously in real time. You can share access via a link and control edit permissions directly from Google Drive.
How does this compare to Wise Agent or Placester?
The Real Estate Property Tracker costs $6.99 one-time with no subscription fees. Wise Agent charges $49/month per user, and Placester starts at $99/month. This tracker gives you portfolio-level tracking, tenant management, and an investment calculator without recurring costs.
Does it include an investment calculator?
Yes. The Investment Calculator page lets you enter Purchase Price, Closing Costs, Down Payment, Mortgage Rate, Loan Term, and all monthly income and expenses (Rental Income, Insurance, Property Tax, Maintenance, Management Fee, Vacancy Reserve) to calculate property ROI.
Can I track maintenance requests and vendor costs?
Yes. The Maintenance Log page tracks every maintenance record by property, issue category, vendor, estimated vs actual cost, priority level, status, and completion date. You can monitor all open and closed requests across your entire portfolio.
Is this compatible with Google Sheets on mobile?
Yes. The tracker works in the Google Sheets mobile app on both Android and iOS. You can view KPI cards, search properties, and update data on the go from any device with internet access.
👤 About the Author
Built by PK — Microsoft Certified Professional with 15+ years of Excel, Google Sheets, and Power BI experience. Founder of NextGenTemplates, reaching 300K+ subscribers across YouTube channels (@PK-AnExcelExpert, @NextGenTemplates, @NeoTechNavigators). Every template is hand-built and tested before release.
🔗 Explore Related Templates
📌 Property Management Dashboard in Google Sheets — A full dashboard for managing properties with advanced analytics and reporting.
📌 Rental Property Investment Dashboard in Excel — Track rental income, expenses, and ROI for your investment properties in Excel.
📌 Airbnb Host Dashboard in HTML — Monitor your short-term rental performance with an interactive HTML dashboard.
📌 Property Management Dashboard in HTML — A premium SaaS-style property management dashboard for your browser.
📖 Click here to read the Detailed Blog Post
Watch the step-by-step video tutorial:
🎥 Visit our YouTube channel for step-by-step video tutorials
👉 YouTube.com/@NextGenTemplates


Reviews
There are no reviews yet.