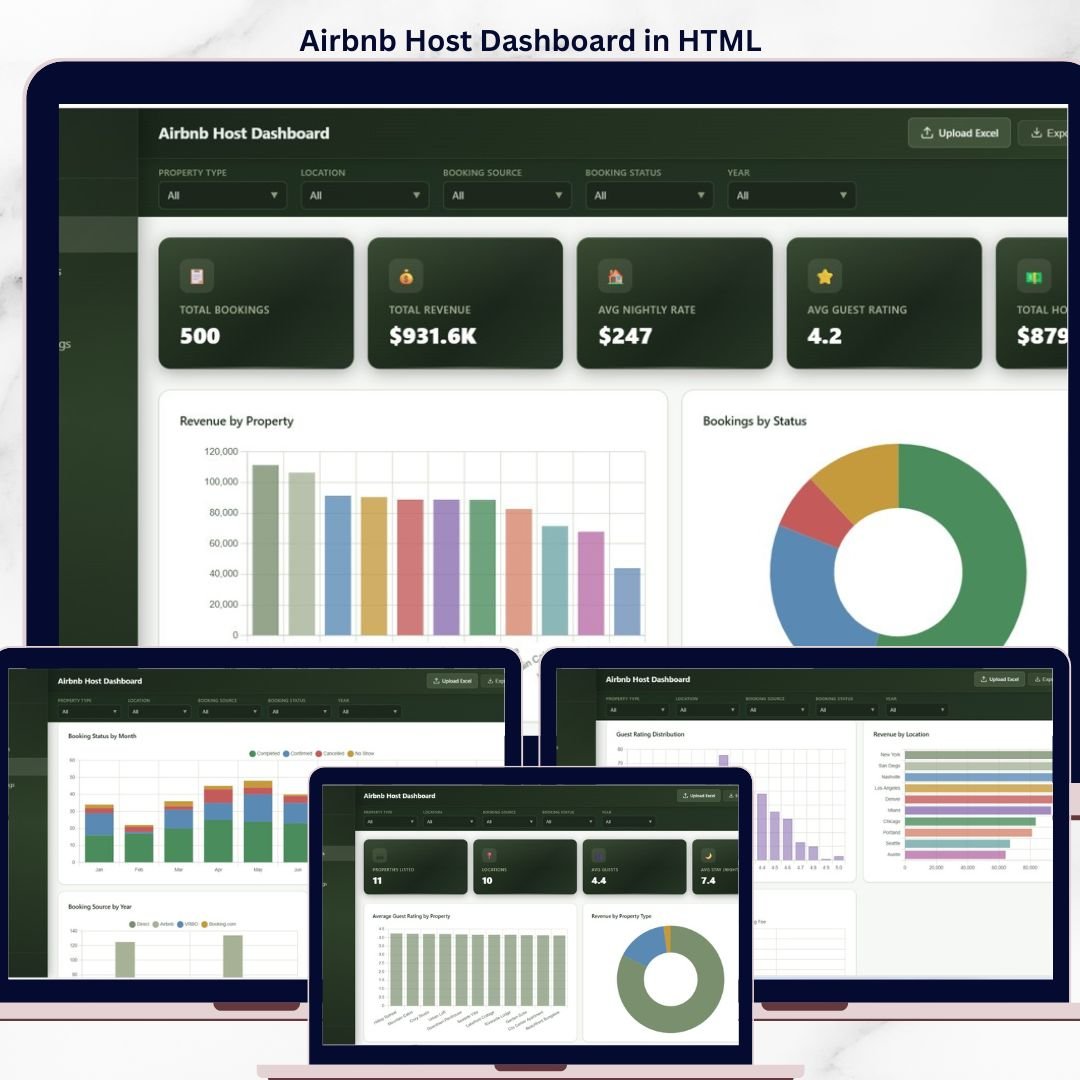
Airbnb Host Dashboard in HTML tracks 5 host KPIs across 5 interactive browser-based pages, with 14 pre-built charts and dynamic filters covering bookings, revenue, host payout, nightly rates, and guest ratings. Setup takes under 5 minutes — unzip, open index.html in any browser, and the dashboard loads instantly with no Excel, Power BI, or Google Sheets required.
🌍 Join 8,400+ teams in 40+ countries using NextGenTemplates to replace paid SaaS tools with one-time-purchase Excel, Google Sheets, Power BI, and HTML templates.
✅ Instant download · One-time payment · No subscription · No per-user fees · Lifetime access
Airbnb Host Dashboard Overview
🔑 Key Features of Airbnb Host Dashboard in HTML
🏠 5 Interactive Browser-Based Pages — The Airbnb Host Dashboard in HTML ships with 5 dedicated tabs: Overview, Property Analysis, Booking Trends, Revenue and Ratings, and Data View. Every page runs locally in any modern browser (Chrome, Edge, Firefox, Safari) — no software install, no cloud subscription, no internet connection required after download.
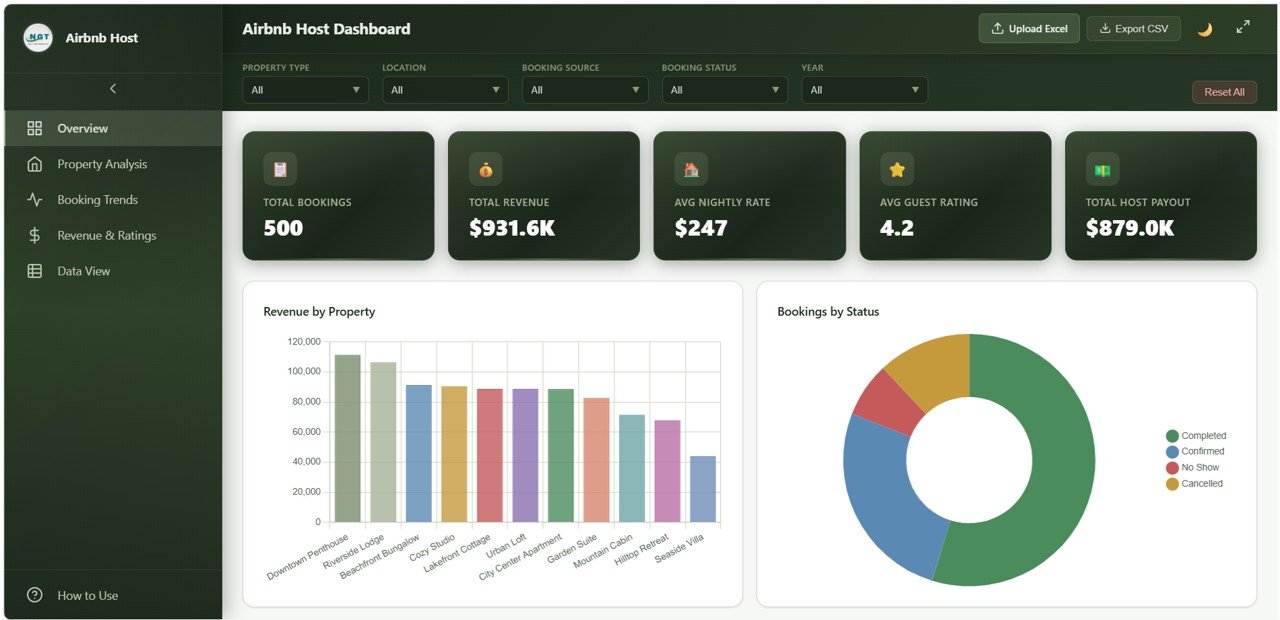
💰 5 KPI Cards on the Overview Page — The Overview tracks Total Bookings, Total Revenue, Average Nightly Rate, Average Guest Rating, and Total Host Payout in always-visible KPI cards that recalculate the moment you apply a filter. This is the same metric set hosts pay $20-$50 per month for inside AirDNA, Beyond, or PriceLabs.
📊 14 Charts Across 4 Analytical Tabs — The dashboard renders 14 charts grouped by analysis purpose: 5 on Overview, 4 on Property Analysis, 4 on Booking Trends, and 5 on Revenue and Ratings. Each chart responds to the global slicer panel, so you can filter by property, location, source, or month and every visual updates in real time.
🔍 Searchable, Sortable Data View with CSV Export — The Data View tab shows every booking record with column-level search, multi-column sort, pagination, and a one-click CSV export of the filtered view. Useful for quarterly reporting, accountant handoffs, and importing into your own analytics stack.
🎨 Self-Contained Single-File Setup — Everything ships in one folder: index.html, the data file, and lightweight JS/CSS. No CDN dependencies, no broken links over time, no NPM install. Edit the data file in any text editor or Excel and the dashboard reflects changes on the next refresh.
📦 What’s Inside the Airbnb Host Dashboard in HTML
Page 1 — Overview
The landing tab carries 5 KPI cards (Total Bookings, Total Revenue, Average Nightly Rate, Average Guest Rating, Total Host Payout) and 5 charts: Revenue by Property, Bookings by Status, Revenue by Month, Bookings by Location, and Bookings by Source. A global slicer panel lets you instantly filter the entire dashboard by property, date range, source, or status.
Airbnb Host Dashboard Overview
Page 2 — Property Analysis
Property Analysis isolates per-property performance with 4 visuals: Average Guest Rating by Property, Revenue by Property Type, Bookings by Property, and Average Stay Duration by Location. Use this tab to spot which listings drive the most income, which property types convert best, and where average stays are longest.
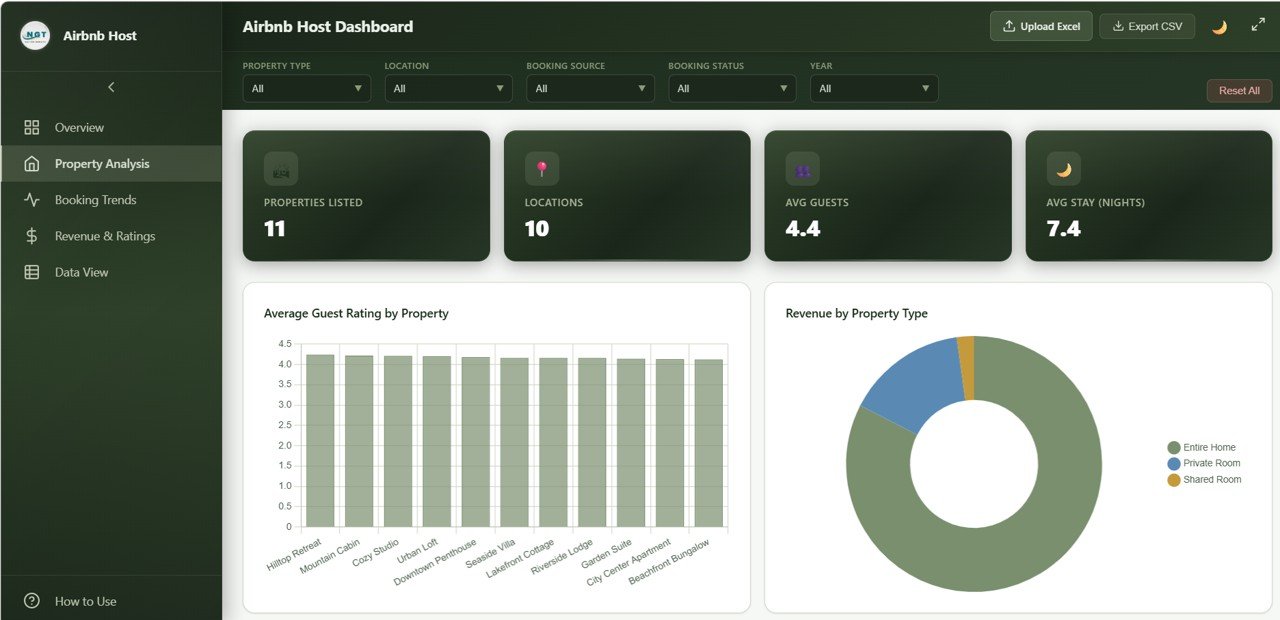
Property Analysis
Page 3 — Booking Trends
The Booking Trends tab visualizes seasonality and channel performance with Bookings by Month, Booking Status by Month, Booking Source by Year, and Cancellation Rate by Property. This is the page that flags which months you’re losing inventory to cancellations and which booking sources (Airbnb, Vrbo, direct) deliver the most reliable guests.
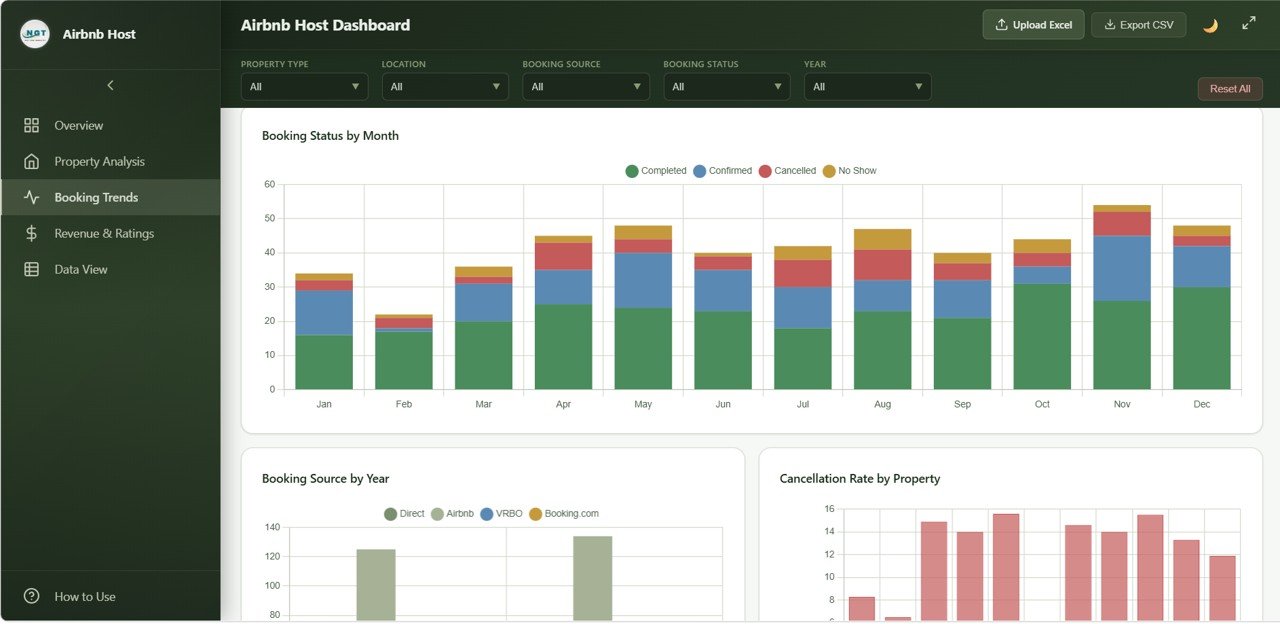
Booking Trends
Page 4 — Revenue and Ratings
This tab cross-references financial performance with guest sentiment using Host Payout by Month, Average Nightly Rate by Property, Guest Rating Distribution, Revenue by Location, and Service Fee vs Cleaning Fee by Property Type. Hosts use it to validate pricing decisions, monitor cleaning-fee competitiveness, and track payout consistency over time.
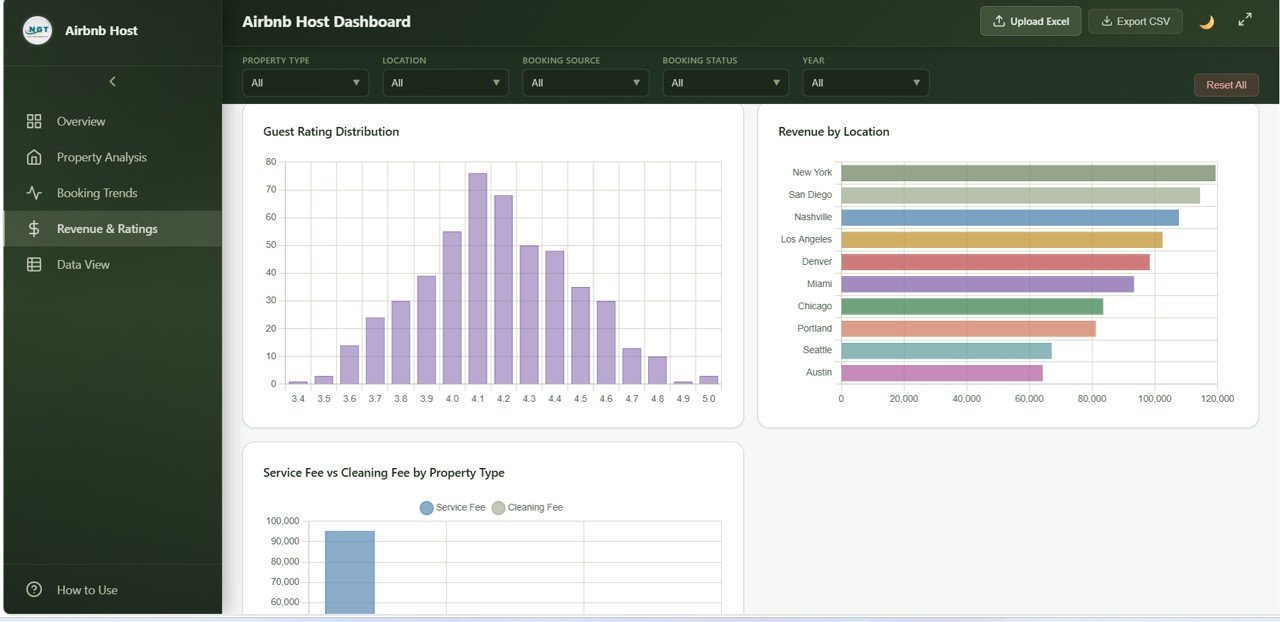
Revenue and Ratings
Page 5 — Data View
The Data View tab is the underlying record-level table. It supports column search, multi-column sort, pagination, and CSV export of the filtered view. Useful for monthly reconciliations, accountant handoffs, and pulling any subset of bookings into your own analytics workflow.
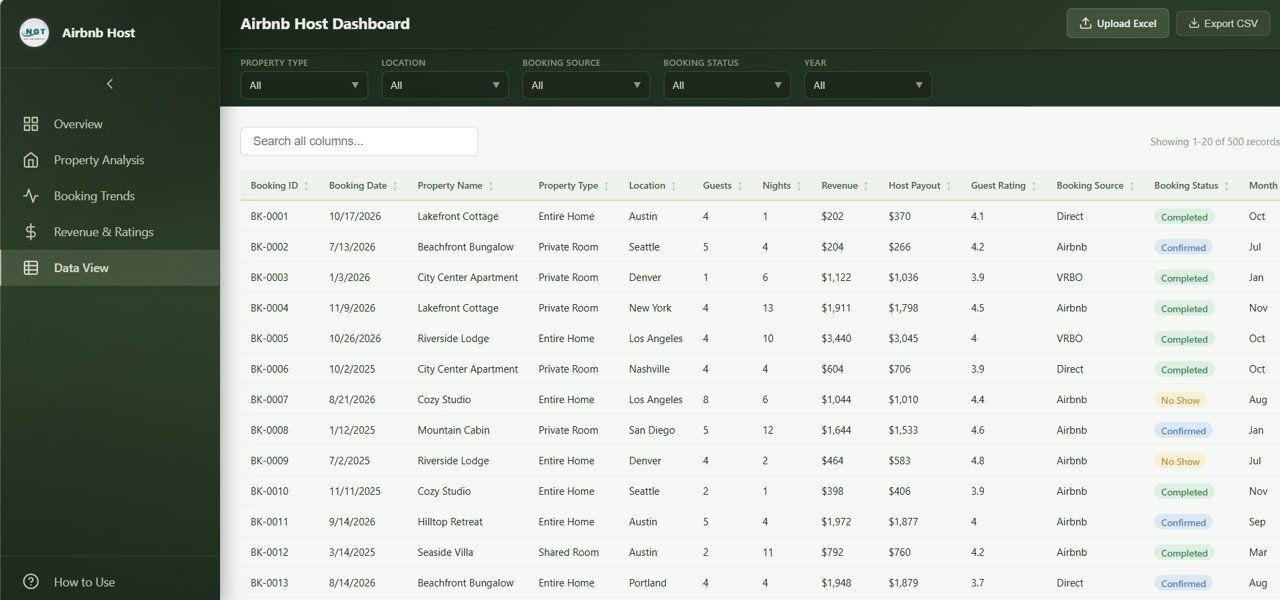
Data View tab
📊 Airbnb Host Dashboard in HTML vs. Standalone SaaS Dashboard vs. AirDNA / PriceLabs — Where This Fits
| Feature | Airbnb Host Dashboard in HTML | Standalone SaaS Dashboard | AirDNA / PriceLabs |
|---|---|---|---|
| Cost | $12.99 one-time | $15-40 / month | $20-99 / month per listing |
| Platform | Browser (HTML/JS/CSS) | Web SaaS (vendor cloud) | Web SaaS (vendor cloud) |
| Setup time | Under 5 minutes | 15-30 minutes (signup, OAuth) | 30-60 minutes (PMS integration) |
| Works offline | ✅ Yes | ❌ No | ❌ No |
| Data stays local | ✅ Yes — your machine only | ❌ Stored on vendor servers | ❌ Stored on vendor servers |
| Custom branding / colors | ✅ Edit CSS directly | Limited (paid tier) | Locked vendor design |
| CSV export of filtered view | ✅ | Often paid add-on | Limited rows on lower tiers |
| Year-1 cost at 5 listings | $12.99 (one-time) | $180-480 / year | $1,200-5,940 / year |
| Vendor lock-in | None — you own the files | High | High |
For hosts who want a clean, branded analytics view without paying $1,000+ per year to AirDNA or PriceLabs, the Airbnb Host Dashboard in HTML sits in the sweet spot — own the file, own the data, customize the UI.
👥 Who This Template Is For — and Who It’s Not For
✅ This template is built for:
- Independent Airbnb hosts managing 1-25 short-term rental properties
- Small property management firms tracking 5-50 listings across multiple owners
- Vacation rental operators on Vrbo, Booking.com, or direct-booking sites who want a unified analytics view
- Hosts who refuse to pay $20-99/month per listing for AirDNA or PriceLabs analytics
- Real estate investors evaluating short-term rental performance before scaling
❌ This template is NOT for:
- Enterprise property managers running 200+ listings needing live API sync from Guesty or Hostfully
- Hosts who need real-time dynamic pricing recommendations (use PriceLabs or Wheelhouse)
- Teams needing multi-user concurrent editing with role-based access (this is a single-file local dashboard)
- Anyone who wants automated nightly rate scraping from competitor listings
⚙️ How to Use the Airbnb Host Dashboard in HTML
- Download and unzip the file. You’ll get an
index.htmlfile plus a data file and supporting CSS/JS. - Open
index.htmlin any modern browser (Chrome, Edge, Firefox, Safari). The dashboard loads instantly with the included sample data. - Open the data file in any text editor or Excel. Replace the sample bookings with your own Airbnb export — keep the column headers exactly as shown.
- Refresh the browser tab. Every KPI, chart, and slicer recalculates automatically against your data.
- Use the global slicers to filter by property, location, source, or month. Use the Data View tab to search, sort, and export the filtered records to CSV.
💼 Real-World Use Cases
Marcus runs 4 Airbnb cabins in the Smoky Mountains. He uses the Airbnb Host Dashboard in HTML every Sunday night to compare weekly bookings, average nightly rate, and guest ratings across all 4 properties — without paying $80/month per listing for AirDNA. The Property Analysis tab tells him which cabin needs a price adjustment before the next weekend.
Priya manages 18 short-term rentals for absentee owners in Goa and Lisbon. She sends each owner a monthly PDF screenshot of the Property Analysis and Revenue and Ratings tabs filtered to their property. The CSV export from the Data View tab feeds straight into her quarterly owner statements.
James and Sarah are evaluating whether to convert their 3-unit duplex into short-term rentals. They loaded 12 months of comparable Airbnb data into the Airbnb Host Dashboard in HTML to validate seasonality, average occupancy, and revenue per location before signing a $400K renovation contract.
❓ Frequently Asked Questions
What KPIs does the Airbnb Host Dashboard in HTML track?
The Airbnb Host Dashboard in HTML tracks 5 primary KPIs on the Overview page: Total Bookings, Total Revenue, Average Nightly Rate, Average Guest Rating, and Total Host Payout. An additional 14 charts across 4 analytical tabs break these down by property, location, source, month, and rating distribution.
Do I need to install software to run this dashboard?
No. The Airbnb Host Dashboard in HTML runs entirely in your web browser — Chrome, Edge, Firefox, or Safari. There’s no Excel, Power BI Desktop, Google Sheets, or any other software requirement. Just unzip and open index.html.
How long does setup take?
Setup takes under 5 minutes. Unzip the download, open index.html in your browser, and the dashboard loads with sample data. Replace the sample data file with your own Airbnb export and refresh the page — every chart and KPI recalculates instantly.
How does this compare to AirDNA or PriceLabs?
The Airbnb Host Dashboard in HTML is a one-time $12.99 purchase that runs locally on your machine. AirDNA starts at $20 per listing per month and PriceLabs at $19.99 per listing per month — both store your data on their servers. This template gives you the same core analytics for less than the cost of one month of AirDNA on a single property.
Can I customize the colors, layout, or add my own logo?
Yes. The Airbnb Host Dashboard in HTML ships as plain HTML, CSS, and JavaScript. Open the CSS file in any text editor to change colors, fonts, or layout, and drop your logo into the header. No build tools required.
Does the dashboard work with Vrbo, Booking.com, or direct-booking data?
Yes. The data file uses generic columns (property, location, source, dates, revenue, rating) so any platform’s exported data can be reformatted into it. The Bookings by Source chart is built specifically to compare channel performance across Airbnb, Vrbo, Booking.com, and direct bookings.
Can I export filtered data?
Yes. The Data View tab includes a one-click CSV export of whatever subset of records you’ve filtered to. Useful for monthly accountant handoffs, owner statements, or importing into your own BI tool.
👤 About the Author
Built by PK — Microsoft Certified Professional with 15+ years of Excel, Google Sheets, Power BI, and HTML dashboard experience. Founder of NextGenTemplates, reaching 300K+ subscribers across YouTube channels (@PK-AnExcelExpert, @NextGenTemplates, @NeoTechNavigators). Every template is hand-built, browser-tested, and reviewed before release.
🔗 Explore Related Templates
📌 Airbnb Host Dashboard in Excel — Same Airbnb host metrics built on Microsoft Excel with native pivot tables and slicers.
📌 Airbnb Host Dashboard in Power BI — DAX-powered Power BI version for hosts who already work inside the Microsoft BI stack.
📌 Airbnb Host Dashboard in Google Sheets — Cloud-based Google Sheets version for hosts who manage rentals from anywhere.
📌 Hospitality Dashboard in HTML — Broader hotel and hospitality KPIs in the same browser-based HTML format.
📌 Rental Property Investment Dashboard in HTML — Long-term rental and investment-property analytics in HTML.
📂 Browse more HTML Dashboard Templates or explore the full Dashboard Templates collection.
📖 Click here to read the Detailed Blog Post
🎥 Visit our YouTube channel for step-by-step video tutorials
👉 YouTube.com/@NextGenTemplates
📅 Last updated: April 2026


Reviews
There are no reviews yet.