

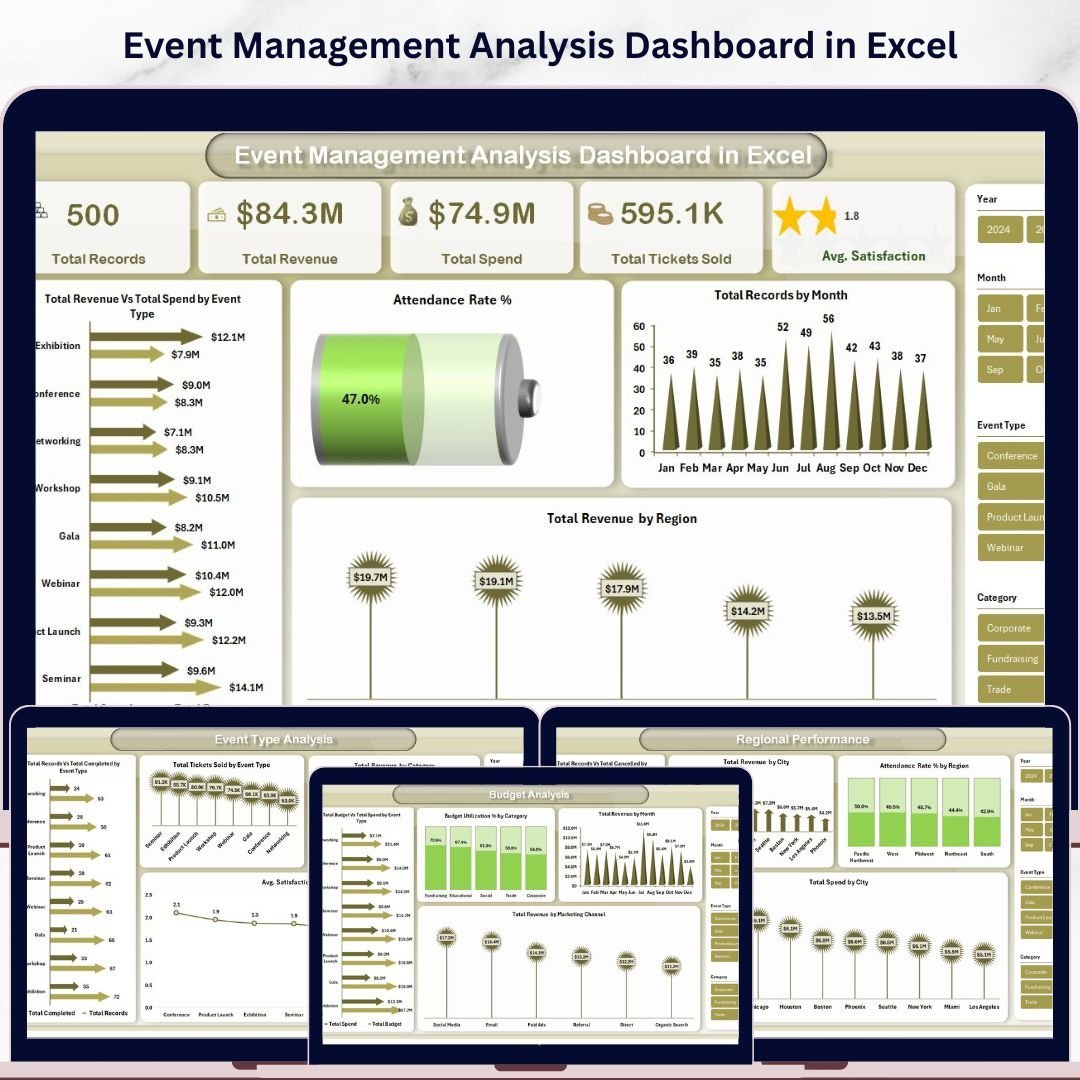


Event Management Analysis Dashboard in Excel is a professionally designed, ready-to-use interactive Excel dashboard built for event planners, coordinators, marketing teams, and corporate professionals who need to track, analyze, and optimize event performance using Microsoft Excel. Whether you manage conferences, workshops, trade shows, fundraisers, or corporate retreats, this Excel Dashboard Template consolidates all your critical event data into one dynamic, visually stunning reporting tool — no VBA or advanced skills needed.
Managing events involves tracking dozens of metrics including total revenue, total spend, ticket sales, attendance rates, satisfaction scores, budget utilization, and regional performance. Without a centralized reporting tool, event managers often struggle to understand which event types generate the highest ROI, which regions outperform others, and how budget allocations compare to actual spending. The Event Management Analysis Dashboard in Excel solves this challenge by providing 5 interactive dashboard pages with dynamic charts, KPI cards, slicers, and a searchable data view — all powered by Excel pivot tables that auto-refresh when you update your data.
This dashboard includes 5 interactive analysis pages covering Overview, Event Type Analysis, Regional Performance, Budget Analysis, and Attendance Insights. Each page delivers focused insights using dynamic visuals, KPI summary cards, and slicer controls that allow you to filter data instantly by event type, region, category, venue, and more. Simply open the Excel file, replace the sample data with your own, and start analyzing immediately. If you are planning weddings or need a budget-specific tool, check out the Wedding Budget Dashboard in Excel. For project-based tracking, explore the Property Management Dashboard in Excel.
🔑 Key Features of Event Management Analysis Dashboard in Excel
📌 5 Interactive Dashboard Pages — Overview, Event Type Analysis, Regional Performance, Budget Analysis, and Attendance Insights deliver comprehensive event reporting from every angle.
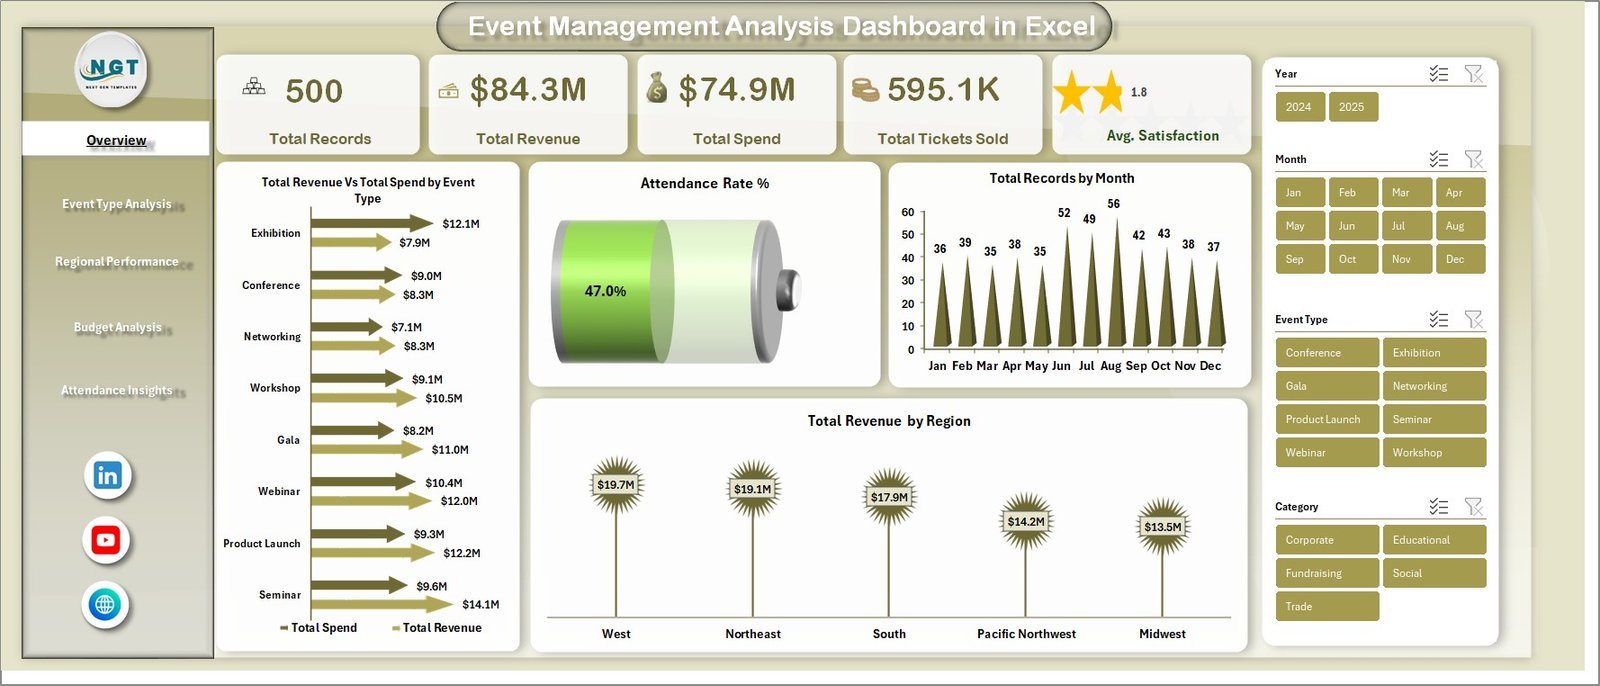
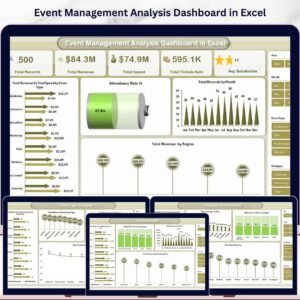
📌 5 High-Level KPI Summary Cards — Track Total Records, Total Revenue, Total Spend, Total Tickets Sold, and Average Satisfaction at a glance on the Overview page.
📌 Dynamic Slicer Controls — Filter the entire dashboard instantly by event type, region, category, status, venue, and marketing channel using built-in Excel slicers.
📌 Revenue vs Spend Comparison — Visualize Total Revenue versus Total Spend by Event Type to identify the most profitable event categories instantly.
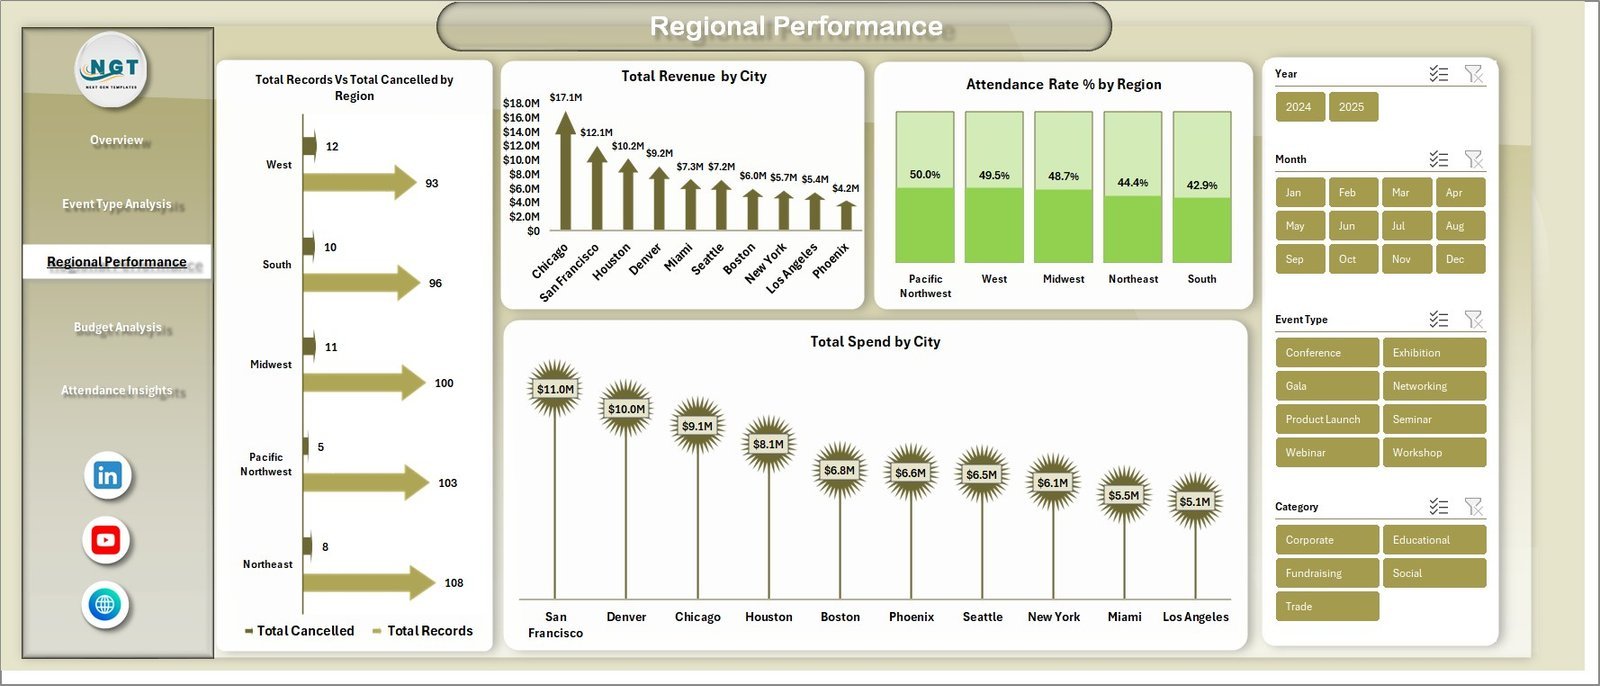
📌 Regional Performance Tracking — Analyze Total Revenue by City, Attendance Rate by Region, and Total Spend by City to understand geographic performance patterns.
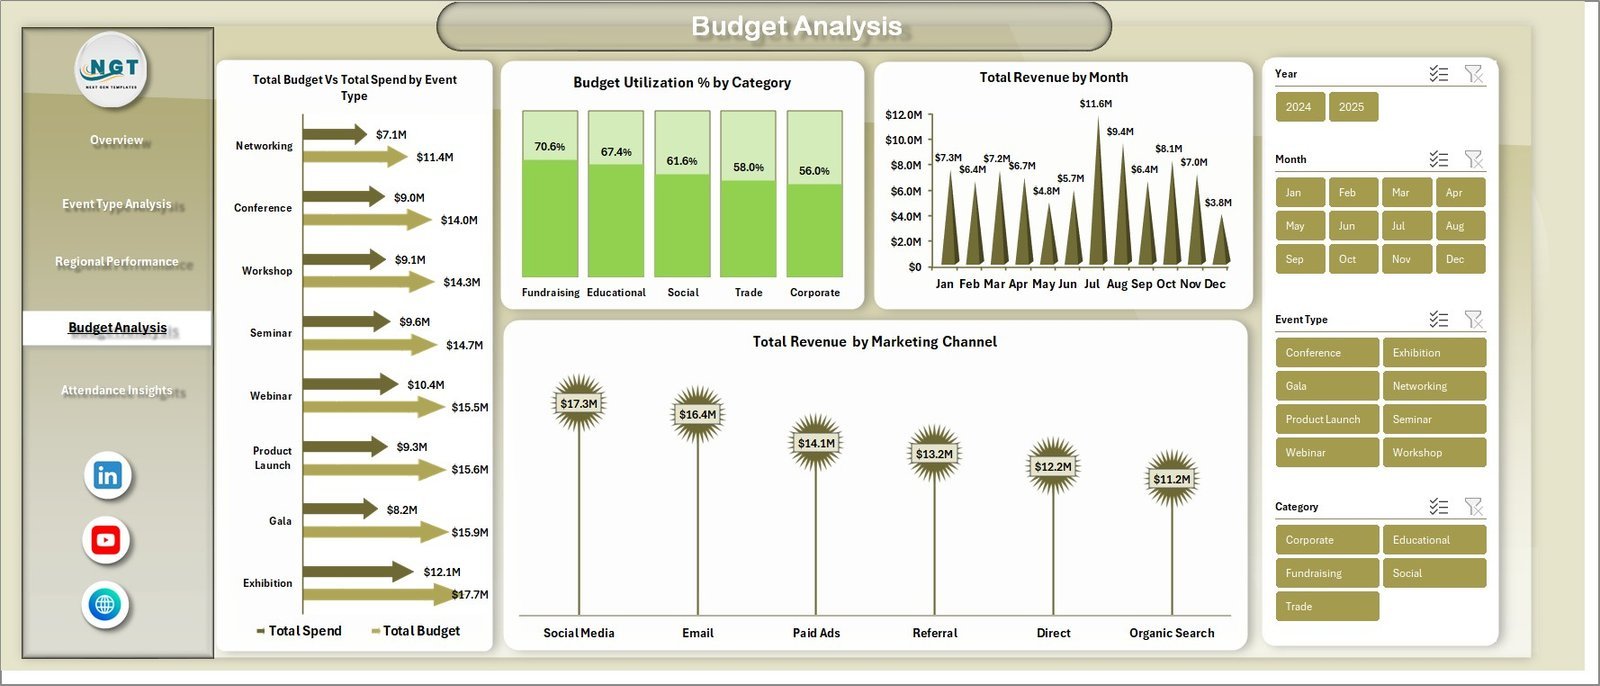
📌 Budget Utilization Analysis — Compare Total Budget vs Total Spend by Event Type, track Budget Utilization Percentage by Category, and monitor Revenue by Marketing Channel.
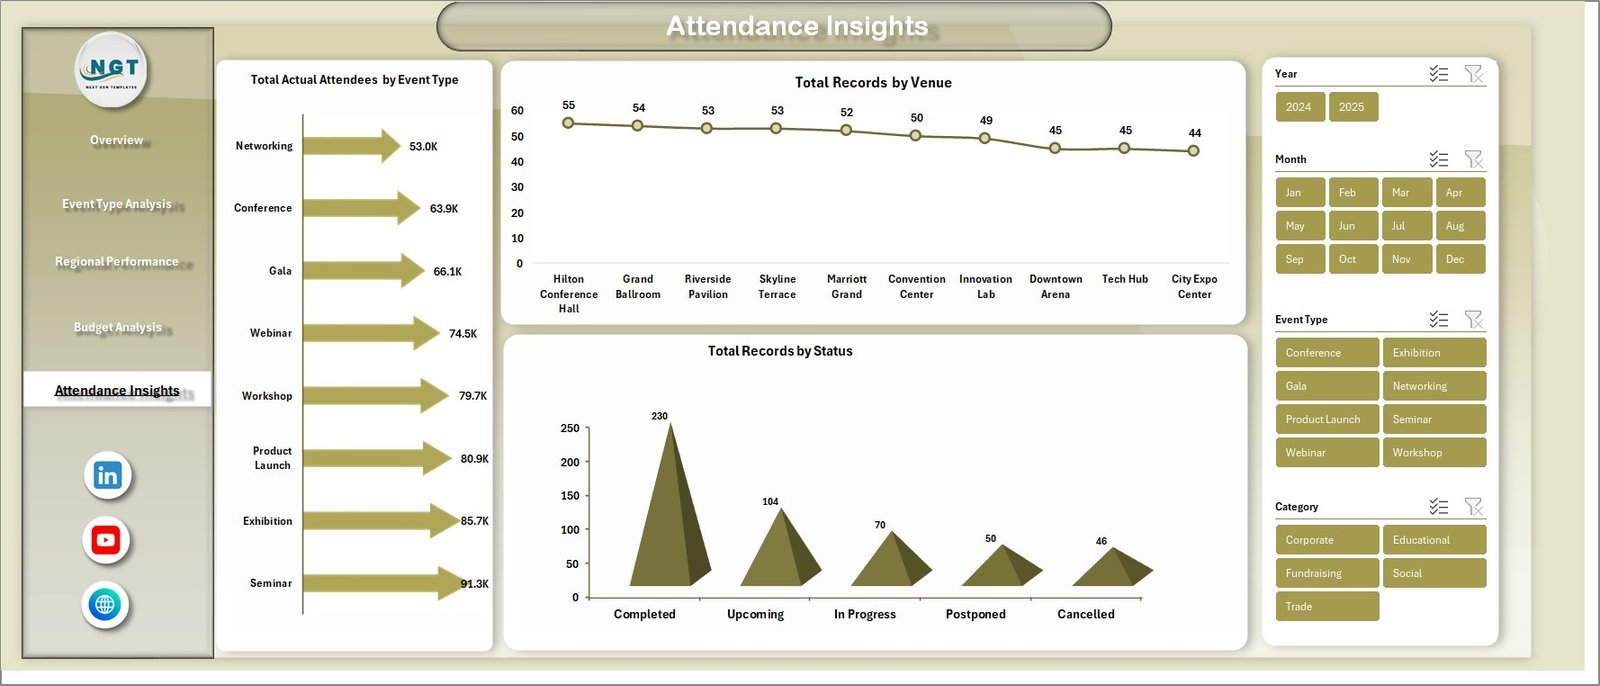
📌 Attendance Insights — Track Total Actual Attendees by Event Type, Total Records by Venue, and Total Records by Status for complete attendance visibility.
📌 Pivot Table Powered — All charts and KPIs are powered by pivot tables in a dedicated Support sheet. Simply refresh all pivots after updating data and everything updates automatically.
📌 Print-Ready Professional Design — Clean layout with consistent color themes, clear labels, and organized sections ready for executive presentations and stakeholder meetings.
📌 No VBA or Macros Required — Pure Excel formulas and pivot tables make this dashboard lightweight, safe, and compatible with all Excel versions including Microsoft 365.
📦 What’s Inside the Event Management Analysis Dashboard in Excel
📊 Overview Page — The main summary page displays 5 KPI cards (Total Records, Total Revenue, Total Spend, Total Tickets Sold, Avg. Satisfaction) along with charts showing Total Revenue Vs Total Spend by Event Type, Attendance Rate %, Total Records by Month, and Total Revenue by Region. Multiple slicers let you apply filters and see the filtered dashboard quickly.
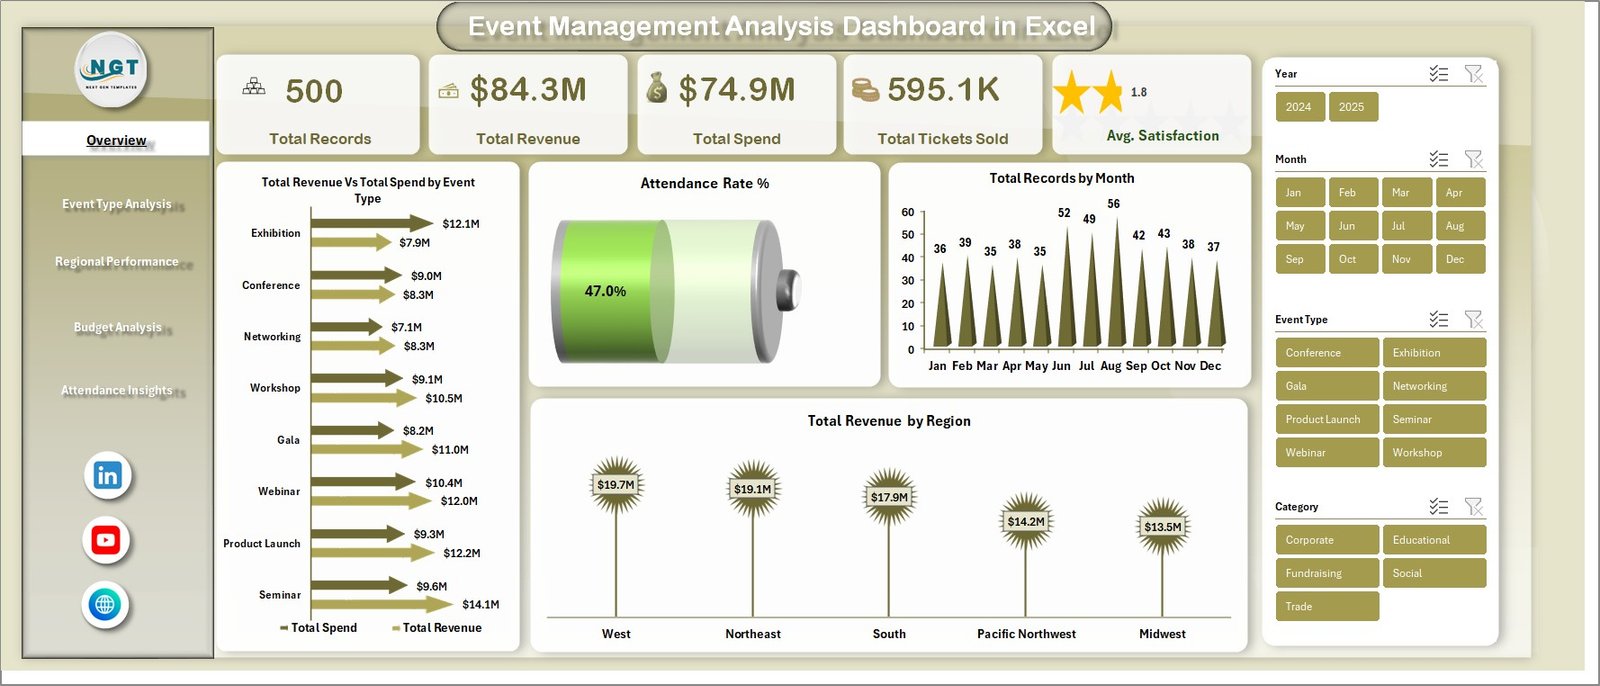 Event Management Analysis Dashboard in Excel
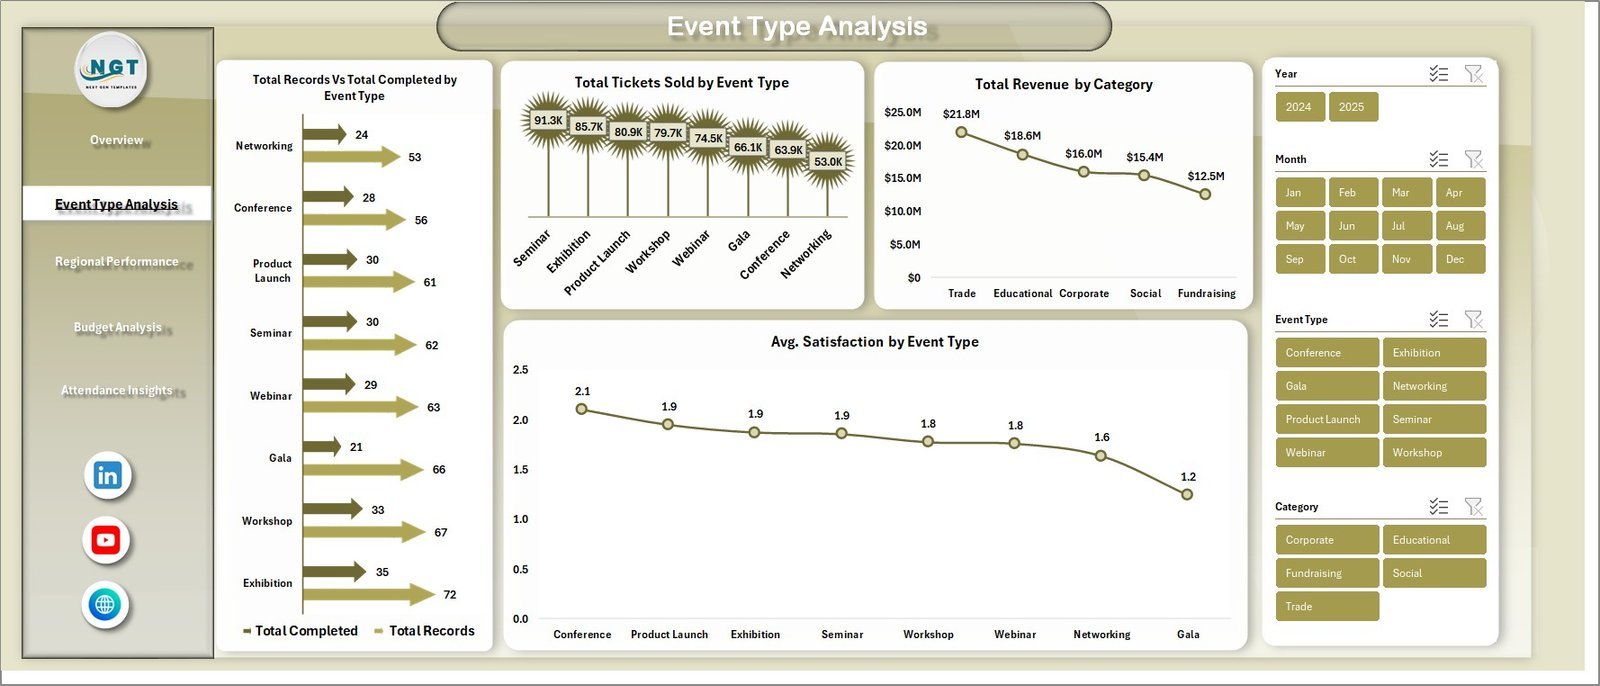
📊 Event Type Analysis Page — Breaks down performance by event category with charts for Total Records Vs Total Completed by Event Type, Total Tickets Sold by Event Type, Total Revenue by Category, and Avg. Satisfaction by Event Type.
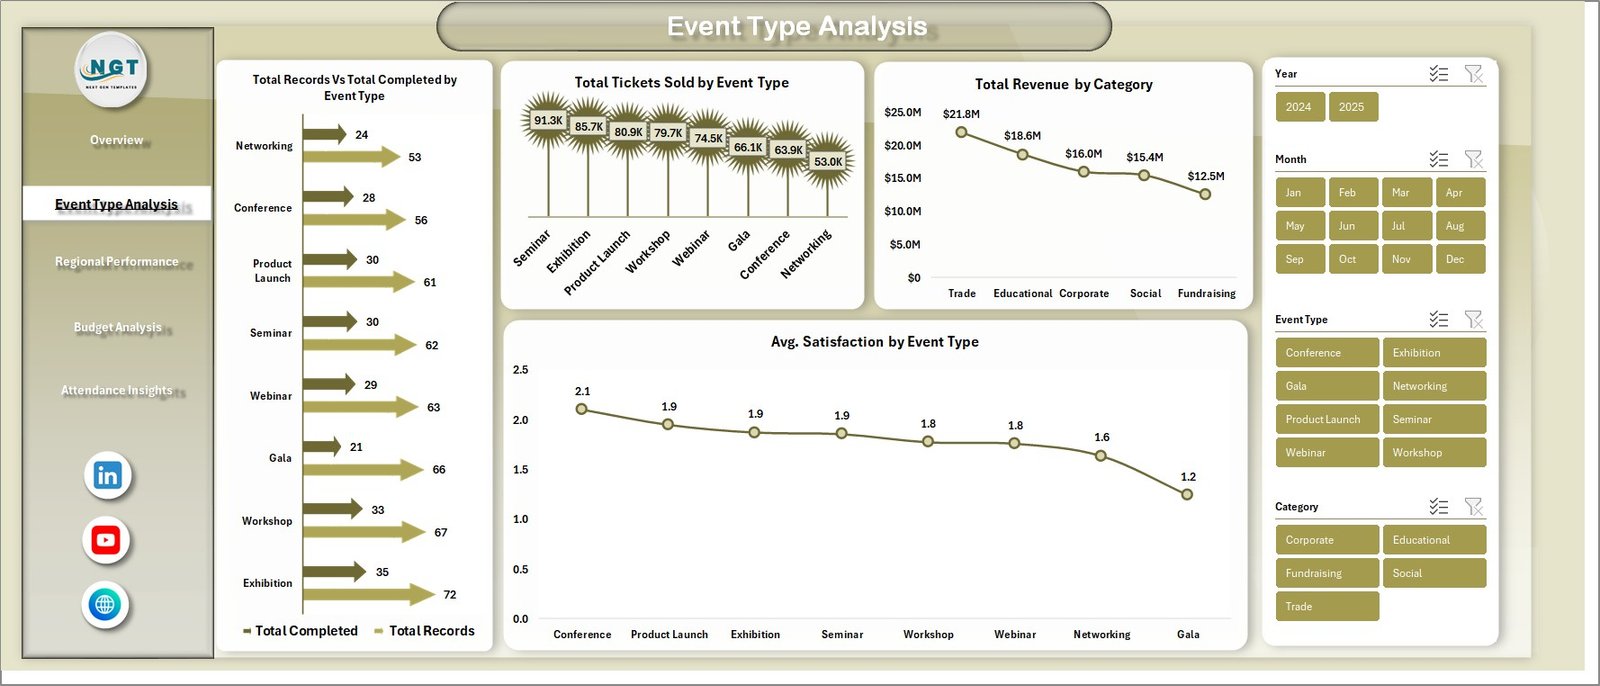 Event Type Analysis
📊 Regional Performance Page — Delivers geographic insights with Total Records Vs Total Cancelled by Region, Total Revenue by City, Attendance Rate % by Region, and Total Spend by City visualizations.
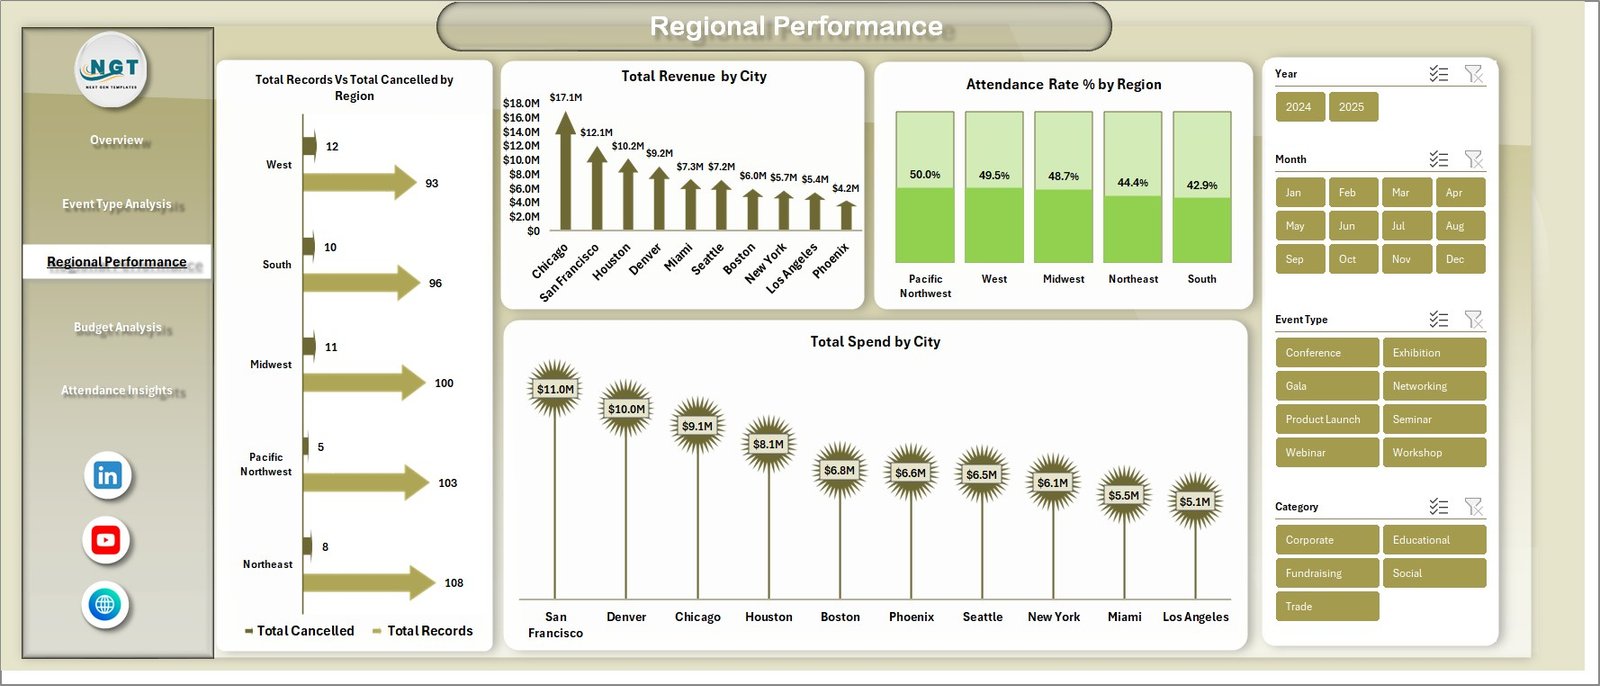 Regional Performance
📊 Budget Analysis Page — Financial deep-dive showing Total Budget Vs Total Spend by Event Type, Budget Utilization % by Category, Total Revenue by Month, and Total Revenue by Marketing Channel.
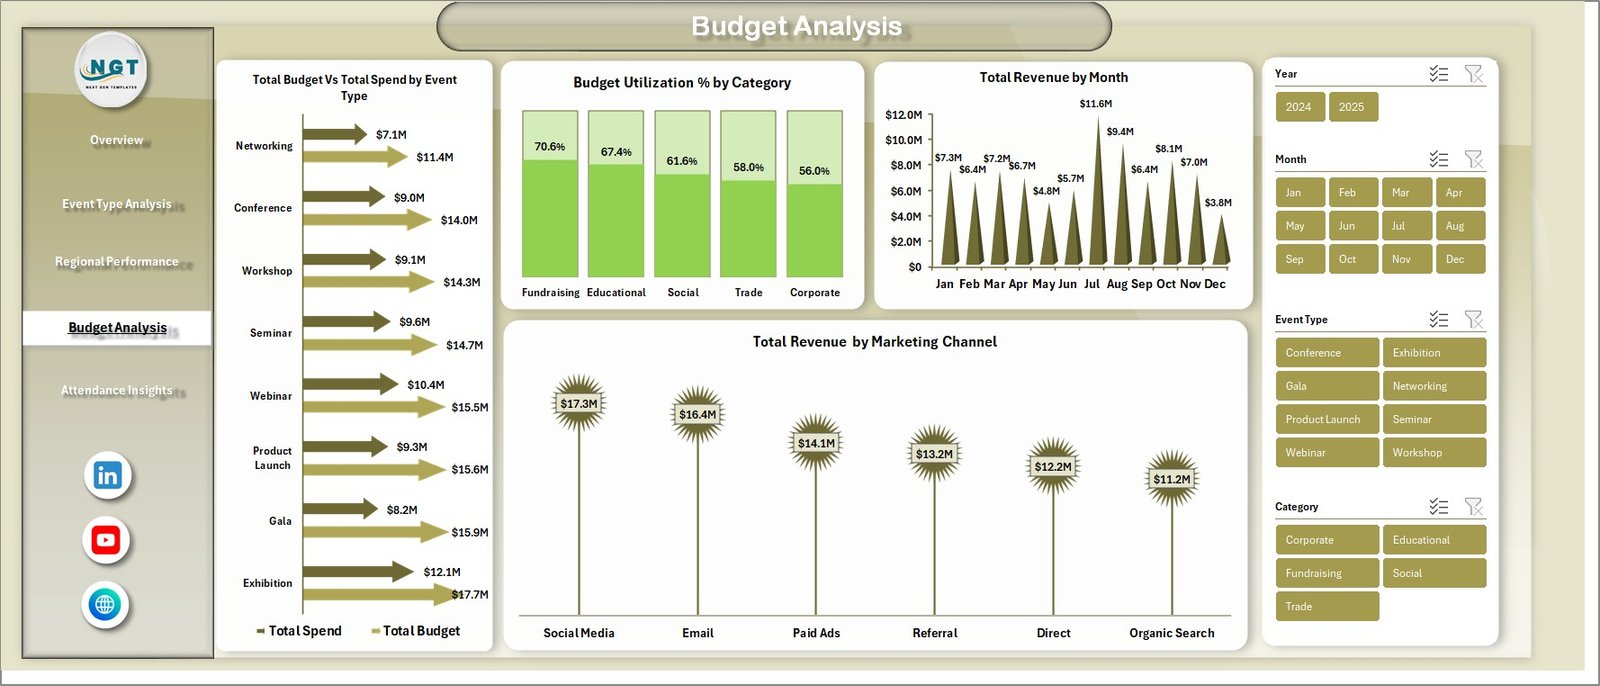 Budget Analysis
📊 Attendance Insights Page — Complete attendance reporting with Total Actual Attendees by Event Type, Total Records by Venue, and Total Records by Status charts.
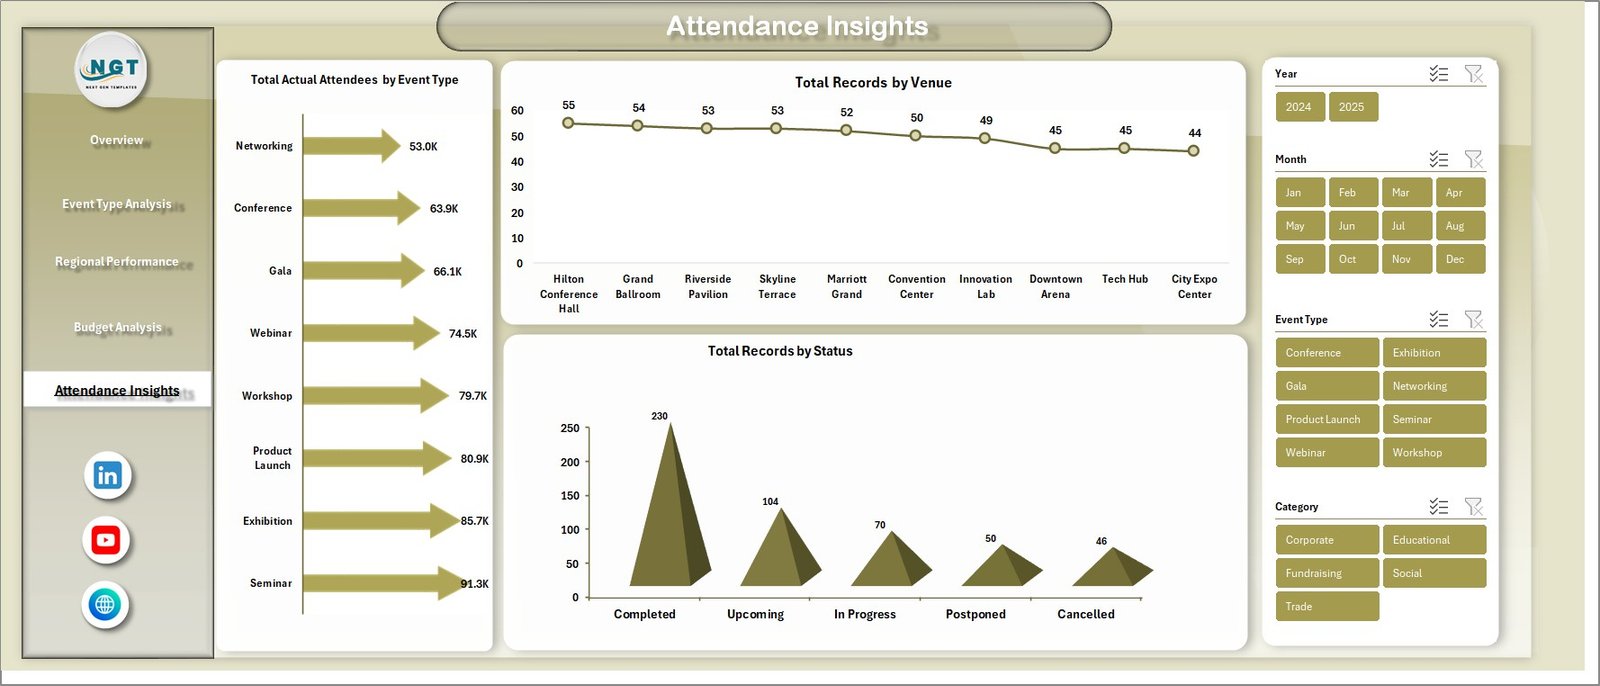 Attendance Insights
📋 Data Sheet Tab — This is where you enter your raw event data. Simply add your records in the same format as the sample data and refresh the pivot tables to update the entire dashboard.
 Data Sheet Tab
⚙️ Support Sheet — Contains multiple pivot tables that power the entire dashboard dynamically. Go to the Data tab in the Excel Ribbon and click Refresh All after updating the data sheet. All pivots and charts refresh automatically. You can keep this sheet hidden during presentations.
⚙️ How to Use the Event Management Analysis Dashboard in Excel
1️⃣ Download and Open — Download the zip file, extract it, and open the Excel file in Microsoft Excel 2016 or later (including Microsoft 365).
2️⃣ Review the Sample Data — Navigate to the Data Sheet tab to see the sample dataset structure with columns for event details, revenue, spend, attendance, satisfaction, and more.
3️⃣ Replace with Your Data — Clear the sample data and paste your own event records following the same column format.
4️⃣ Refresh Pivot Tables — Go to the Data tab in the Excel Ribbon and click Refresh All. All pivot tables, charts, and KPI cards update automatically.
5️⃣ Apply Filters — Use the built-in slicer controls on each page to filter by event type, region, category, venue, or marketing channel for targeted analysis.
6️⃣ Present and Share — Print any page or export as PDF for executive presentations and stakeholder reports.
👥 Who Can Benefit from This Event Management Analysis Dashboard in Excel
🎯 Event Planners and Coordinators — Track event performance, budgets, and attendance across multiple events in one place.
🎯 Marketing Teams — Analyze marketing channel effectiveness and revenue contribution for each event type.
🎯 Corporate Event Managers — Monitor regional performance, budget utilization, and satisfaction scores for corporate conferences and retreats.
🎯 Nonprofit Organizations — Track fundraising events, donor attendance, and budget allocation for charity events.
🎯 Venue Managers — Analyze venue-wise event distribution, attendance trends, and revenue patterns.
🎯 Small Business Owners — Get complete visibility into event ROI without expensive event management software.
❓ Frequently Asked Questions
What KPIs does the Event Management Analysis Dashboard in Excel track?
The Event Management Analysis Dashboard in Excel tracks 5 key performance indicators including Total Records, Total Revenue, Total Spend, Total Tickets Sold, and Average Satisfaction Score. It also provides detailed analysis across event types, regions, cities, venues, and marketing channels through 5 dedicated dashboard pages.
Do I need advanced Excel skills to use this event management dashboard?
No. Simply replace the sample data with your own event records in the Data Sheet tab and click Refresh All in the Data tab. All charts, KPI cards, and pivot tables update automatically without any formulas or coding.
Can I filter the dashboard by specific event types or regions?
Yes. The dashboard includes built-in Excel slicer controls on every page that let you filter instantly by event type, region, category, venue, status, and marketing channel for targeted analysis.
What is the best Excel template for tracking event budgets and attendance?
The Event Management Analysis Dashboard in Excel is one of the best templates for tracking event budgets and attendance. It includes a dedicated Budget Analysis page comparing Total Budget vs Total Spend by Event Type, Budget Utilization % by Category, and an Attendance Insights page tracking Total Actual Attendees by Event Type, Records by Venue, and Records by Status.
Which Excel versions are compatible with this event dashboard template?
This dashboard is compatible with Microsoft Excel 2016, 2019, 2021, and Microsoft 365. It uses standard pivot tables, charts, and slicers without any VBA macros, ensuring maximum compatibility.
How do I update the dashboard with new event data?
Navigate to the Data Sheet tab, add or replace event records in the same column format, then go to the Data tab in Excel Ribbon and click Refresh All. All pivot tables in the Support Sheet will refresh and all dashboard charts and KPIs will update instantly.
🔗 Explore Related Templates
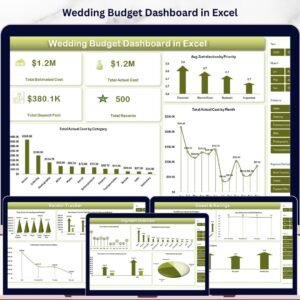
📌 Wedding Budget Dashboard in Excel — Track wedding expenses, vendor payments, and budget allocations with this dedicated wedding planning dashboard.
📌 Warehouse Efficiency Dashboard in Excel — Monitor warehouse operations, efficiency metrics, and logistics performance in Excel.
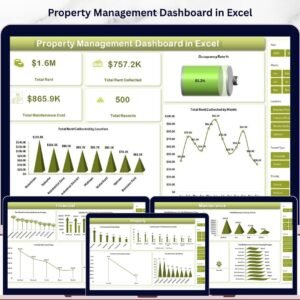
📌 Property Management Dashboard in Excel — Analyze property revenue, occupancy rates, and maintenance tracking for real estate managers.
📖 Click here to read the Detailed Blog Post about Event Management Analysis Dashboard in Excel
Watch the step-by-step video tutorial:
























Reviews
There are no reviews yet.