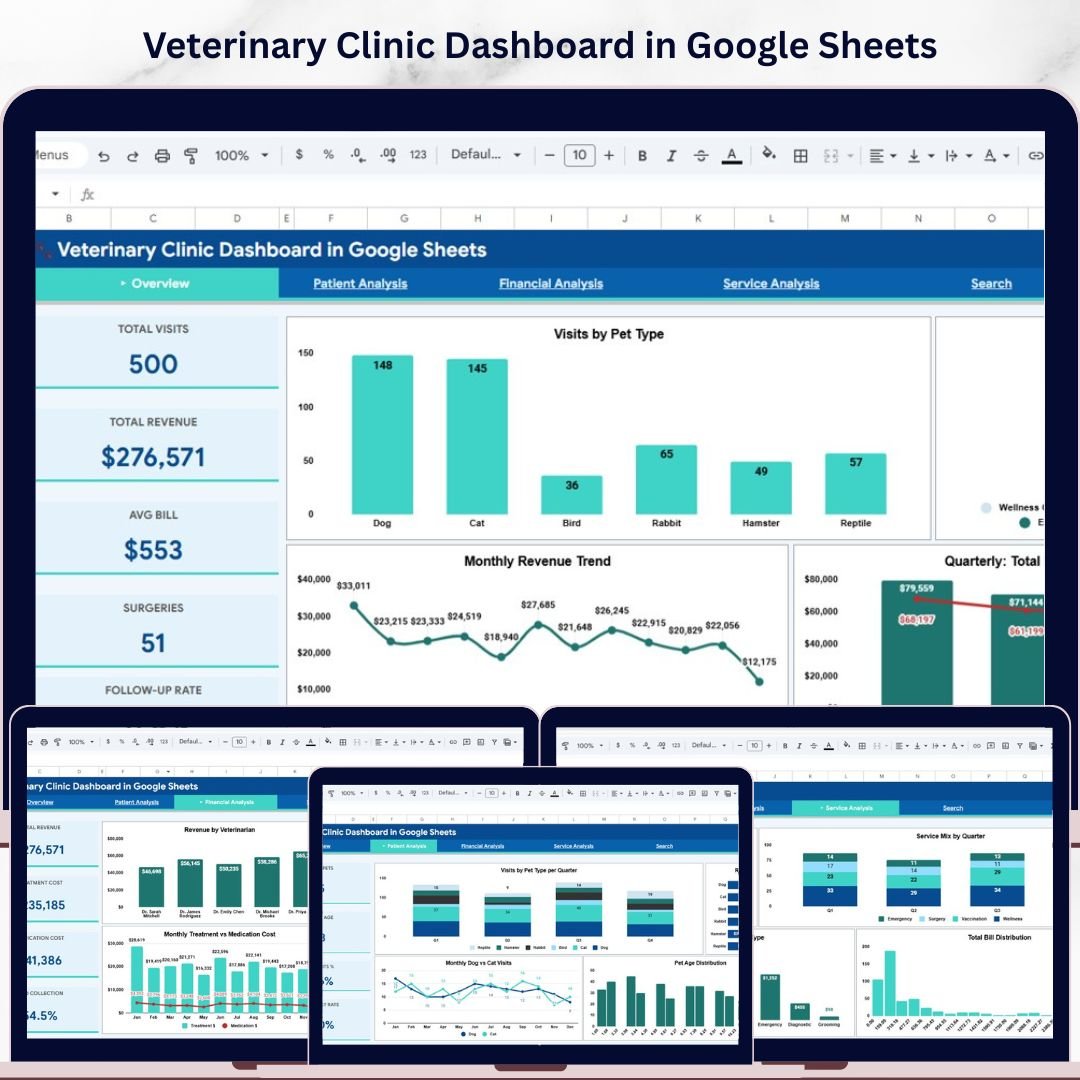


Veterinary Clinic Dashboard in Google Sheets is a professionally designed, interactive analytics dashboard built for veterinary clinic owners, practice managers, and animal healthcare professionals who want complete visibility into clinic operations, patient trends, treatment costs, and revenue performance — all inside Google Sheets. This dashboard includes 6 interactive pages covering every angle of veterinary clinic management from high-level KPI overviews to granular visit record lookups. It tracks 5 key performance indicators — Total Visits, Total Revenue, Avg Bill, Surgeries, and Follow-Up Rate — across multiple analytical views with interactive slicers for instant filtering.
Unlike complex BI tools, this Google Sheets veterinary dashboard works right inside your browser — no software installation, no licensing fees, no learning curve. Simply open the template in Google Drive, replace the sample data with your clinic records, and watch all charts and KPIs update automatically. Whether you manage a small veterinary practice or a multi-location animal hospital, this template delivers actionable insights to help you make smarter clinical and financial decisions every day. Also check out the Veterinary Clinic Dashboard in Power BI and the Veterinary Clinic Dashboard in Excel for alternative platform options.
🔑 Key Features of Veterinary Clinic Dashboard in Google Sheets
📊 6 Interactive Dashboard Pages — Overview, Patient Analysis, Financial Analysis, Service Analysis, Search Page, and Data Sheet provide a 360-degree view of your clinic’s operations and finances.
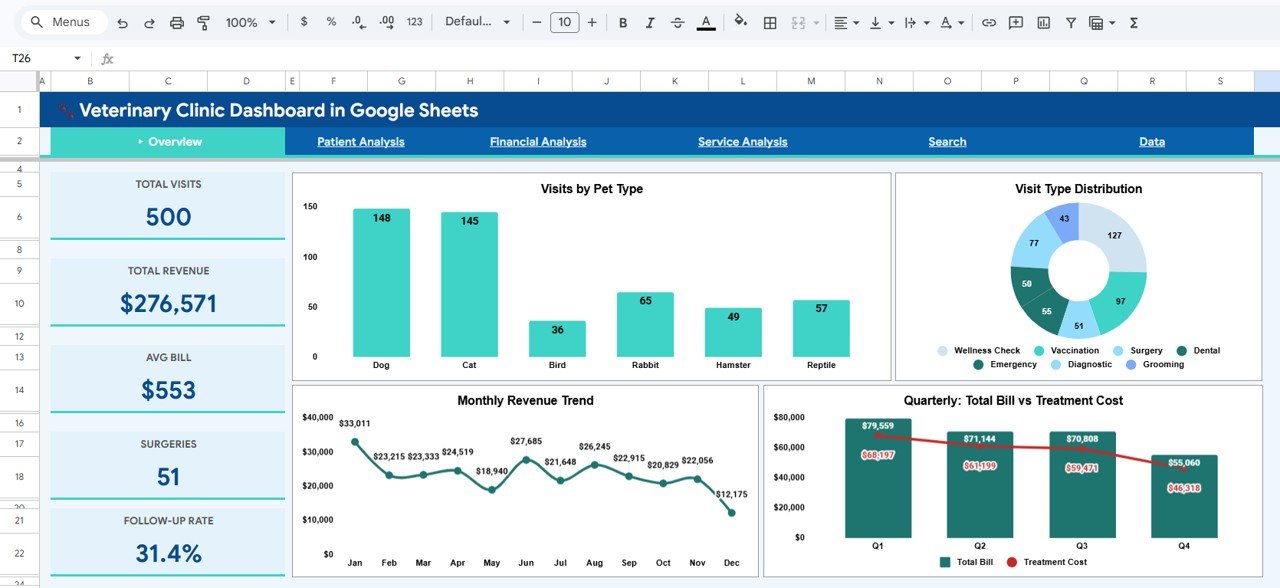
📈 5 Real-Time KPI Cards — Track Total Visits, Total Revenue, Avg Bill, Surgeries, and Follow-Up Rate at a glance on the Overview page. These KPIs update automatically when you enter your data.
🔍 Interactive Slicers and Filters — Use built-in slicers on the Overview page to filter the entire dashboard by pet type, visit type, veterinarian, payment status, and more for quick drill-down analysis.
🐾 Patient Analytics — Analyze visits by pet type per quarter, revenue by pet type, monthly dog vs cat visits, and pet age distribution to understand patient demographics and patterns.
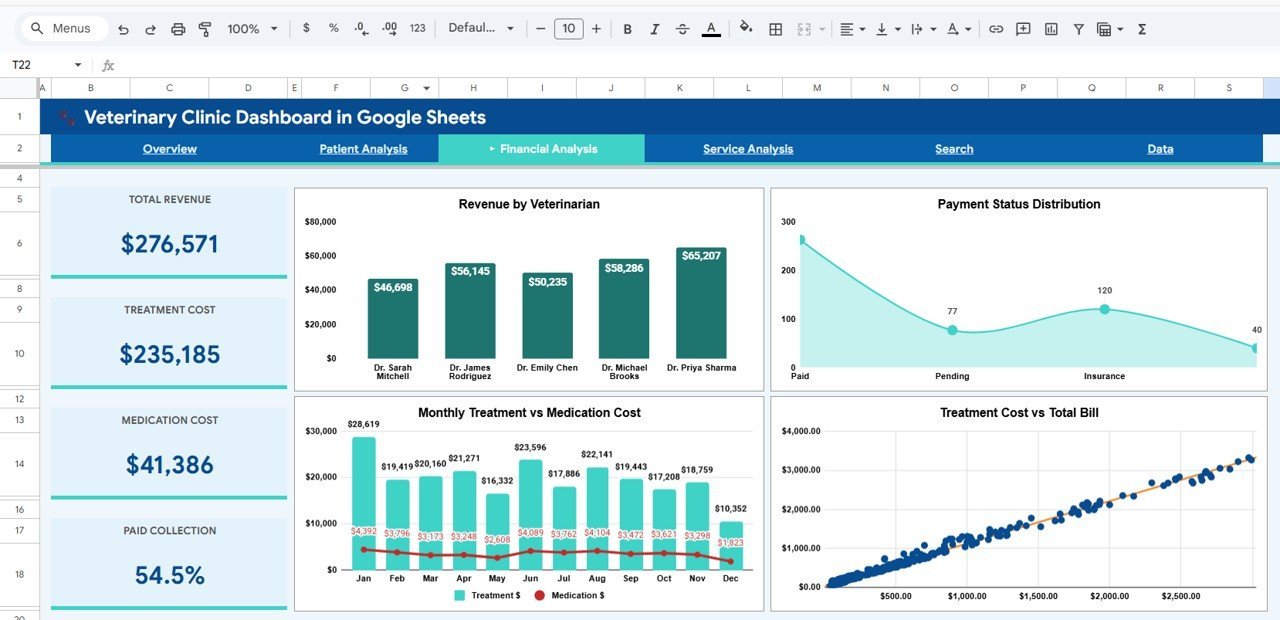
💰 Financial Intelligence — Break down revenue by veterinarian, payment status distribution, monthly treatment vs medication cost, and treatment cost vs total bill for complete financial clarity.
🩺 Service Analysis — Evaluate revenue by visit type, service mix by quarter, average bill by visit type, and total bill distribution to optimize your service offerings and pricing strategy.
🔎 Smart Search Page — Instantly look up any visit record by Visit ID with full details including Date, Pet Name, Pet Type, Breed, Owner Name, Visit Type, Veterinarian, Diagnosis, Treatment Cost, Medication Cost, Total Bill, Payment Status, Pet Age, and Follow-Up Required.
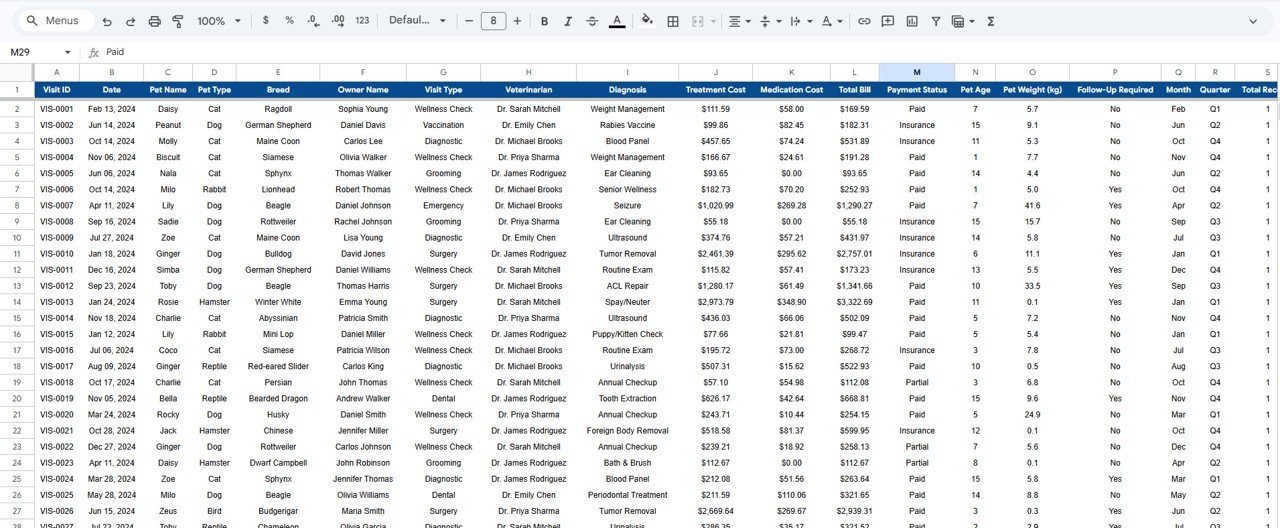
📂 Structured Data Sheet — Pre-formatted data entry sheet where you add your clinic records. All dashboard pages, charts, and KPIs update automatically based on the data you enter here.
📦 What’s Inside the Veterinary Clinic Dashboard in Google Sheets
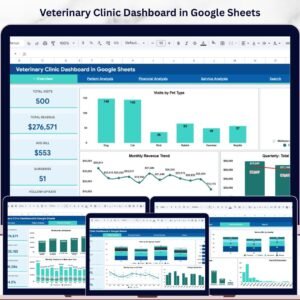
1 – Overview Page: Your clinic’s command center with KPI cards showing Total Visits, Total Revenue, Avg Bill, Surgeries, and Follow-Up Rate. Charts include Visits by Pet Type, Visit Type Distribution, Monthly Revenue Trend, and Quarterly Total Bill vs Treatment Cost. Interactive slicers let you filter the entire dashboard instantly for targeted analysis.
Veterinary Clinic Dashboard in Google Sheets
2 – Patient Analysis: Deep dive into patient data with charts for Visits by Pet Type per Quarter, Revenue by Pet Type, Monthly Dog vs Cat Visits, and Pet Age Distribution. This page helps you understand which pet types drive the most visits and how patient demographics change across quarters.
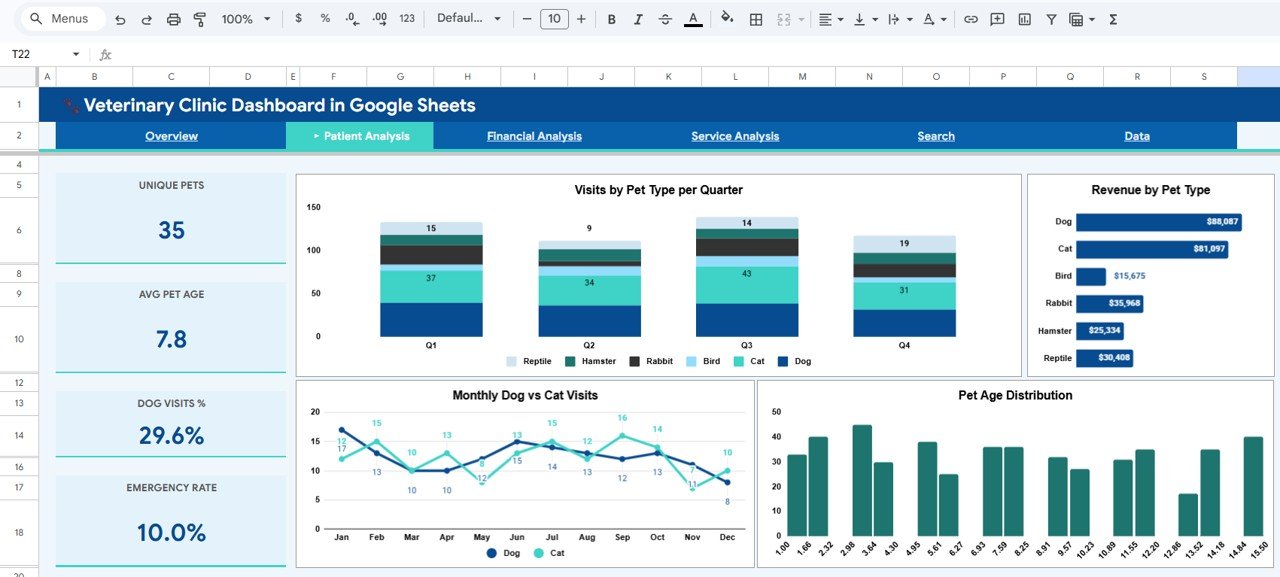
Patient Analysis
3 – Financial Analysis: Analyze your clinic’s finances with Revenue by Veterinarian, Payment Status Distribution, Monthly Treatment vs Medication Cost, and Treatment Cost vs Total Bill. Identify which veterinarians generate the most revenue and track how treatment costs compare against total billing.

Financial Analysis
4 – Service Analysis: Evaluate your service offerings with Revenue by Visit Type, Service Mix by Quarter, Avg Bill by Visit Type, and Total Bill Distribution. Understand which visit types are most profitable and how your service mix evolves over time.
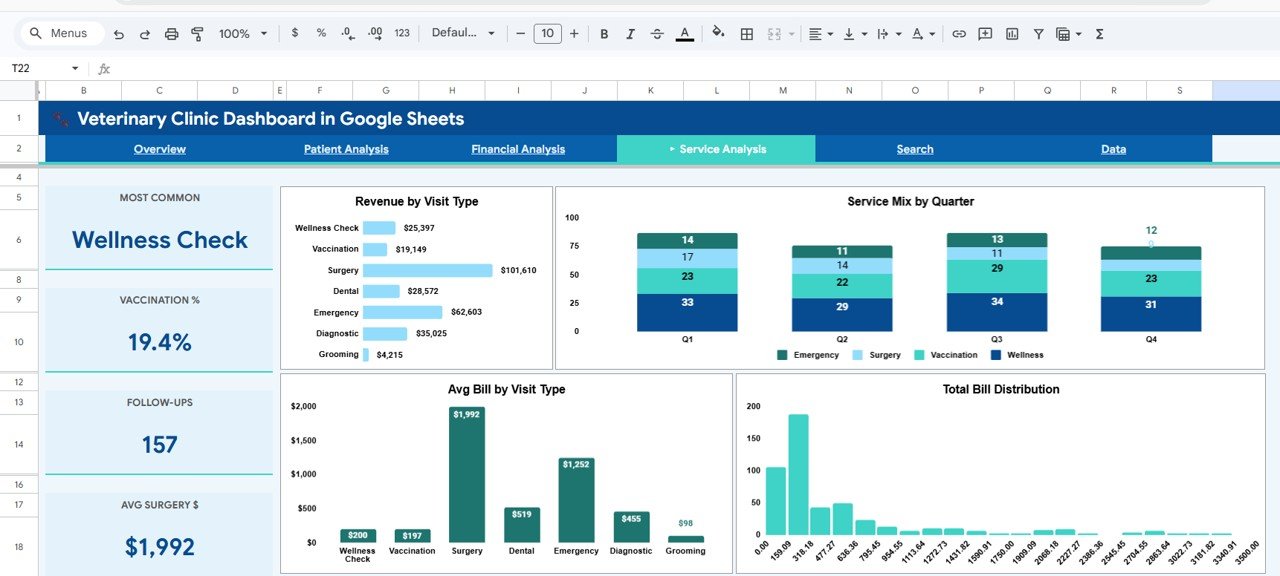
Service Analysis
5 – Search Page: A powerful lookup tool where you select any Visit ID from a dropdown and instantly view the complete visit details including Visit ID, Date, Pet Name, Pet Type, Breed, Owner Name, Visit Type, Veterinarian, Diagnosis, Treatment Cost, Medication Cost, Total Bill, Payment Status, Pet Age, and Follow-Up Required.
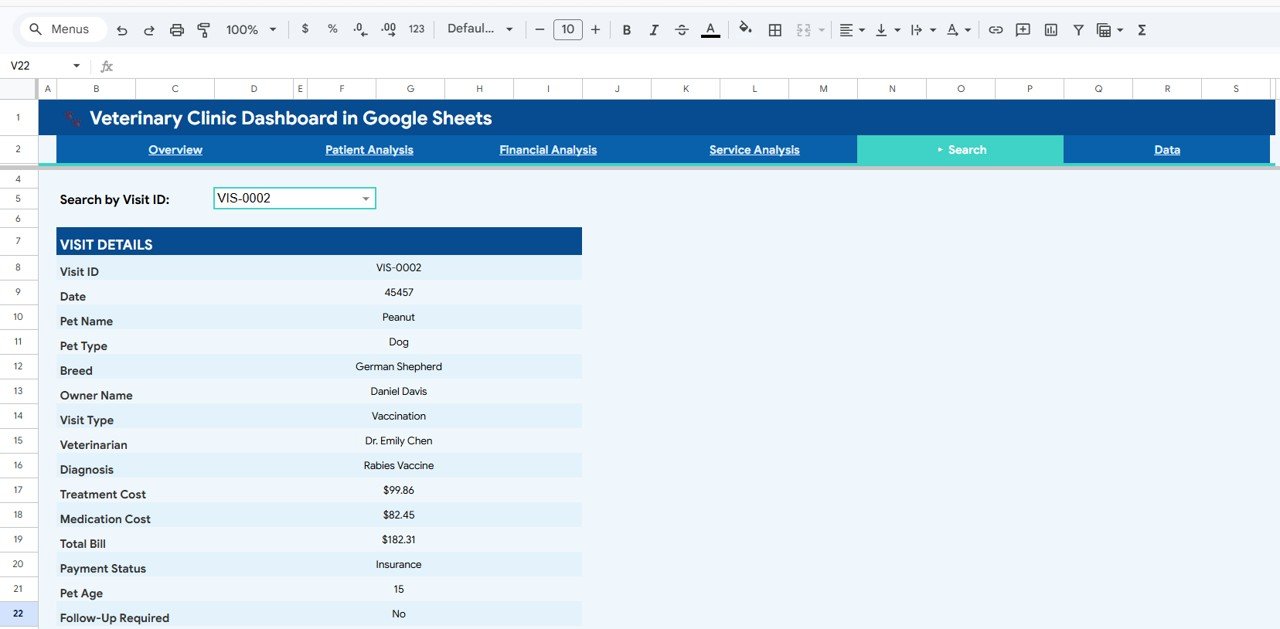
Search Sheet Tab
6 – Data Sheet: Enter your clinic data here in the pre-structured format provided. This is your single source of truth for the entire dashboard — all pages, charts, and KPIs auto-update from this sheet.
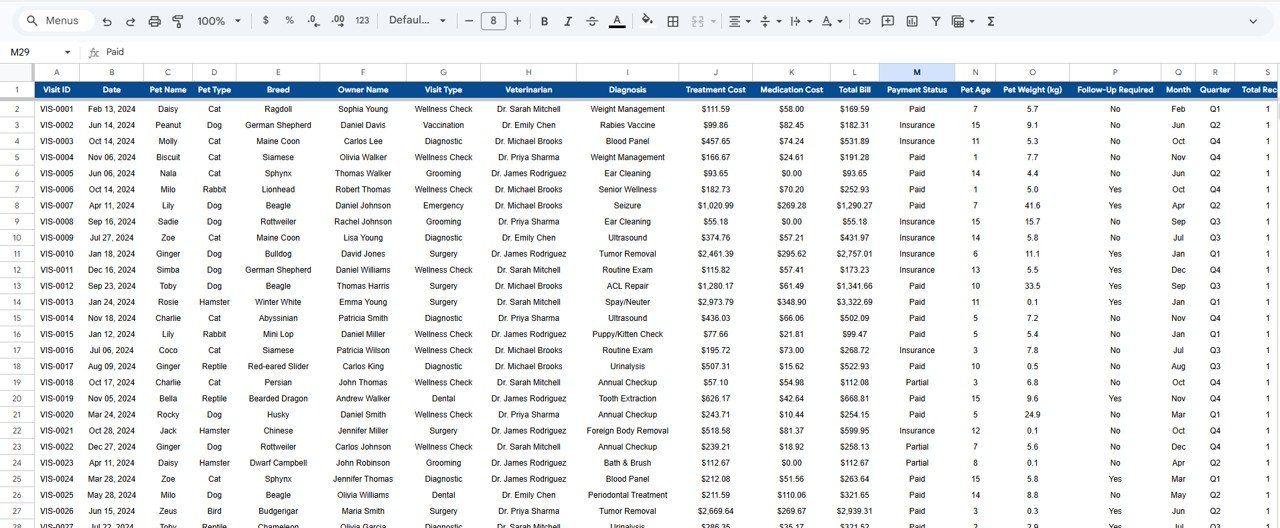
Data Sheet Tab
If you are looking for a KPI-focused scorecard, check out the Veterinary Clinic KPI Scorecard in Excel. For a healthcare dashboard in Power BI, explore the Veterinary Clinic Dashboard in Power BI.
⚙️ How to Use the Veterinary Clinic Dashboard in Google Sheets
1️⃣ Download and Open — Download the template and open the PDF guide included in your purchase.
2️⃣ Create Your Copy — Click the Google Sheets copy link in the PDF to create your own editable copy in Google Drive.
3️⃣ Enter Your Data — Navigate to the Data Sheet tab and replace the sample data with your actual clinic records.
4️⃣ Explore the Dashboard — All 6 dashboard pages will auto-update with your real data — charts, KPIs, and filters refresh instantly.
5️⃣ Apply Filters — Use slicers on the Overview page to filter by pet type, visit type, veterinarian, payment status, and more.
6️⃣ Look Up Records — Use the Search Page to look up individual visit records by Visit ID.
👥 Who Can Benefit from This Veterinary Clinic Dashboard in Google Sheets
🐶 Veterinary Clinic Owners and Practice Managers tracking overall clinic performance and profitability.
🩺 Veterinarians monitoring patient outcomes, treatment costs, and revenue patterns across their practice.
💼 Clinic Administrators managing operational workflows, billing analytics, and payment status tracking.
📊 Business Analysts in healthcare and medical services looking for ready-to-use Google Sheets analytics tools.
🐾 Animal Hospital Chains comparing performance across multiple locations and veterinary teams.
❓ Frequently Asked Questions
What KPIs does the Veterinary Clinic Dashboard in Google Sheets track?
The Veterinary Clinic Dashboard in Google Sheets tracks 5 key performance indicators: Total Visits, Total Revenue, Avg Bill, Surgeries, and Follow-Up Rate. These KPIs are displayed as interactive cards on the Overview page and update automatically when you enter your data.
Do I need advanced Google Sheets skills to use this template?
No. Simply replace the sample data in the Data Sheet tab with your own clinic records and all charts, KPIs, and filters update automatically. No formulas or scripts to configure — it works out of the box.
Can I look up a specific visit record in this dashboard?
Yes. Navigate to the Search Page tab and select a Visit ID from the dropdown. The page will instantly display all 14 details for that visit including Date, Pet Name, Breed, Veterinarian, Diagnosis, Treatment Cost, Total Bill, Payment Status, and more.
How is this different from the Veterinary Clinic Dashboard in Power BI?
The Veterinary Clinic Dashboard in Power BI uses DAX measures and Power BI Desktop for advanced drill-through analytics. This Google Sheets version runs entirely in your browser with no software installation, making it ideal for teams who prefer cloud-based, collaborative tools.
Is there an Excel version of this dashboard?
Yes! Check out the Veterinary Clinic Dashboard in Excel for a pivot-driven Excel alternative with 5 interactive analysis pages and automated charts.
🔗 Explore Related Templates
🔹 Veterinary Clinic Dashboard in Excel — Pivot-driven Excel dashboard with 5 interactive analysis pages and automated charts.
🔹 Veterinary Clinic Dashboard in Power BI — Advanced Power BI dashboard with DAX-powered visuals and drill-through capabilities.
🔹 Veterinary Clinic KPI Scorecard in Excel — Track monthly and yearly KPI targets with color-coded performance indicators.
📖 Click here to read the Detailed Blog Post
Watch the step-by-step video tutorial:


Reviews
There are no reviews yet.