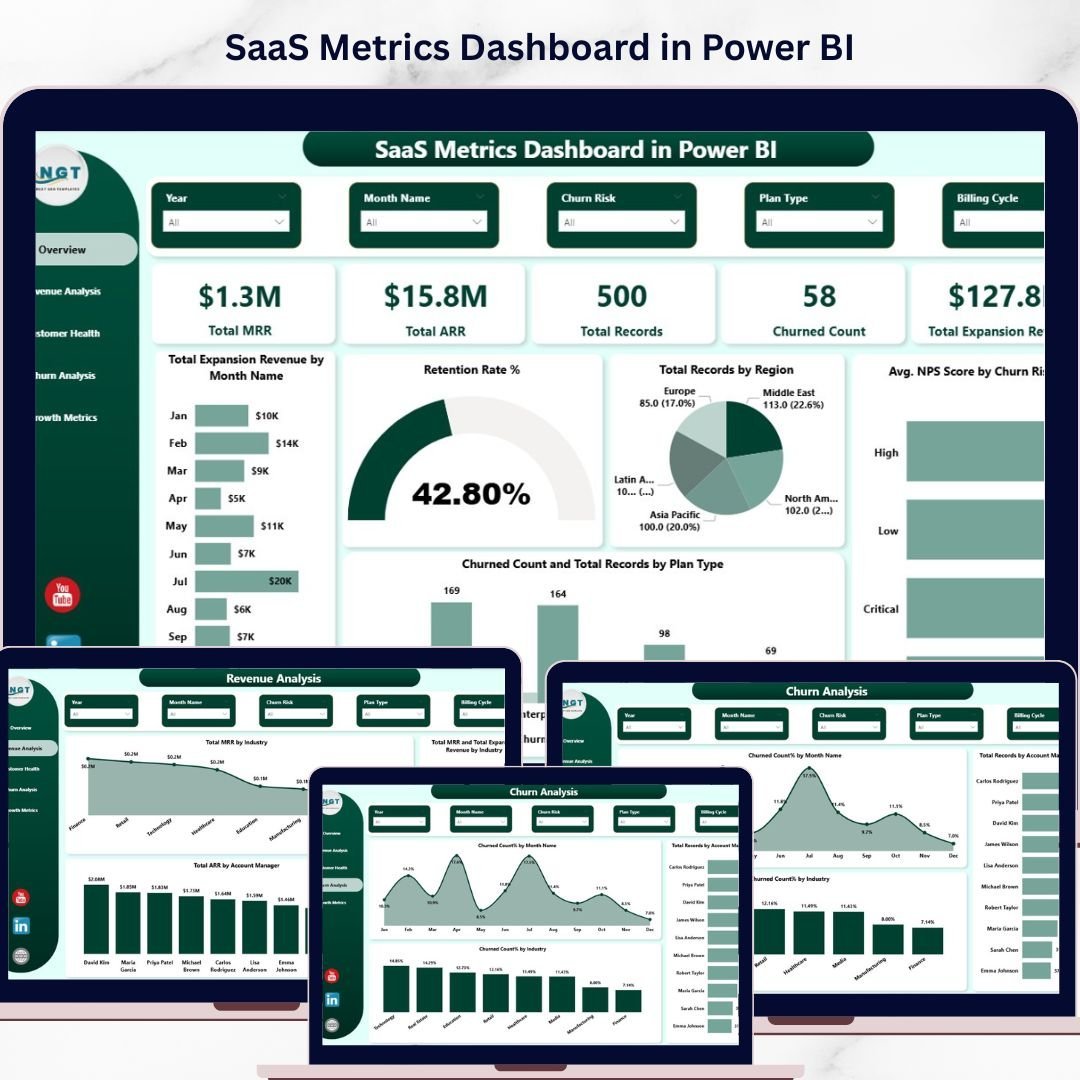


SaaS Metrics Dashboard in Power BI is a professionally designed, interactive analytics template built for SaaS founders, subscription business owners, revenue operations managers, and customer success leaders who want to monitor MRR, ARR, churn, retention, NPS, and expansion revenue from a single dynamic interface. This template includes 5 interactive dashboard pages covering Overview, Revenue Analysis, Customer Health, Churn Analysis, and Growth Metrics 🚀. Simply open the .pbix file in Power BI Desktop, replace the sample data with your own, and watch your entire dashboard update automatically.
Whether you are tracking total MRR by industry, analyzing churned count by plan type, measuring average NPS score by churn risk, or evaluating expansion revenue trends by month, this SaaS Metrics Dashboard in Power BI gives you complete visibility into your subscription business operations with dynamic charts, KPI cards, and slicer-based filtering. This is one of the most comprehensive SaaS analytics solutions available in Power BI.
🔑 Key Features of SaaS Metrics Dashboard in Power BI
📊 5 Interactive Dashboard Pages – Navigate between Overview, Revenue Analysis, Customer Health, Churn Analysis, and Growth Metrics tabs to explore your SaaS subscription data from every angle. This dashboard tracks 5 high-level KPIs including Total MRR, Total ARR, Total Records, Churned Count, and Total Expansion Revenue.
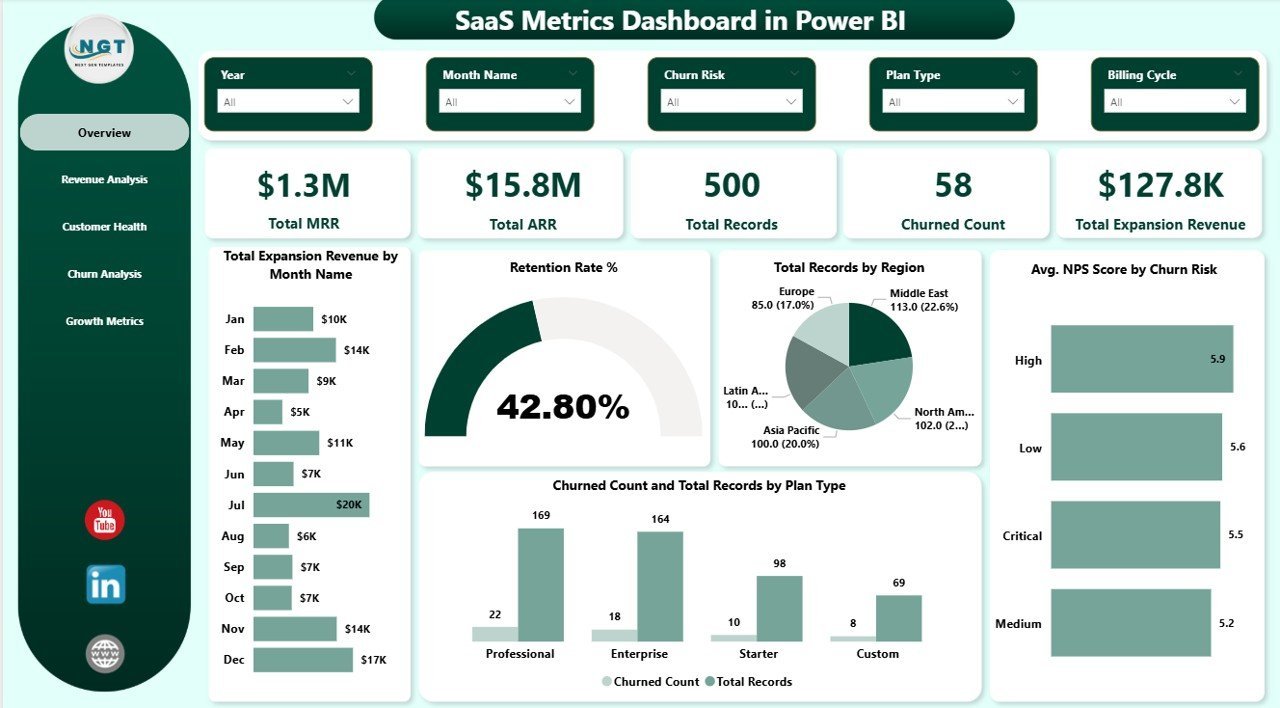
📈 5 Dynamic KPI Cards – Track high-level metrics at a glance including Total MRR, Total ARR, Total Records, Churned Count, and Total Expansion Revenue on the overview page for a quick executive summary of your SaaS business health.
🔍 Advanced Slicers and Filters – Filter the entire dashboard instantly by industry, region, plan type, churn risk, account manager, billing cycle, and more for targeted SaaS analysis.
📉 Retention and Churn Tracking – Analyze Retention Rate %, Churned Count by Plan Type, Churned Count % by Industry, Churned Count % by Month Name, and Avg NPS Score by Churn Risk to identify and reduce customer attrition.
💰 Revenue Deep Dive – Explore Total MRR by Industry, Total MRR and Total Expansion Revenue by Industry, Total ARR by Account Manager, and Total Expansion Revenue by Month Name for complete revenue visibility.
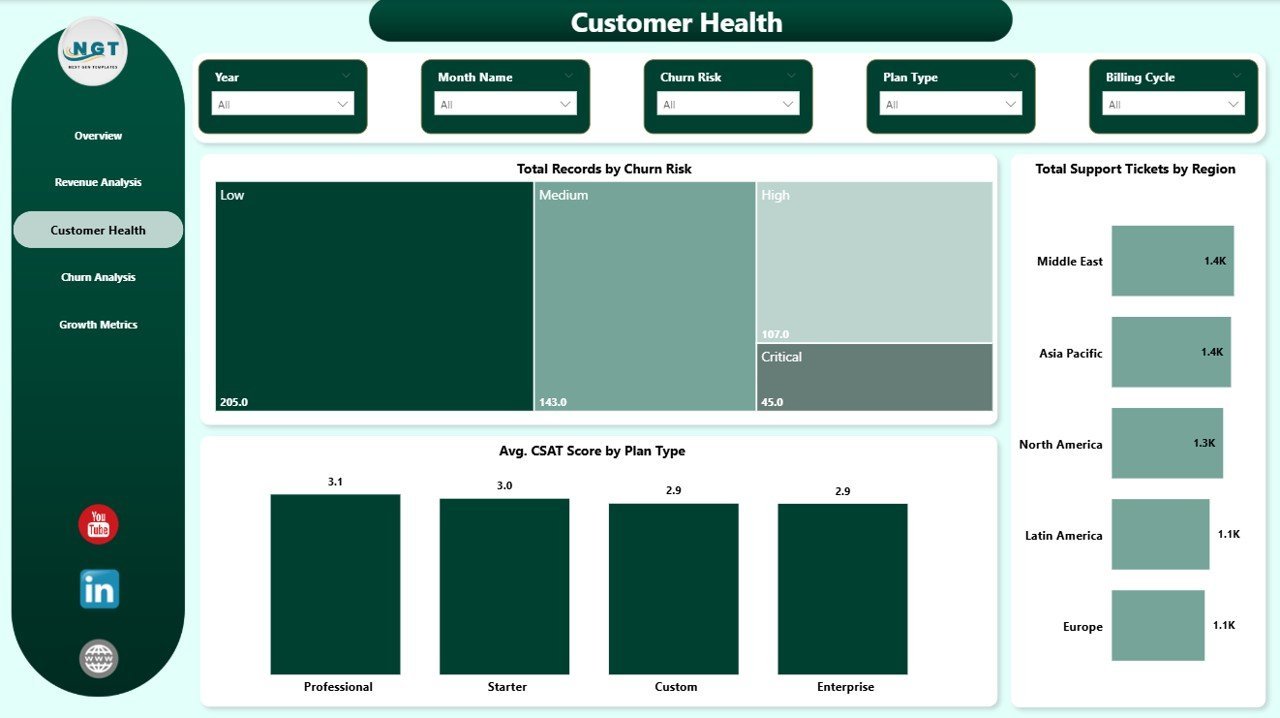
🏥 Customer Health Monitoring – Track Total Records by Churn Risk to identify at-risk accounts, Total Support Tickets by Region to monitor support demand, and Avg CSAT Score by Plan Type to measure customer satisfaction across subscription tiers.
📊 Growth Metrics Analysis – Monitor expansion revenue trends, churn patterns by month and industry, and account manager effectiveness to measure and accelerate business growth.
🔄 Fully Dynamic Power BI Engine – All charts and KPIs updte automatically when you connect your own data source. Simply replace sample data and refresh to update everything instantly.
📦 What’s Inside the SaaS Metrics Dashboard in Power BI
🔹 Overview Page – High-level KPI cards showing Total MRR, Total ARR, Total Records, Churned Count, and Total Expansion Revenue. Interactive charts display Total Expansion Revenue by Month Name tracking monthly expansion revenue trends, Retention Rate % showing overall customer retention performance, Total Records by Region revealing geographic distribution of your subscriber base, Avg NPS Score by Churn Risk comparing loyalty scores across risk segments, and Churned Count and Total Records by Plan Type comparing churn and subscriber distribution across subscription tiers with multiple slicers for instant filtered analysis.
 SaaS Metrics Dashboard in Power BI
🔹 Revenue Analysis Page – Deep dive into subscription revenue with Total MRR by Industry identifying which business sectors contribute the most monthly recurring revenue, Total MRR and Total Expansion Revenue by Industry comparing base revenue against expansion revenue across industries to spot growth opportunities, and Total ARR by Account Manager evaluating which team members manage the highest annual recurring revenue portfolios.
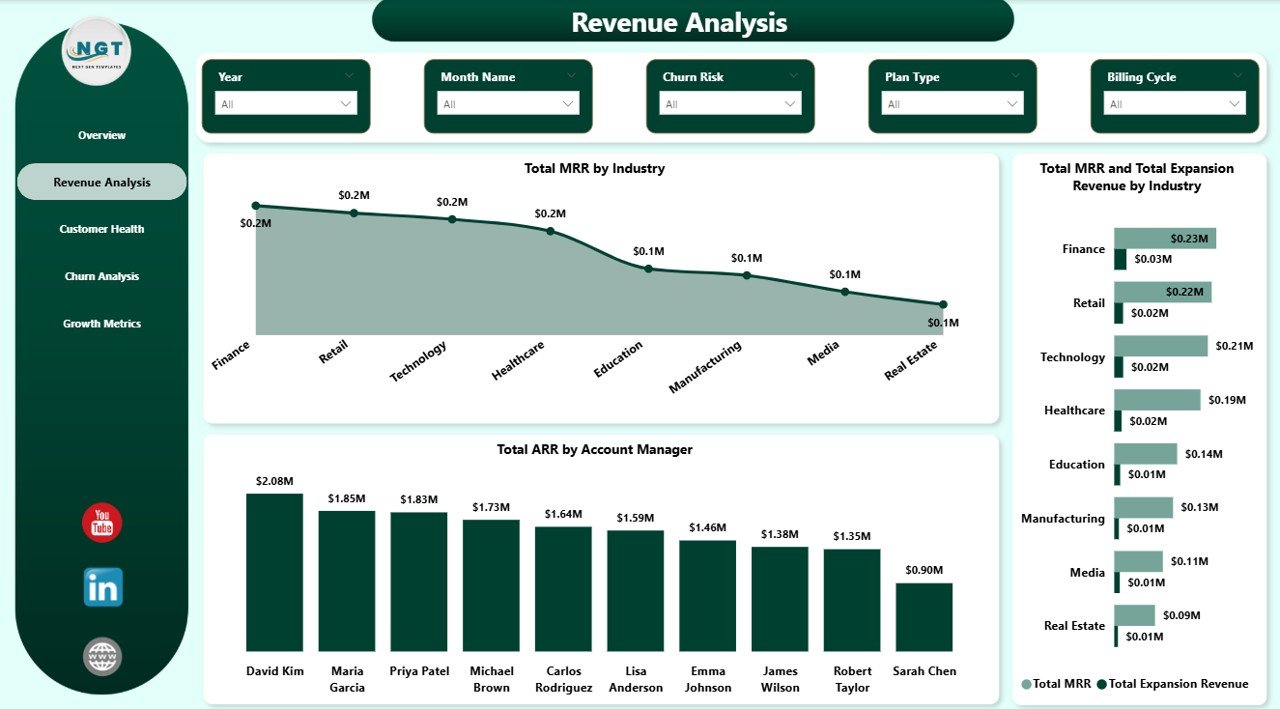 Revenue Analysis
🔹 Customer Health Page – Monitor the wellness of your customer base with Total Records by Churn Risk categorizing all accounts into risk segments so you can proactively address at-risk customers, Total Support Tickets by Region tracking support demand geographically to optimize team allocation, and Avg CSAT Score by Plan Type measuring customer satisfaction across subscription tiers to identify which plans deliver the best experience.
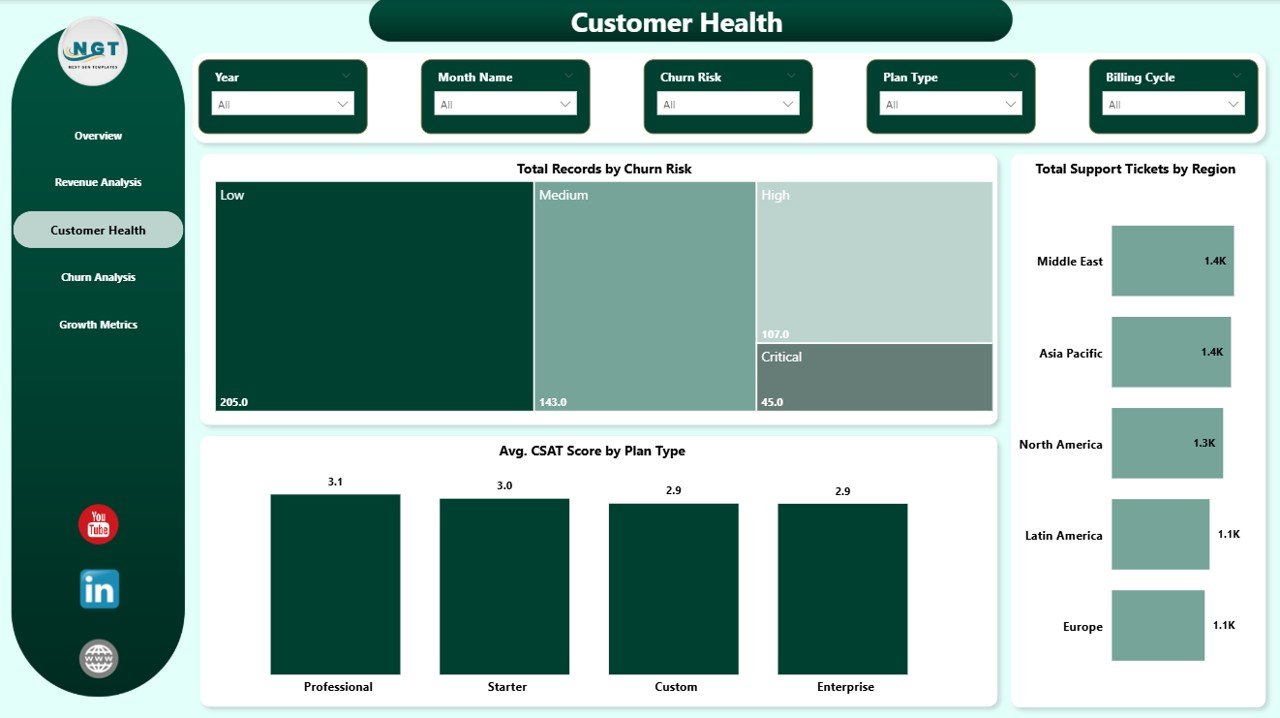 Customer Health
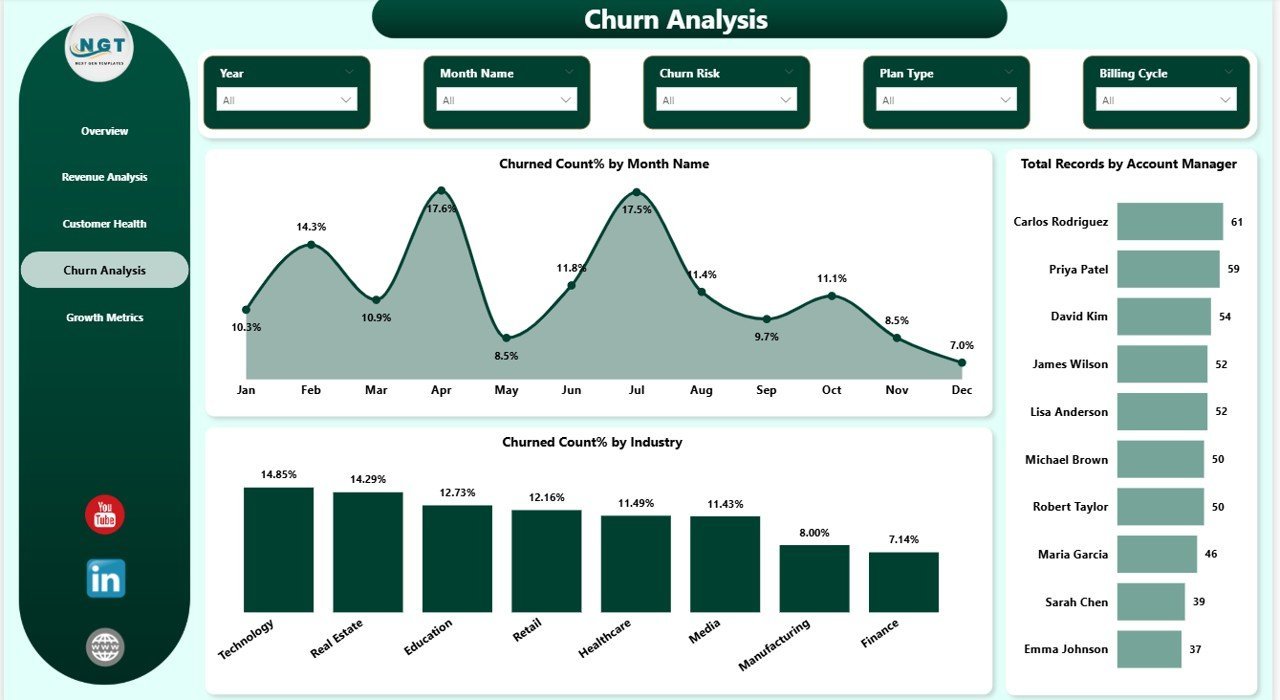
🔹 Churn Analysis Page – Understand and combat customer attrition with Churned Count % by Month Name revealing seasonal churn patterns and identifying months with the highest attrition rates, Churned Count % by Industry showing which business sectors experience the most churn so you can tailor retention strategies, and Total Records by Account Manager measuring account distribution and retention effectiveness per team member.
 Churn Analysis
🔹 Growth Metrics Page – Track business expansion and growth trajectory with detailed churn trend analysis by month, industry-level churn comparison to benchmark performance across sectors, and account manager workload distribution to ensure balanced portfolio management and identify top-performing team members driving growth.
⚙️ How to Use the SaaS Metrics Dashboard in Power BI
1️⃣ Download and unzip the file to your computer.
2️⃣ Open the .pbix file in Power BI Desktop (free download from Microsoft).
3️⃣ Explore the sample data across all 5 dashboard pages to understand the layout and available analysis.
4️⃣ Replace the sample data source with your actual SaaS subscription data.
5️⃣ Click Refresh in Power BI to update all charts and KPI cards automatically.
6️⃣ Use slicers and filters to drill down into specific industries, regions, plan types, or account managers.
👥 Who Can Benefit from This SaaS Metrics Dashboard
🔹 SaaS Founders and CEOs – Monitor MRR, ARR, churn, retention, and expansion revenue to track overall business health and growth trajectory.
🔹 Revenue Operations Managers – Analyze revenue by industry, account manager, and plan type for data-driven sales optimization.
🔹 Customer Success Teams – Track churn risk, NPS scores, CSAT metrics, and support ticket volumes to proactively manage customer relationships.
🔹 Finance and FP&A Teams – Use ARR and MRR trends, expansion revenue analysis, and churn patterns for financial planning and investor reporting.
🔹 Marketing and Growth Teams – Evaluate industry-level performance, identify high-growth segments, and optimize acquisition spend based on retention data.
❓ Frequently Asked Questions
What KPIs does the SaaS Metrics Dashboard in Power BI track?
The SaaS Metrics Dashboard in Power BI tracks 5 key performance indicators including Total MRR, Total ARR, Total Records, Churned Count, and Total Expansion Revenue. It also provides detailed analysis across retention rate, NPS scores, CSAT scores, churn patterns, and revenue breakdowns across 5 interactive dashboard pages.
Do I need advanced Power BI skills to use this template?
No. Simply open the .pbix file in Power BI Desktop, replace the sample data with your own SaaS subscription data, and click Refresh. All charts, KPI cards, and visuals update automatically without any DAX editing or advanced knowledge.
Can I track customer churn and retention with this dashboard?
Yes. The dedicated Churn Analysis page shows Churned Count % by Month Name, Churned Count % by Industry, and Total Records by Account Manager. The Overview page also displays Retention Rate % and Churned Count by Plan Type for quick monitoring.
What is the best Power BI template for tracking SaaS metrics like MRR and ARR?
The SaaS Metrics Dashboard in Power BI is one of the best templates for tracking SaaS subscription metrics because it includes MRR and ARR tracking, churn analysis, customer health monitoring with NPS and CSAT scores, expansion revenue tracking, and growth metrics — all in one interactive Power BI file with dynamic filters and KPI cards.
Can I filter the dashboard by industry or plan type?
Yes. The dashboard includes multiple slicers that let you instantly filter all charts and KPIs by industry, region, plan type, churn risk, account manager, billing cycle, and other dimensions for focused analysis.
🔗 Explore Related Templates
🔹 SaaS Metrics Dashboard in Excel – Track MRR, ARR, churn, retention, and expansion revenue with dynamic pivot-powered analytics for SaaS businesses.
🔹 SaaS Metrics Dashboard in HTML – Monitor SaaS performance metrics in a browser-based interactive dashboard with zero installation.
🔹 Subscription Business Dashboard in Power BI – Track subscription revenue, churn, retention, and satisfaction with dynamic Power BI analytics.
Browse all Power BI Dashboard Templates for more interactive analytics solutions.
📖 Click here to read the Detailed Blog Post
Watch the step-by-step video tutorial:


Reviews
There are no reviews yet.