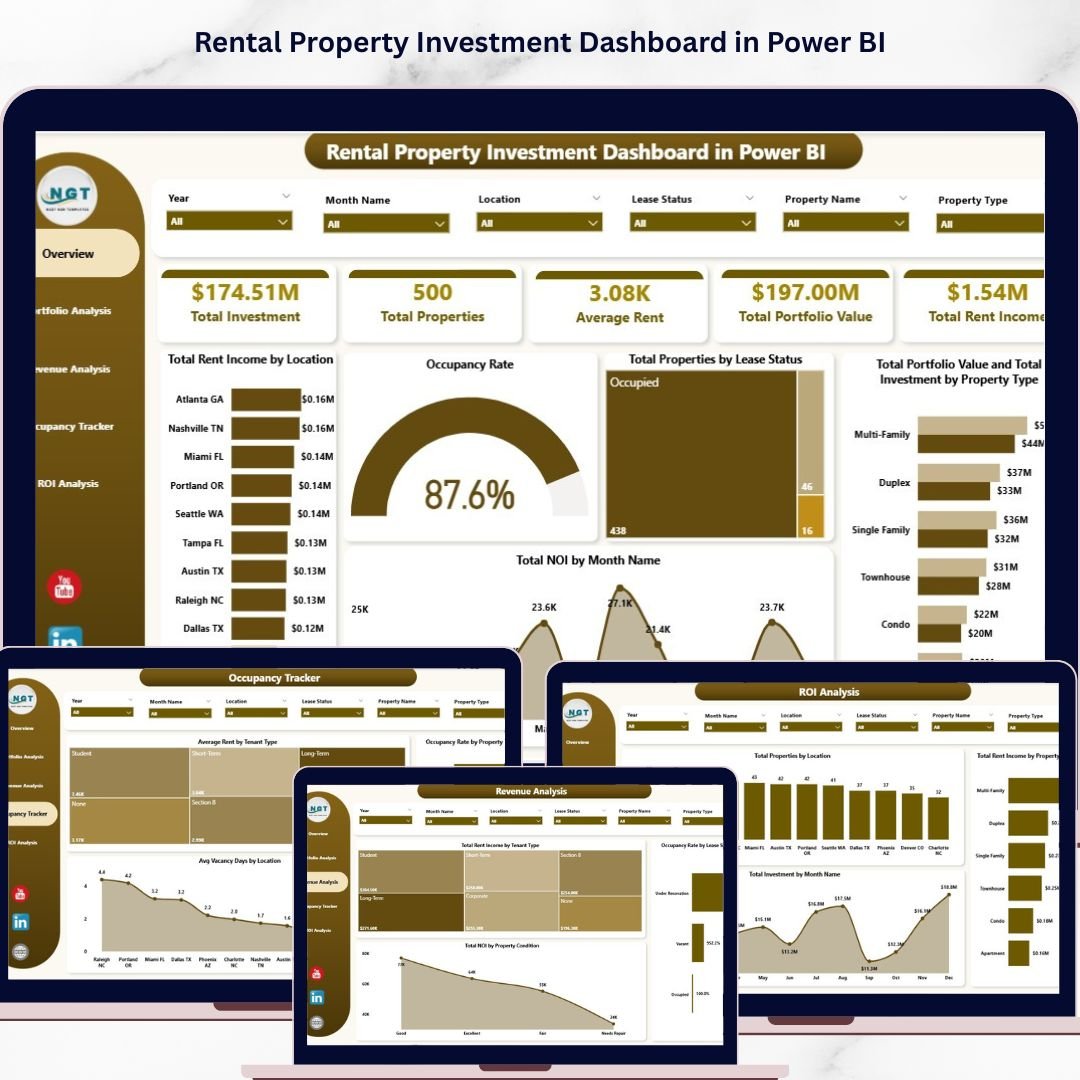

Rental Property Investment Dashboard in Power BI is a professionally designed, ready-to-use Power BI template that empowers property investors, landlords, real estate managers, and portfolio analysts to track and visualize every critical aspect of their rental property investments from a single interactive dashboard. Whether you own a handful of rental units or manage a large real estate portfolio, this template transforms your raw property data into powerful visual insights — making it easier than ever to monitor performance, maximize returns, and make smarter investment decisions.
If you have been searching for a modern, data-driven solution to manage your rental properties without building complex reports from scratch, the Rental Property Investment Dashboard in Power BI is exactly what you need. Simply open the .pbix file in Power BI Desktop, replace the sample data with your own, and watch your dashboard come to life with real-time analytics and interactive filters.
🔑 Key Features of Rental Property Investment Dashboard in Power BI
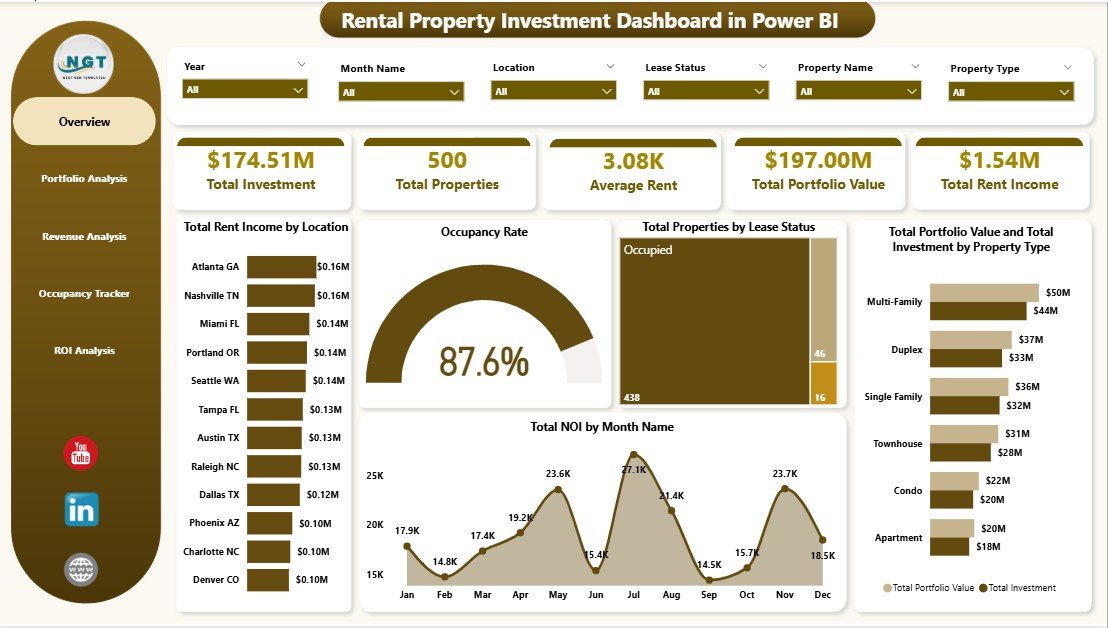
📊 Real-Time KPI Monitoring – Track essential rental property metrics including Total Investment, Total Properties, Average Rent, Total Portfolio Value, Total Rent Income, and Occupancy Rate all from a single overview page with dynamic KPI cards.
📈 5 Interactive Dashboard Pages – This template includes 5 dedicated analysis pages: Overview, Portfolio Analysis, Revenue Analysis, Occupancy Tracker, and ROI Analysis — each designed to give you deep insights into a specific dimension of your rental property business.
🎯 Smart Slicers and Filters – Instantly filter your data by location, property type, lease status, tenant type, management type, and more. Drill down into the numbers that matter most to your investment portfolio with just a few clicks.
📉 Comprehensive Chart Library – Visualize your property data through interactive charts such as Total Rent Income by Location, Total Properties by Lease Status, Total Portfolio Value by Property Type, Total NOI by Month, Occupancy Rate by Property Type, and many more.
🏠 Portfolio and Revenue Tracking – Analyze your portfolio composition by management type, property type, and condition while tracking revenue streams by tenant type and lease status. Identify your best-performing properties and highest-earning segments in seconds.
💰 ROI and Investment Analysis – Dedicated ROI Analysis page lets you evaluate investment returns by location, property type, and time period — helping you identify where to invest more and where to cut losses.
🖥️ Professional Design – Clean, modern layout that looks like an enterprise-grade analytics application. Impress stakeholders, partners, and lenders with a polished, executive-level Power BI dashboard.
📦 What’s Inside the Rental Property Investment Dashboard in Power BI
This dashboard contains 5 interactive pages packed with powerful analytics:
📌 Overview Page – High-level KPI cards showing Total Investment, Total Properties, Average Rent, Total Portfolio Value, Total Rent Income, and Occupancy Rate. Charts include Total Rent Income by Location, Total Properties by Lease Status, Total Portfolio Value and Total Investment by Property Type, and Total NOI by Month Name. Multiple slicers are available to quickly filter and analyze your data.
 Rental Property Investment Dashboard in Power BI
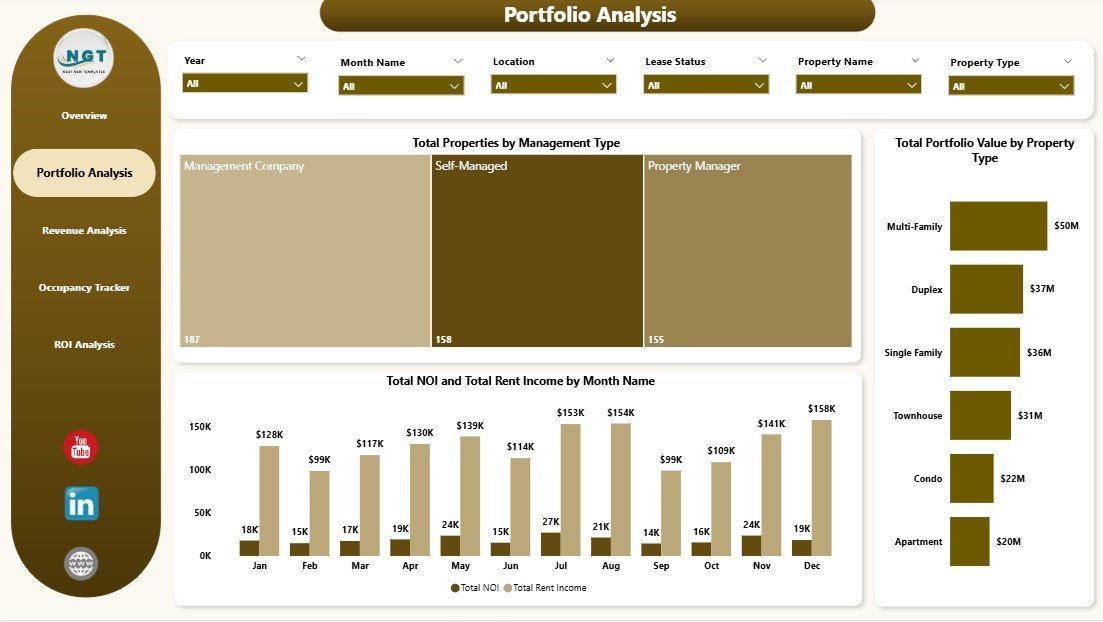
📌 Portfolio Analysis – Breaks down your property portfolio with charts showing Total Properties by Management Type, Total Portfolio Value by Property Type, and Total NOI and Total Rent Income by Month Name. Understand how your portfolio is distributed and which segments drive the most value.
 Portfolio Analysis
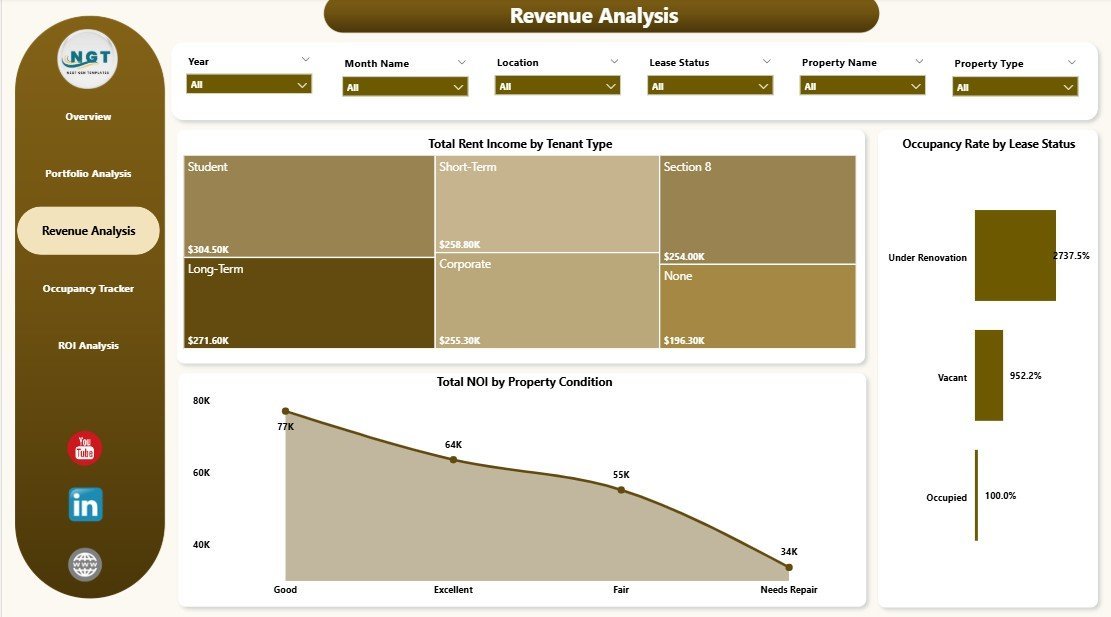
📌 Revenue Analysis – Focuses on income performance with charts for Total Rent Income by Tenant Type, Occupancy Rate by Lease Status, and Total NOI by Property Condition. Quickly see which tenant types and property conditions generate the most revenue.
 Revenue Analysis
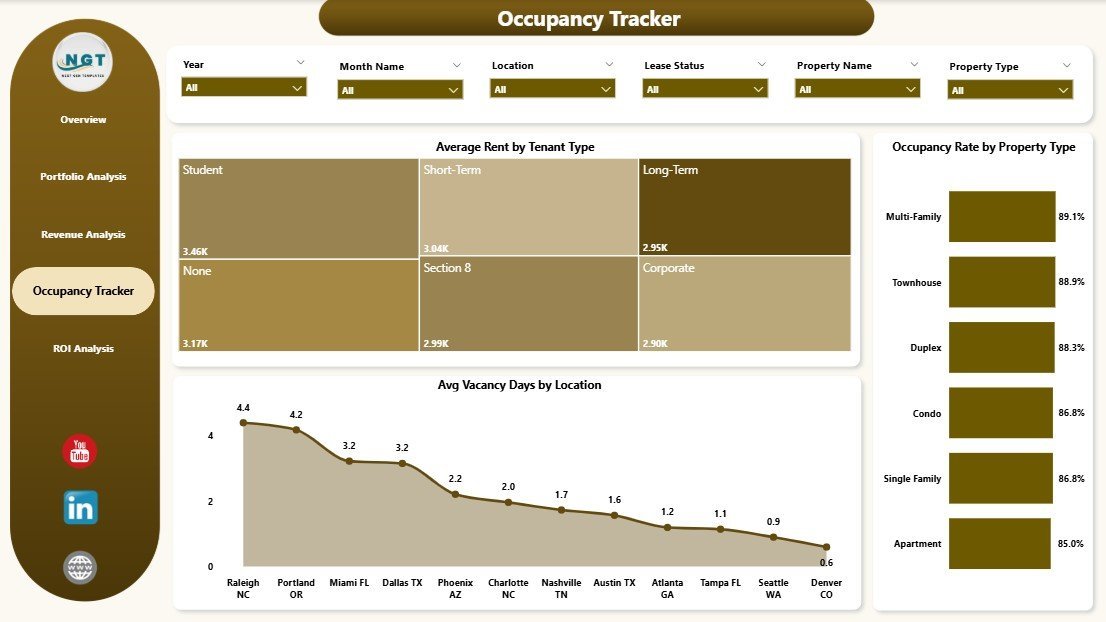
📌 Occupancy Tracker – Monitors occupancy and vacancy trends with charts for Average Rent by Tenant Type, Occupancy Rate by Property Type, and Avg Vacancy Days by Location. Pinpoint underperforming locations and optimize your occupancy strategy.
 Occupancy Tracker
📌 ROI Analysis – Evaluates investment returns with charts showing Total Properties by Location, Total Rent Income by Property Type, and Total Investment by Month Name. Make data-backed decisions on where to expand or consolidate your portfolio.
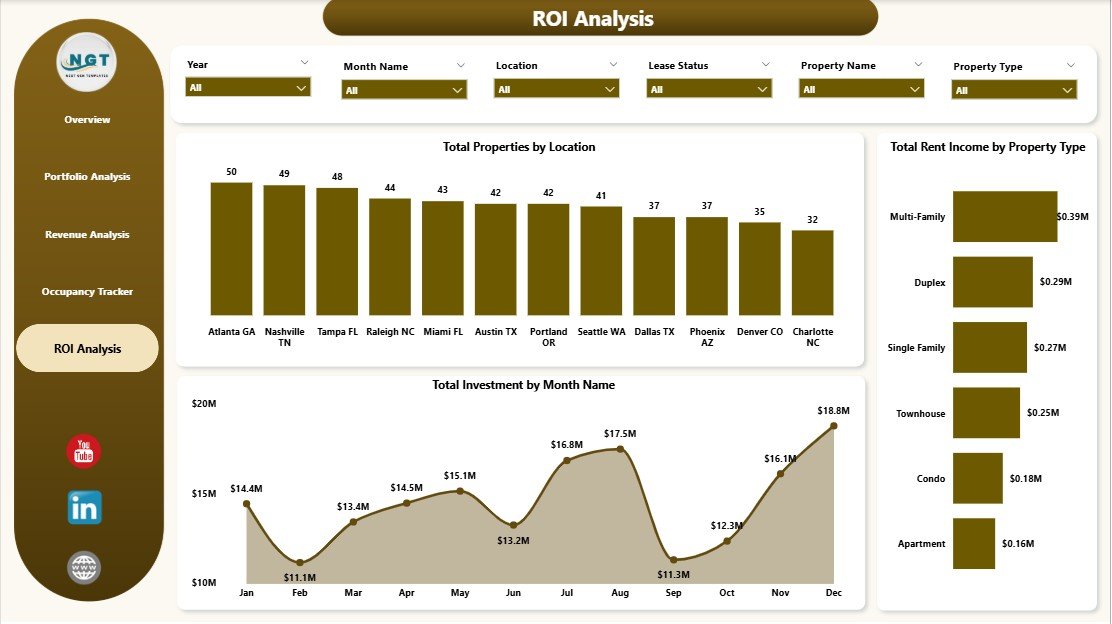 ROI Analysis
⚙️ How to Use the Rental Property Investment Dashboard in Power BI
1️⃣ Download the .pbix file after purchase and unzip it on your computer.
2️⃣ Open the file in Power BI Desktop (free download from Microsoft).
3️⃣ Navigate to the data model and replace the sample data with your own rental property data.
4️⃣ Refresh the data and watch all 5 dashboard pages update automatically with your real numbers.
5️⃣ Use the slicers and filters to drill into specific properties, locations, time periods, and more.
👥 Who Can Benefit from This Rental Property Investment Dashboard in Power BI
🏘️ Property Investors – Track ROI, portfolio value, and rental income across all your investment properties in one place.
🏢 Real Estate Portfolio Managers – Monitor occupancy, vacancy trends, and revenue performance by property type and location.
📋 Landlords and Property Owners – Keep a close eye on rent collection, lease status, and tenant mix without complex spreadsheets.
💼 Real Estate Analysts – Generate presentation-ready dashboards for stakeholders, banks, and partners with real-time property analytics.
🏦 Property Management Companies – Oversee multiple properties and management types with a centralized performance tracking tool.
If you are also looking for a similar dashboard in Excel, check out the Rental Property Investment Dashboard in Excel. For office space analytics, explore the Office Space Leasing KPI Dashboard in Power BI.
❓ Frequently Asked Questions
What KPIs does the Rental Property Investment Dashboard in Power BI track?
The Rental Property Investment Dashboard in Power BI tracks 6 key performance indicators including Total Investment, Total Properties, Average Rent, Total Portfolio Value, Total Rent Income, and Occupancy Rate. These KPIs are displayed as dynamic cards on the Overview page.
Do I need advanced Power BI skills to use this dashboard?
No. This dashboard is designed for all skill levels. Simply open the .pbix file in Power BI Desktop, replace the sample data with your own property data, and all charts, KPIs, and filters update automatically.
How many dashboard pages are included in this template?
This template includes 5 fully interactive dashboard pages: Overview, Portfolio Analysis, Revenue Analysis, Occupancy Tracker, and ROI Analysis. Each page focuses on a different aspect of rental property investment management.
Can I customize the charts and filters in this Power BI dashboard?
Yes. Since this is a .pbix file, you have full editing access in Power BI Desktop. You can add new charts, modify existing visuals, change colors, add calculated measures, and create additional pages to suit your specific needs.
Is Power BI Desktop free to download?
Yes. Power BI Desktop is a free application from Microsoft that you can download from the official Microsoft website. You only need a Power BI Pro license if you want to publish and share dashboards in the Power BI Service online.
What is the best Power BI template for tracking rental property investments?
The Rental Property Investment Dashboard in Power BI from NextGenTemplates is one of the best options available. It includes 5 interactive pages covering portfolio analysis, revenue tracking, occupancy monitoring, and ROI analysis — all in a professionally designed, ready-to-use template.
🔗 Explore Related Templates
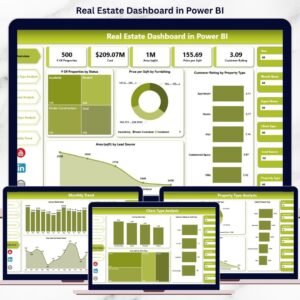
🔹 Rental Property Investment Dashboard in Excel – The Excel version of this dashboard for users who prefer Microsoft Excel.
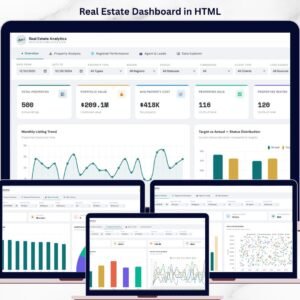
🔹 Real Estate Dashboard in HTML – A browser-based real estate analytics dashboard that works without any software installation.
🔹 Office Space Leasing KPI Dashboard in Power BI – Track commercial office space leasing performance with this dedicated Power BI template.
🔹 Home Affordability Calculator in Excel – A handy calculator for prospective home buyers to evaluate affordability.
Browse all our Power BI Dashboard Templates and Real Estate Templates for more options.
📖 Click here to read the Detailed Blog Post about Rental Property Investment Dashboard in Power BI
🎥 Visit our YouTube channel to learn step-by-step video tutorials
👉 YouTube.com/@NextGenTemplates


Reviews
There are no reviews yet.