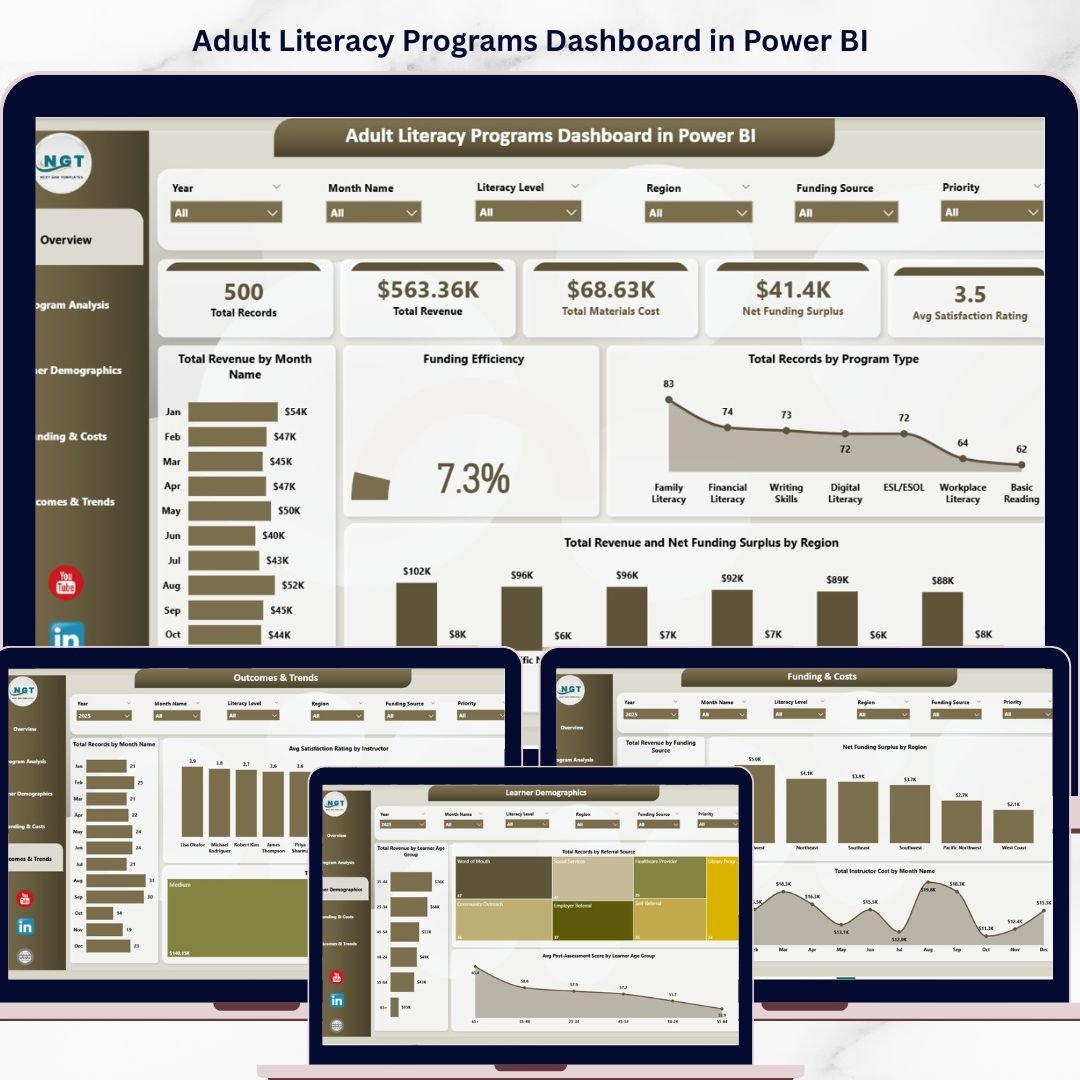


Adult Literacy Programs Dashboard in Power BI is a ready-to-use, interactive analytics template built for literacy organizations, educational institutions, NGOs, community development agencies, and government education departments. This Power BI dashboard transforms raw literacy program data into visually rich and actionable insights — covering revenue performance, materials cost tracking, funding efficiency, learner demographics, program outcomes, and instructor effectiveness across 5 professionally designed dashboard pages.
Whether you manage adult basic education, ESL programs, workplace literacy initiatives, or community reading circles, this Power BI Dashboard Template gives you 360-degree visibility into program performance without requiring advanced technical skills. Simply connect your data source, refresh, and start analyzing instantly.
🔑 Key Features of Adult Literacy Programs Dashboard in Power BI
📊 5 Interactive Dashboard Pages — Overview, Program Analysis, Learner Demographics, Funding & Costs, and Outcomes & Trends provide complete analytical coverage of your literacy programs.
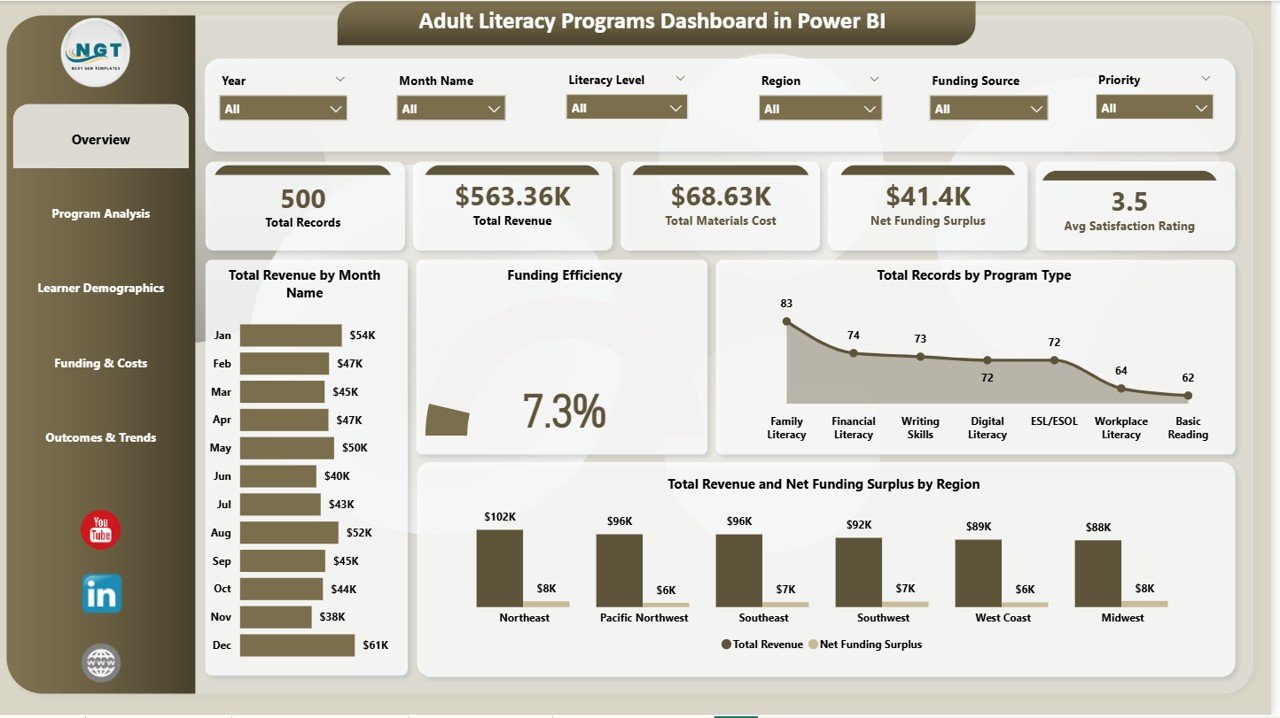
📈 Dynamic KPI Cards — Instantly view Total Records, Total Revenue, Total Materials Cost, Net Funding Surplus, and Avg Satisfaction Rating at the top of the Overview page.
🔍 Smart Slicers & Filters — Filter your entire dashboard by program type, region, literacy level, referral source, and more with one click using interactive Power BI slicers.
📅 Monthly Trend Analysis — Track Total Revenue by Month Name and identify seasonal patterns in enrollment, funding, and program costs.
🎯 Funding Efficiency Tracking — Evaluate how effectively your programs convert funding into outcomes with the dedicated Funding Efficiency chart on the Overview page.
🌍 Regional Performance Comparison — Compare Total Revenue and Net Funding Surplus by Region to identify high-performing and underperforming geographic areas.
👥 Learner Demographics Insights — Analyze enrollment and outcomes by age group, referral source, and post-assessment scores to optimize outreach strategies.
⚡ Automated Power BI Visual Updates — Refresh your dataset and all 5 dashboard pages update automatically with your latest data.
💰 Cost-Effective Solution — Uses Power BI Desktop which is free from Microsoft. No expensive enterprise licenses required to get started.
📦 What’s Inside the Adult Literacy Programs Dashboard in Power BI
This professionally designed template includes 5 interactive dashboard pages covering every aspect of adult literacy program analytics:
 Adult Literacy Programs Dashboard in Power BI
📊 Overview Page — Displays high-level KPI cards including Total Records, Total Revenue, Total Materials Cost, Net Funding Surplus, and Avg Satisfaction Rating. Charts include Total Revenue by Month Name showing monthly revenue trends for budget planning, Funding Efficiency measuring how well funds are being utilized, Total Records by Program Type comparing enrollment across literacy program categories, and Total Revenue and Net Funding Surplus by Region identifying which regions generate the most revenue and retain the highest funding surplus.
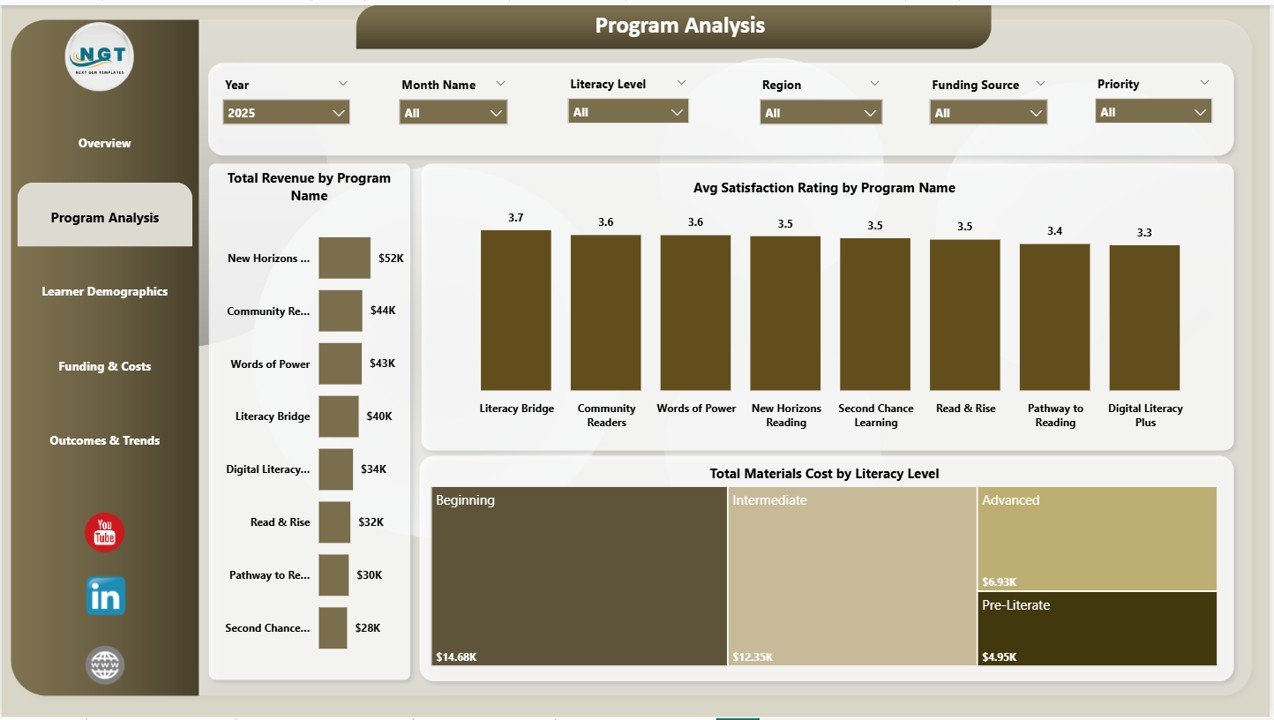 Program Analysis Page
📈 Program Analysis Page — Deep dive into program-level metrics with Total Revenue by Program Name ranking revenue across individual programs, Avg Satisfaction Rating by Program Name identifying which programs deliver the highest learner satisfaction, and Total Materials Cost by Literacy Level revealing spending patterns across beginner, intermediate, and advanced levels.
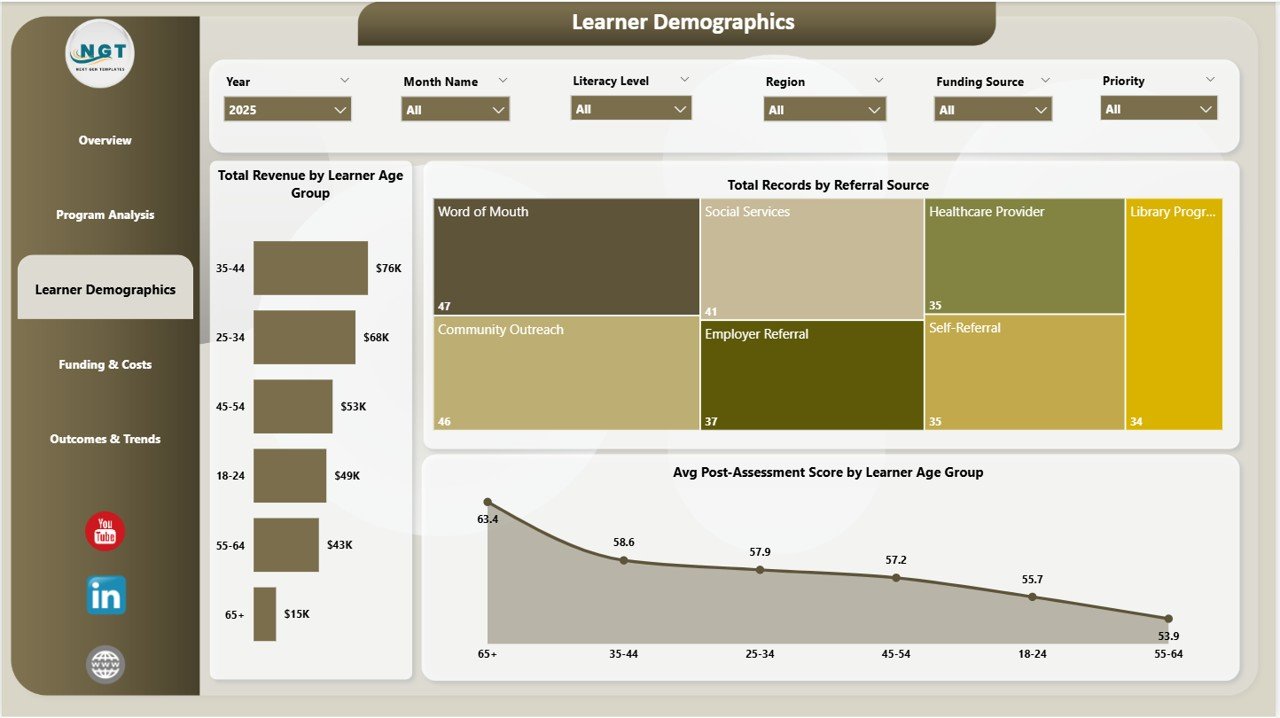 Learner Demographics Page
👥 Learner Demographics Page — Understand your learner population with Total Revenue by Learner Age Group showing enrollment distribution across age brackets, Total Records by Referral Source tracking where learners come from, and Avg Post-Assessment Score by Learner Age Group measuring learning outcomes across demographics.
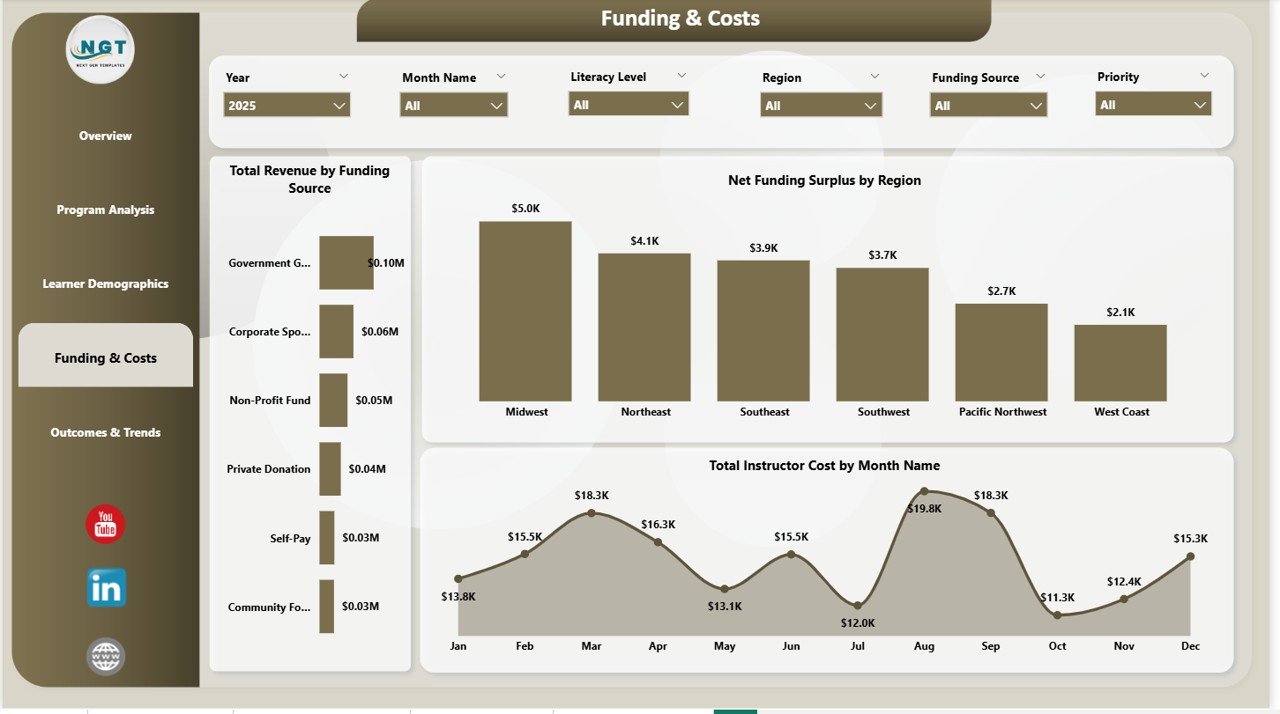 Funding and Costs Page
💰 Funding & Costs Page — Monitor financial health with Total Revenue by Funding Source showing which funding channels contribute most, Net Funding Surplus by Region highlighting financially efficient regions, and Total Instructor Cost by Month Name tracking cost trends over time.
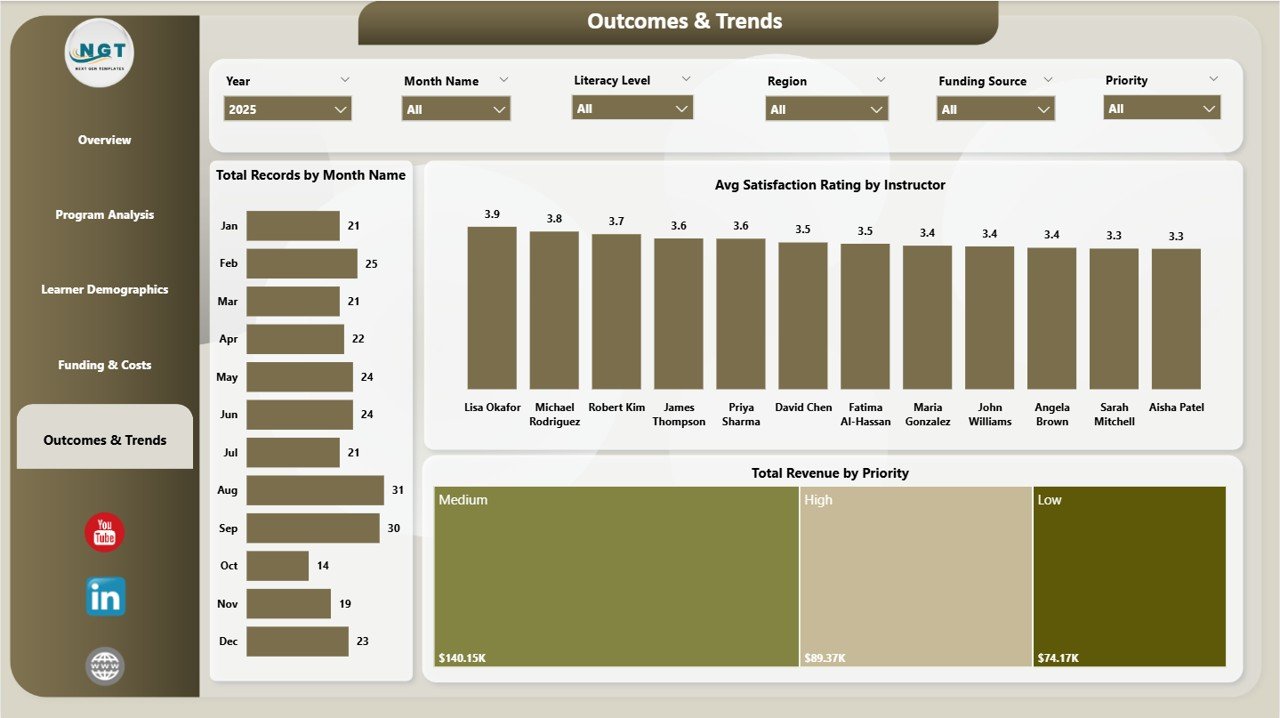 Outcomes and Trends Page
📅 Outcomes & Trends Page — Evaluate program success with Total Records by Month Name tracking enrollment trends over time, Avg Satisfaction Rating by Instructor identifying top-performing instructors, and Total Revenue by Priority understanding revenue distribution by priority level.
⚙️ How to Use the Adult Literacy Programs Dashboard in Power BI
1️⃣ Download and open the .pbix file in Power BI Desktop (free from Microsoft).
2️⃣ Connect or replace the sample data source with your own literacy program dataset.
3️⃣ Click Refresh in Power BI to update all visuals automatically.
4️⃣ Navigate between 5 dashboard pages using the tab navigation at the bottom.
5️⃣ Use slicers on each page to filter by program type, region, age group, funding source, and more.
6️⃣ Review KPI cards and charts to evaluate performance and identify improvement areas.
👥 Who Can Benefit from This Adult Literacy Programs Dashboard in Power BI
📚 Adult Education Centers and Literacy Councils
🏛️ Government Education Departments and Agencies
🌍 International NGOs and Development Organizations
🎓 Community Colleges and Continuing Education Programs
📊 Program Managers and Education Analysts
💰 Grant Managers and Funding Coordinators
👩🏫 Instructors and Training Coordinators
❓ Frequently Asked Questions
What metrics does the Adult Literacy Programs Dashboard in Power BI track?
The Adult Literacy Programs Dashboard in Power BI tracks 5 key metrics including Total Records, Total Revenue, Total Materials Cost, Net Funding Surplus, and Average Satisfaction Rating across 5 interactive dashboard pages covering overview analytics, program analysis, learner demographics, funding and costs, and outcomes and trends.
Do I need advanced Power BI skills to use this template?
No. Simply connect your data source or replace the sample data, click Refresh, and all 5 dashboard pages with charts, KPI cards, and slicers update automatically. No DAX coding or complex modeling is required.
Can I customize the dashboard for my specific literacy programs?
Yes. The dashboard is fully customizable in Power BI Desktop. You can modify program types, regions, literacy levels, funding sources, and other categories in your data source. All visuals will automatically reflect your changes after refreshing.
What Power BI version do I need?
This template works with Power BI Desktop which is available as a free download from Microsoft. You can also publish it to Power BI Service for sharing with your team if you have a Power BI Pro or Premium license.
How is this different from the Excel version?
The Power BI version offers more interactive filtering, automatic visual updates, drill-through capabilities, and the ability to publish and share dashboards online. If you prefer an Excel-based solution, check our Adult Literacy Programs Dashboard in Excel.
🔗 Explore Related Templates
📊 Educational Nonprofits Dashboard in Power BI — Track nonprofit education program performance with interactive Power BI analytics.
📈 Digital Learning KPI Dashboard in Power BI — Monitor digital learning KPIs including course completion, engagement, and training success in Power BI.
🌍 Rural Development KPI Dashboard in Power BI — Track infrastructure, agriculture, and social development KPIs with MTD, YTD, and target comparison.
📖 Click here to read the Detailed Blog Post
🎥 Visit our YouTube channel to learn step-by-step video tutorials
👉 YouTube.com/@NextGenTemplates
Watch the step-by-step video tutorial:
YouTube


Reviews
There are no reviews yet.