
Are you still struggling with scattered reports and endless spreadsheets to track business performance? It’s time to upgrade your decision-making with a smarter, faster, and more powerful solution.
👉 Introducing the Benchmarking and Insights Dashboard in Power BI — your all-in-one analytics tool to compare performance, track KPIs, and uncover growth opportunities instantly.
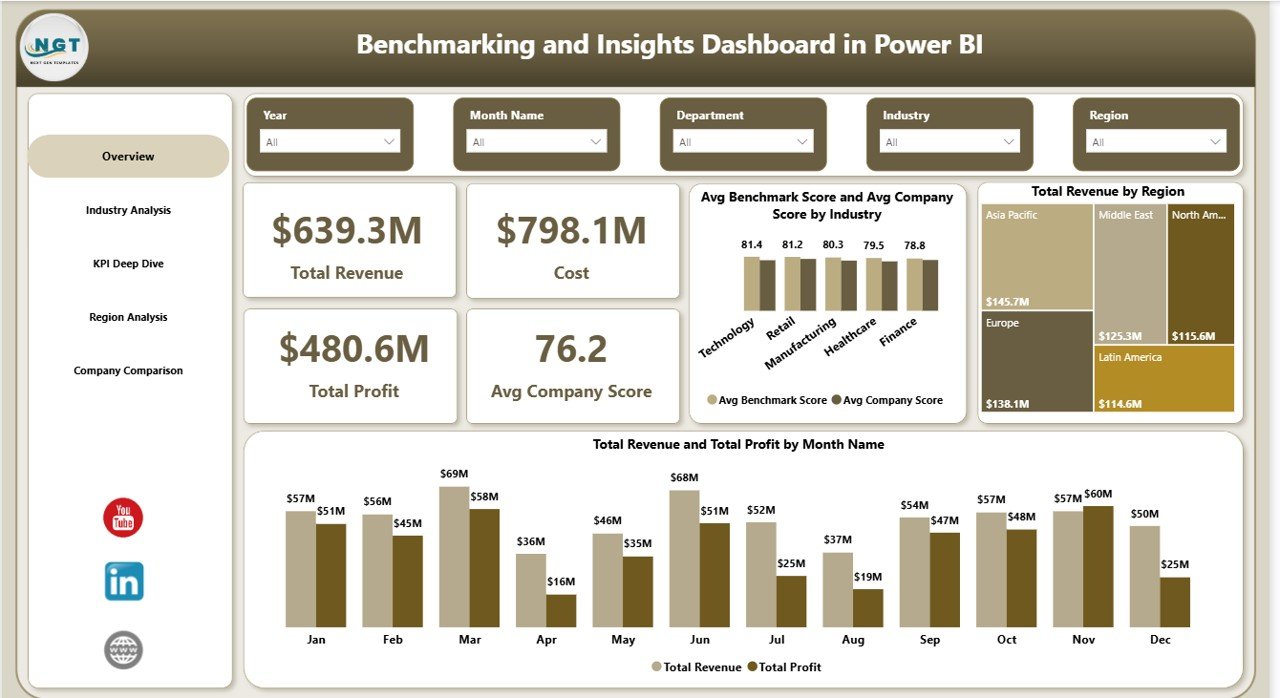
This professionally designed dashboard transforms complex data into clear, actionable insights. Whether you want to analyze revenue, profit, cost, or benchmark scores, everything is available in one centralized view. As a result, you can make confident decisions without wasting time on manual reporting.
🚀 Key Features of Benchmarking and Insights Dashboard in Power BI
✨ Interactive Overview Dashboard – Get a quick snapshot of Total Revenue, Cost, Profit, and Average Company Score at a glance.
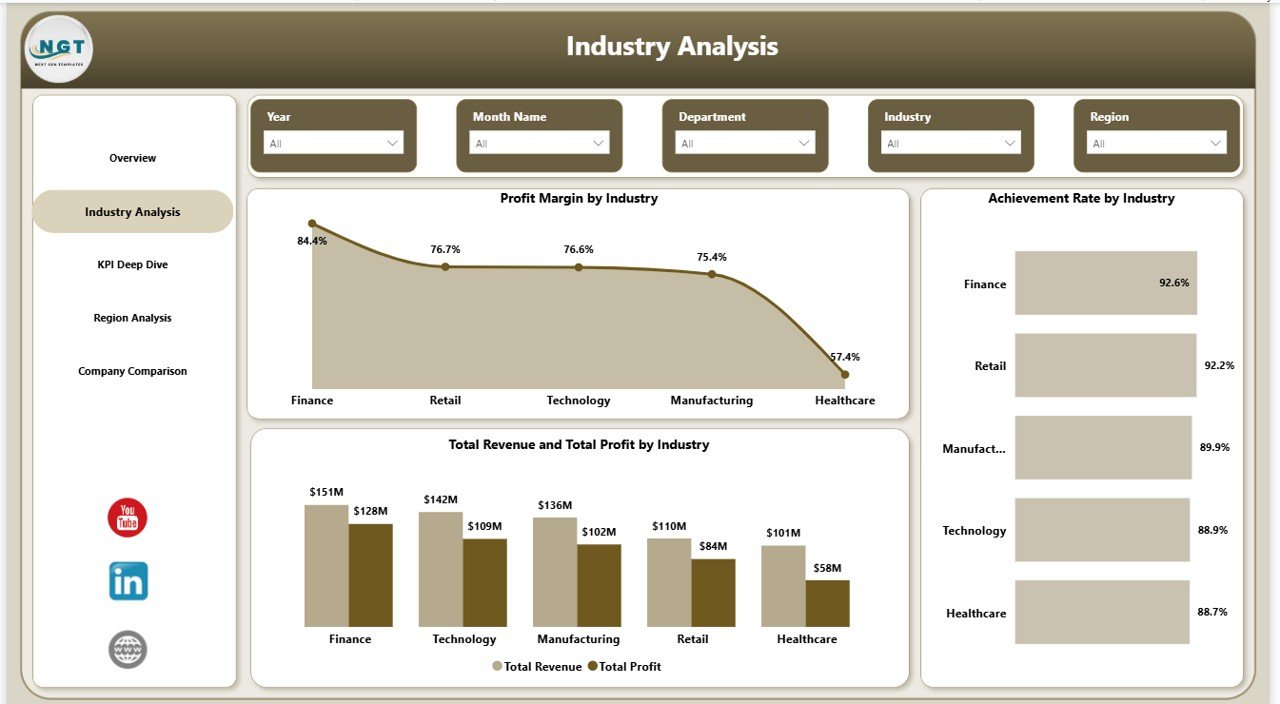
📊 Industry-Level Analysis – Compare profit margin, achievement rate, and performance across industries.
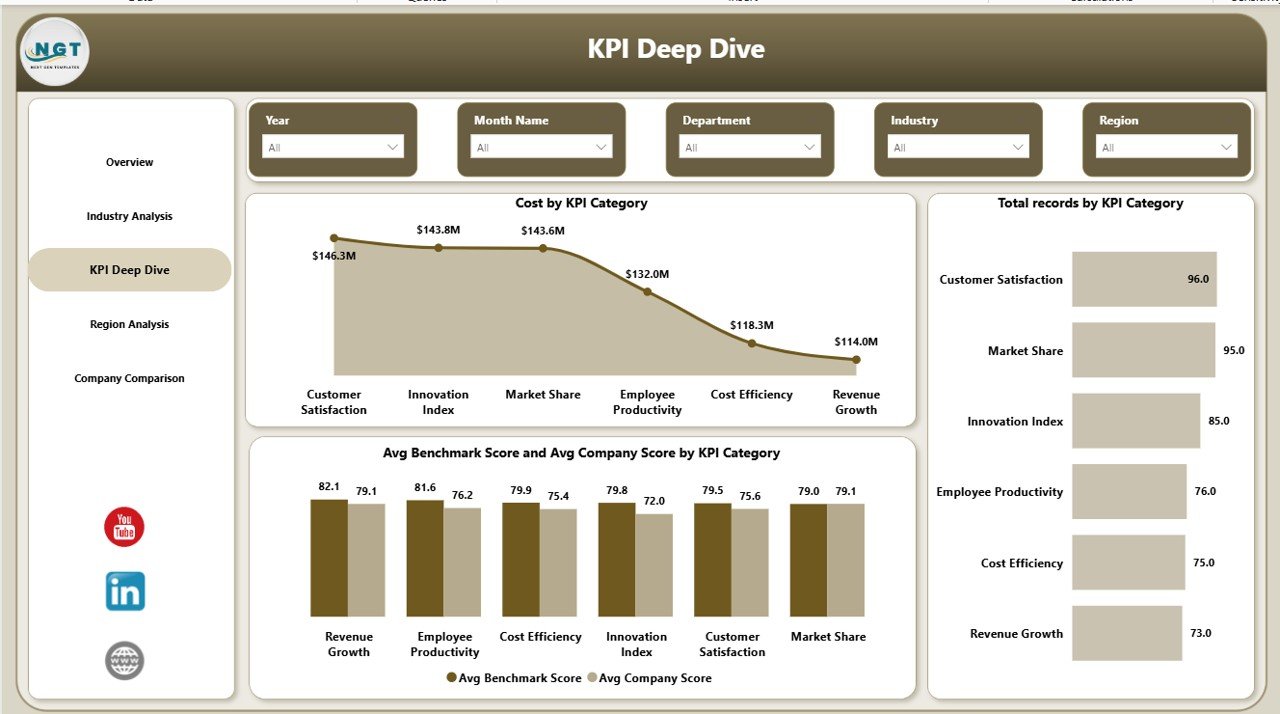
📈 KPI Deep Dive Insights – Analyze KPI categories, track costs, and evaluate performance against benchmarks.
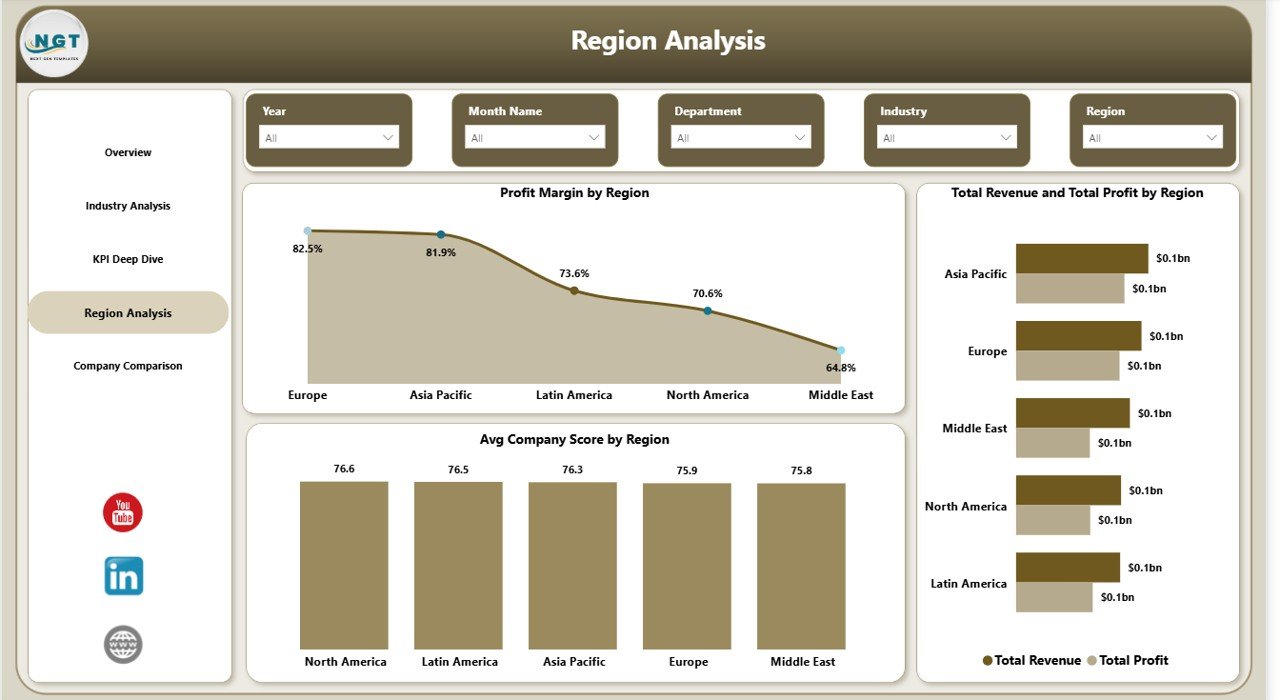
🌍 Region-Based Performance Tracking – Identify high-performing regions and optimize strategies effectively.
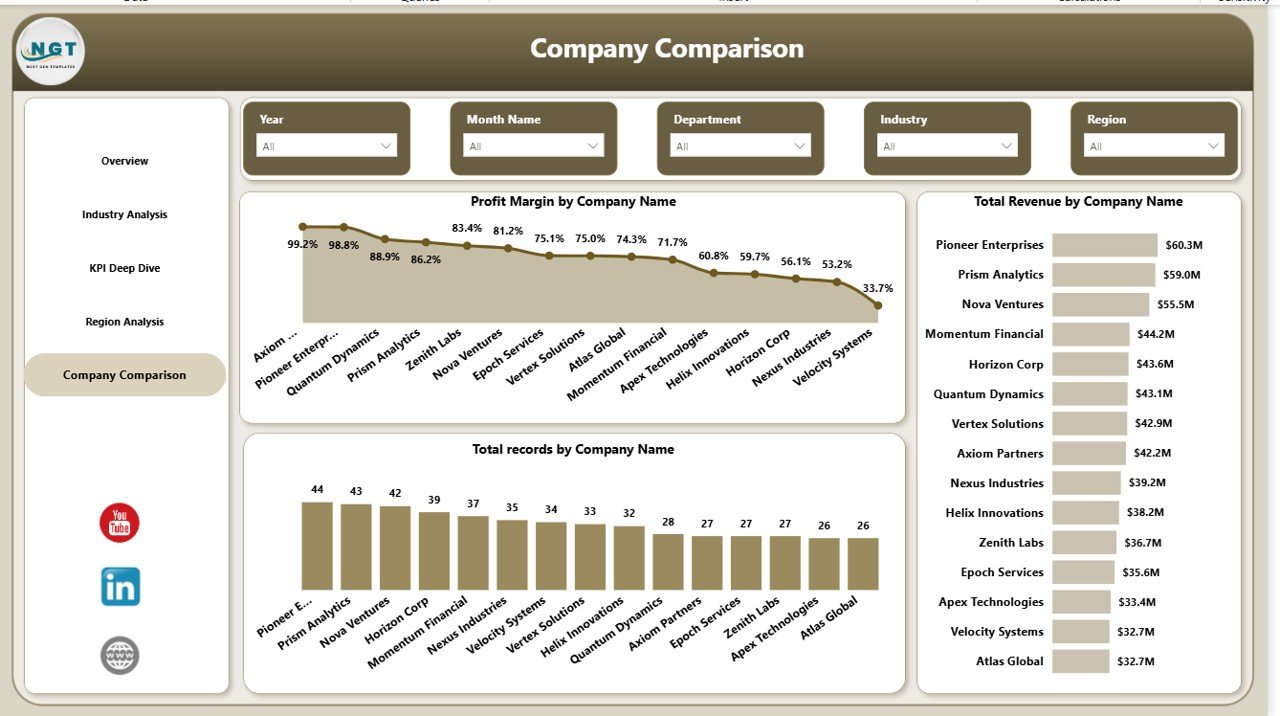
🏢 Company Comparison Analysis – Benchmark your company against competitors with ease.
🎯 Advanced Slicers & Filters – Instantly filter data by industry, region, and KPI category.
⚡ Real-Time Data Refresh – Keep your insights updated with simple refresh functionality.
📉 Trend Analysis Visuals – Monitor revenue and profit trends over time.
📂 What’s Inside the Benchmarking and Insights Dashboard in Power BI
This dashboard includes 5 powerful and fully interactive pages designed for deep analysis:
📌 Overview Page
Get high-level KPIs and performance summary with visual comparisons.
📌 Industry Analysis Page
Compare performance across industries and identify profitable sectors.
📌 KPI Deep Dive Page
Analyze KPI categories, costs, and performance benchmarks in detail.
📌 Region Analysis Page
Track performance across different regions and optimize resource allocation.
📌 Company Comparison Page
Compare companies and benchmark your business against competitors.
🛠️ How to Use the Benchmarking and Insights Dashboard in Power BI
Using this dashboard is simple and beginner-friendly:
1️⃣ Upload or connect your dataset
2️⃣ Open the Power BI file
3️⃣ Click on Refresh to update data
4️⃣ Use slicers to filter by region, KPI, or industry
5️⃣ Explore each page for detailed insights
6️⃣ Analyze trends and benchmark performance
7️⃣ Take data-driven actions to improve results
Within minutes, you’ll have a complete understanding of your business performance.
👥 Who Can Benefit from This Benchmarking and Insights Dashboard in Power BI
This dashboard is perfect for:
👨💼 Business Analysts who need detailed performance insights
📊 Managers looking to track KPIs and optimize operations
🏢 Company Owners aiming to improve profitability
📈 Executives making strategic decisions
💼 Consultants analyzing multiple industries and companies
Whether you are a small business or a large enterprise, this dashboard helps you stay competitive and data-driven.
With this dashboard, you no longer need multiple reports or manual calculations. Everything is automated, visualized, and easy to understand. As a result, you save time, improve accuracy, and make faster decisions.
So, if you want to benchmark performance, identify opportunities, and stay ahead of competitors, this dashboard is exactly what you need.


