



Key Features of Biodegradable Packaging Dashboard in Excel
Unlock powerful insights with our Biodegradable Packaging Dashboard in Excel, a ready-to-use, dynamic digital tool designed to simplify your packaging data analysis. Simply update your data in the Data Sheet and refresh the dashboard with one click from the Excel Ribbon. This dashboard refreshes instantly, giving you real-time insights in seconds.
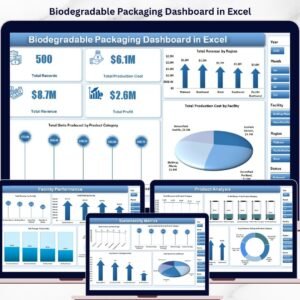
Experience multiple interactive pages that provide comprehensive views of your packaging operations, including production costs, revenue, sustainability metrics, product performance, and facility analysis. The dashboard is loaded with intuitive visualizations, slicers, and pivot tables, enabling you to filter and analyze data quickly and effectively.
Key features include:
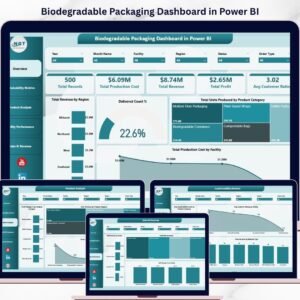
- 📊 Overview Page: High-level cards display Total Records, Total Production Cost, Total Revenue, and Total Profit. Interactive charts visualize Total Revenue by Region, Production Cost by Facility, and Units Produced by Product Category for at-a-glance performance tracking.
- 🌱 Sustainability Metrics: Dive into eco-friendly packaging data with charts showing Total Records by Material Type, Average Sustainability Score by Product, Customer Ratings by Facility, and Certification counts for greener decision-making.
- 📈 Product Analysis: Analyze Total Revenue and Profit Margin % by Product Category, Units Sold by Material Type, and Customer Ratings to understand product demand and profitability deeply.
- 🏭 Facility Performance: Assess Total Revenue, Profit, Sell-Through %, and Sustainability Scores by facility to optimize operational efficiency and environmental impact.
- 💰 Sales & Revenue: Track monthly revenue trends, revenue by order type, and profit margins by region to sharpen your sales strategies.
- 🗂️ Data Sheet: A clean, organized template where all raw data is entered for seamless dashboard updates.
- 🔧 Support Sheet: Hidden pivot tables that power the dashboard, ensuring smooth, dynamic data refreshes every time.
What’s Inside the Biodegradable Packaging Dashboard in Excel
This comprehensive dashboard includes multiple pages tailored to your business needs:

Overview Page: At the top, four key cards show critical metrics like Total Records, Production Cost, Revenue, and Profit. The page features interactive charts that break down revenue by region, production cost by facility, and units produced by product category. Filter data effortlessly using multiple slicers.
Sustainability Metrics: Visualize your sustainability efforts with charts on material types, sustainability scores, customer ratings, and certifications.
Product Analysis: Explore revenue, profit margins, units sold, and customer ratings by product category and material type.
Facility Performance: Analyze revenue, profit, sell-through rate, and sustainability scores across your production facilities.
Sales & Revenue: Evaluate monthly revenue trends, revenue by order type, and profit margins by region to inform sales strategies.
Data Sheet Tab: Store your raw data in a structured format to ensure flawless dashboard updates.
Support Sheet: Contains multiple pivot tables that dynamically drive the dashboard’s functionality; this sheet can be hidden for clean user experience.
How to Use the Biodegradable Packaging Dashboard in Excel
Using this dashboard is simple and user-friendly:
- 📝 Update Your Data: Enter or paste your packaging data into the Data Sheet tab in the exact format provided.
- 🔄 Refresh Dashboard: Go to the Excel Ribbon, click on the Data tab, and select Refresh All. This updates all pivot tables and charts dynamically, reflecting your latest data.
- 🎯 Analyze with Filters: Use slicers on various pages to filter data by region, product category, facility, and other parameters for targeted insights.
- 📊 Explore Pages: Navigate through Overview, Sustainability, Product Analysis, Facility Performance, and Sales & Revenue tabs to get a comprehensive view of your packaging data.
- 🔒 Keep Support Sheet Hidden: To avoid accidental changes, keep the Support Sheet hidden; it powers the dashboard seamlessly behind the scenes.
Who Can Benefit from This Biodegradable Packaging Dashboard in Excel
This dashboard is a must-have tool for anyone in the biodegradable packaging industry or related sectors:
- 🏢 Manufacturers: Track production costs, revenue, and sustainability scores to optimize operations and reduce environmental impact.
- 🌿 Sustainability Managers: Monitor eco-friendly material usage, certifications, and customer ratings for greener product lines.
- 📈 Sales & Marketing Teams: Analyze sales trends by region, product, and order types to strategize and boost revenue.
- 👨💼 Executives & Decision Makers: Access high-level dashboards for quick, data-driven decisions that improve profitability and sustainability.
- 📊 Consultants & Analysts: Use the dashboard to present clear, actionable insights to clients in the biodegradable packaging sector.
Click here to read the Detailed blog post.
Visit our YouTube channel to learn step-by-step video tutorials
Watch the step-by-step video tutorial:
Compatibility and Requirements
- Works in Microsoft Excel desktop (Excel 2016 or later, or Microsoft 365).
- The dashboard uses slicers and pivot tables to filter the data. Microsoft explains them in Use slicers to filter data.
Frequently Asked Questions
Which pages does the dashboard include?
It has an Overview page, Sustainability Metrics, Product Analysis, Facility Performance and Sales & Revenue pages. A Data Sheet holds your raw data and a Support Sheet holds the pivot tables behind the charts.
How do I update the dashboard with my own data?
Enter or paste your packaging data into the Data Sheet in the same format. Then open the Data tab on the Excel Ribbon and click Refresh All.
Can I filter the data?
Yes. Slicers on the pages let you filter by region, product category, facility and other fields.
What sustainability data can I track?
The Sustainability Metrics page shows records by material type, average sustainability score by product, customer ratings by facility and certification counts.
Is there a Power BI version?
Yes. See the Biodegradable Packaging Dashboard in Power BI.
Related Packaging Templates
- Biodegradable Packaging Dashboard in Power BI: the same topic in Power BI
- Packaging Sustainability KPI Dashboard in Excel: sustainability KPIs for packaging
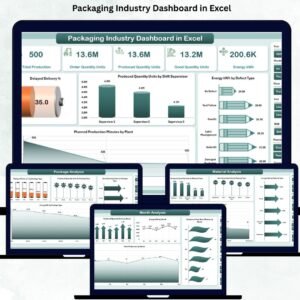
- Packaging Industry Dashboard in Excel: a wider view of packaging operations
- Food Packaging KPI Dashboard in Excel: KPIs for food packaging
- Manufacturing Dashboard in Excel: production tracking for manufacturers
Browse all Excel dashboards.





















Reviews
There are no reviews yet.