🚀 Take Control of Bridge Maintenance Like Never Before!
Managing bridge maintenance data across multiple sources can be overwhelming and time-consuming. But what if you could monitor everything in one powerful, interactive dashboard?
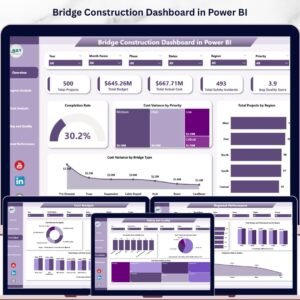
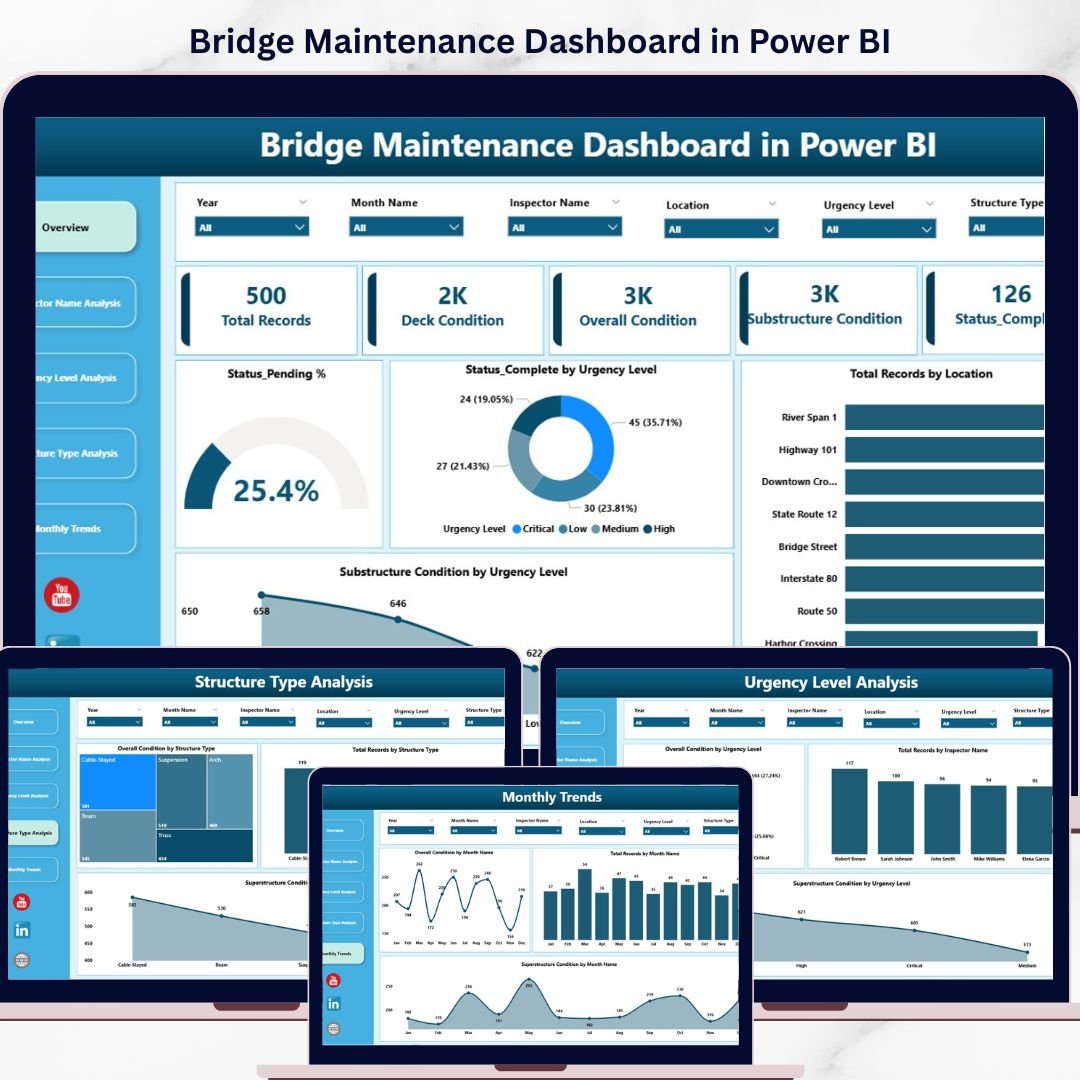
👉 The Bridge Maintenance Dashboard in Power BI is your all-in-one solution to track, analyze, and optimize bridge maintenance operations with ease. Designed for engineers, inspectors, and infrastructure managers, this ready-to-use dashboard transforms complex data into actionable insights—helping you make smarter, faster decisions.
With just a simple data refresh, you can instantly visualize bridge conditions, maintenance status, urgency levels, and performance trends. No complex setup, no manual reporting—just clear insights at your fingertips.
🔑 Key Features of Bridge Maintenance Dashboard in Power BI
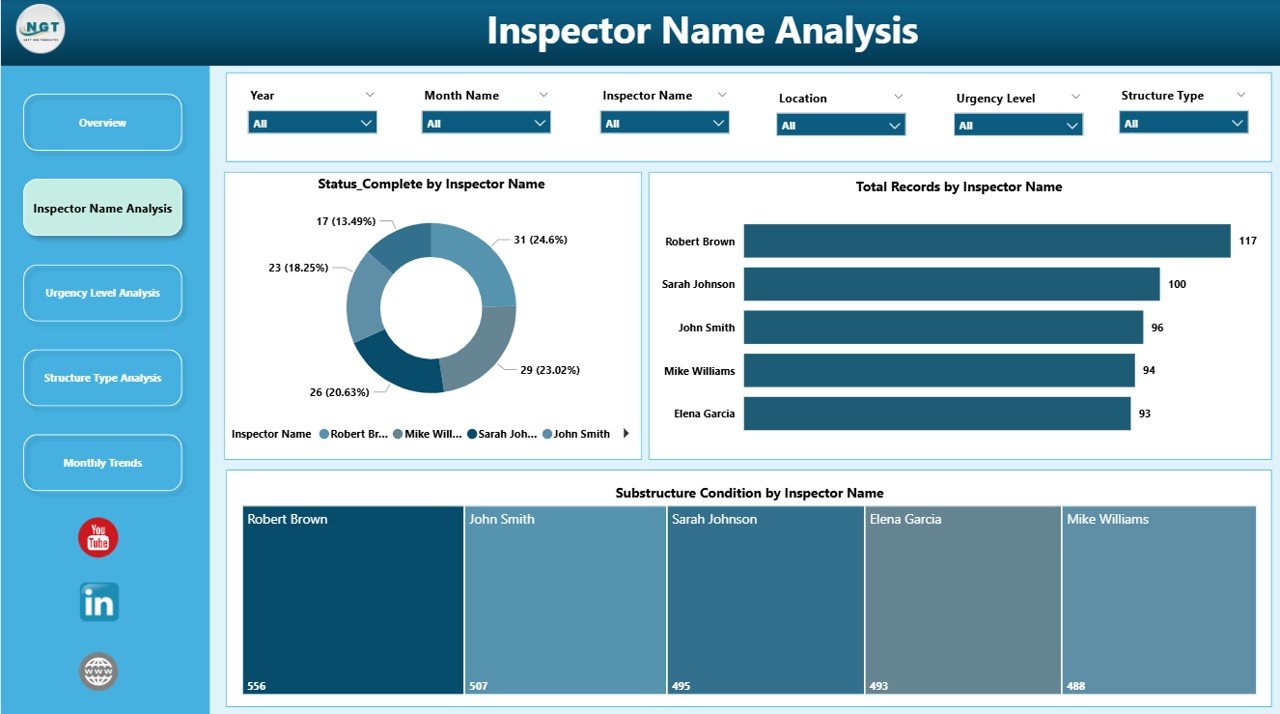
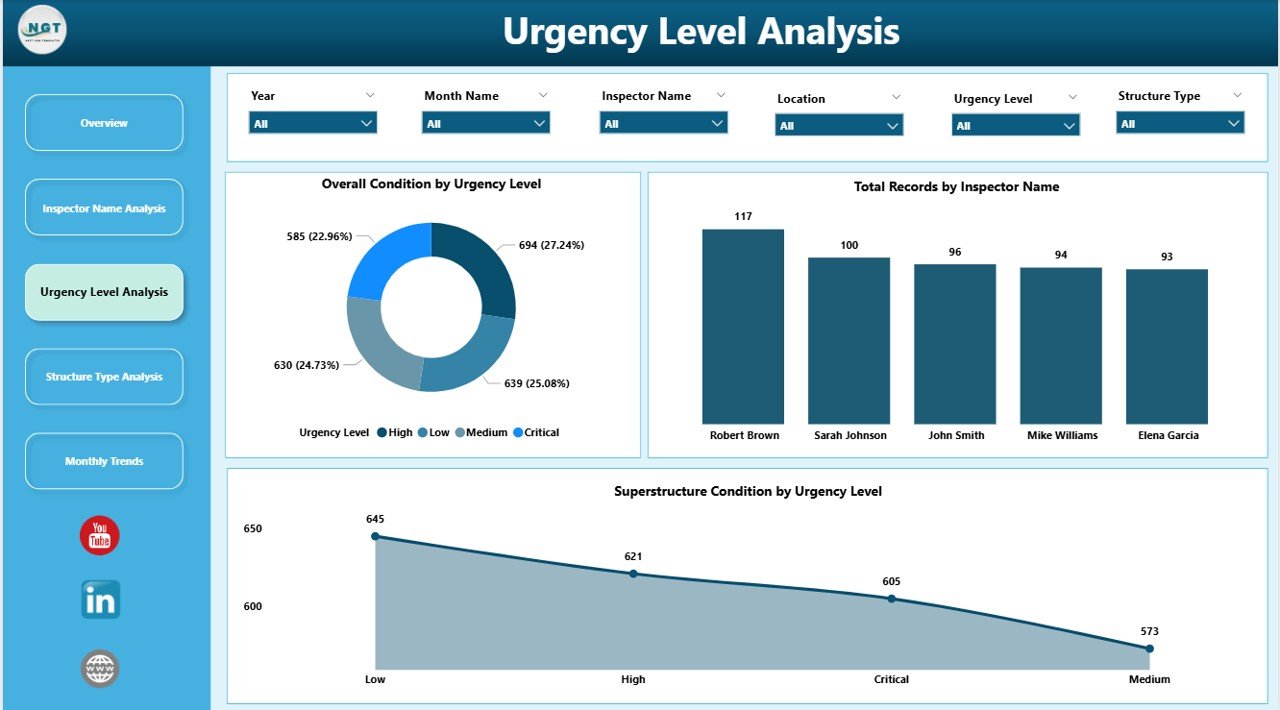
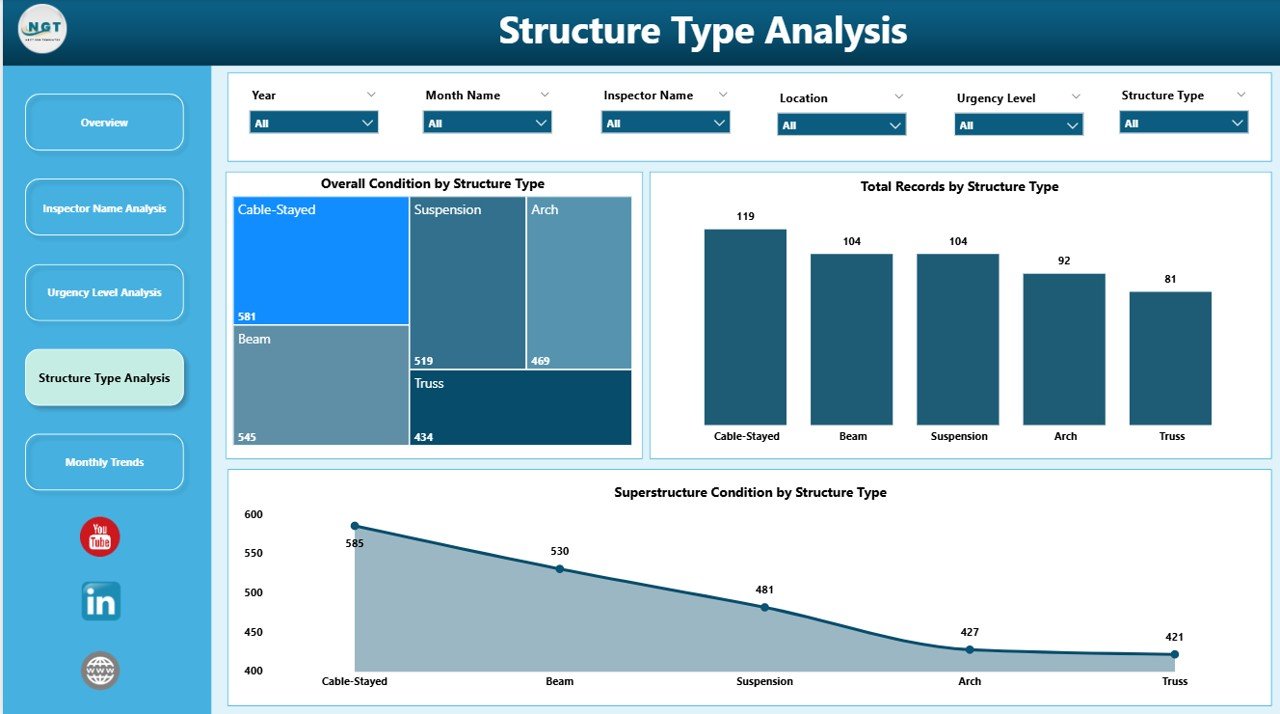
✨ Interactive Multi-Page Dashboard – Analyze data across Overview, Inspector, Urgency, Structure Type, and Monthly Trends pages.
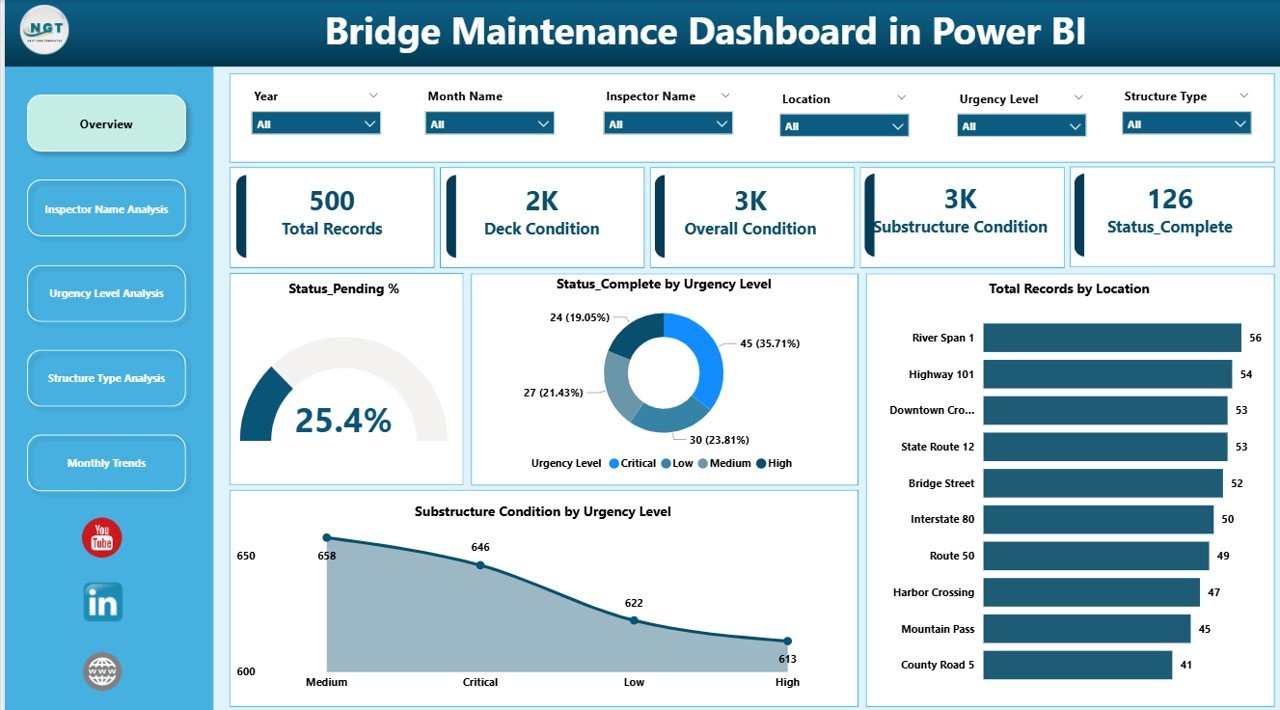
📊 Powerful KPI Cards – Instantly view Total Records, Deck Condition, Overall Condition, and Substructure Condition.
🎯 Advanced Filtering with Slicers – Easily filter data by inspector, urgency level, and structure type.
📈 Dynamic Visualizations – Track trends, compare performance, and identify maintenance gaps using charts.
🔍 Drill-Down Analysis – Dive deeper into data for detailed insights and better decision-making.
⚡ Quick Data Refresh – Update your dataset and refresh to get real-time insights instantly.
📍 Location-Based Insights – Identify areas needing urgent maintenance with geographic analysis.
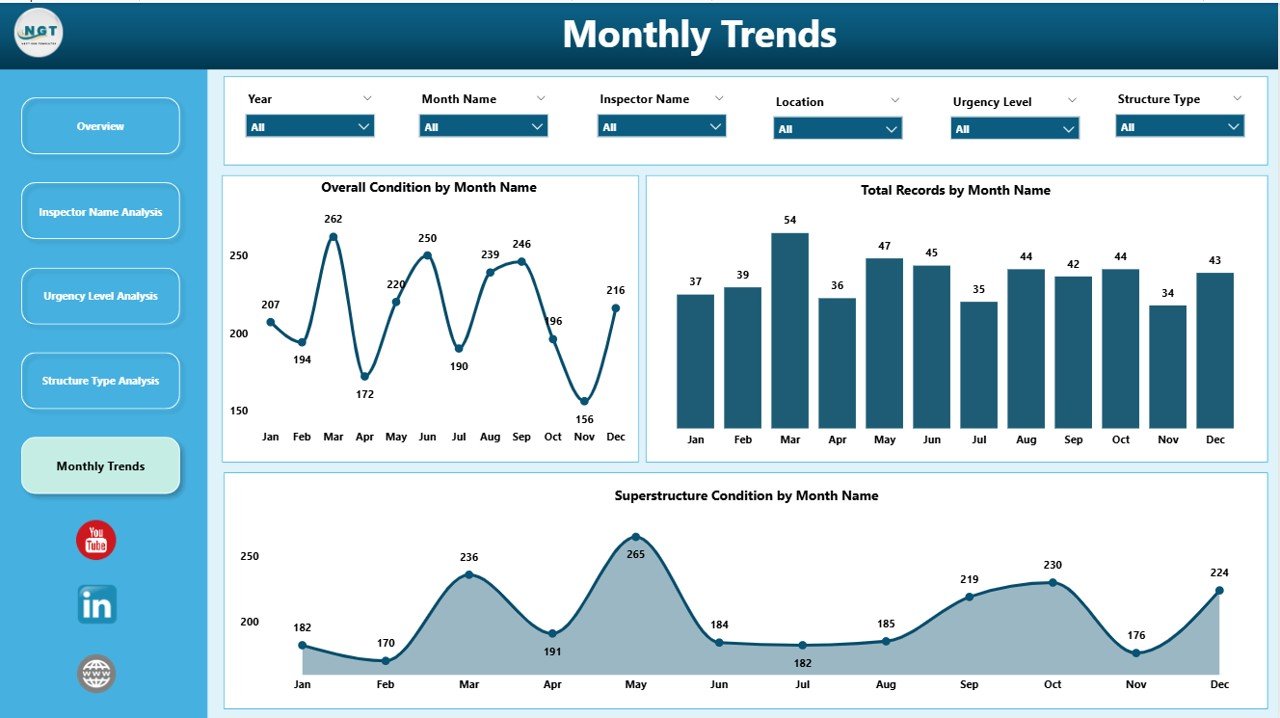
📅 Trend Analysis – Monitor monthly performance and detect patterns over time.
📦 What’s Inside the Bridge Maintenance Dashboard in Power BI
📁 5 Fully Interactive Dashboard Pages
- Overview Dashboard
- Inspector Name Analysis
- Urgency Level Analysis
- Structure Type Analysis
- Monthly Trends
📊 Pre-Built Charts & KPIs
- Status Pending %
- Completed Tasks by Urgency
- Records by Location
- Condition Analysis by Multiple Dimensions
🎛️ User-Friendly Slicers & Filters
- Filter by Inspector
- Filter by Urgency Level
- Filter by Structure Type
📂 Ready-to-Use Power BI File
- Fully designed and formatted
- Plug-and-play structure
- No advanced setup required
⚙️ How to Use the Bridge Maintenance Dashboard in Power BI
1️⃣ Open the Power BI file provided after download
2️⃣ Connect or replace with your own bridge maintenance dataset
3️⃣ Click on Refresh to update the dashboard instantly
4️⃣ Use slicers to filter and explore specific data segments
5️⃣ Analyze KPIs, charts, and trends to make data-driven decisions
💡 No advanced Power BI skills required—this dashboard is built for simplicity and efficiency.
👥 Who Can Benefit from This Bridge Maintenance Dashboard in Power BI
👷 Civil Engineers – Monitor bridge conditions and maintenance performance
🏗️ Infrastructure Managers – Optimize maintenance planning and resource allocation
🔍 Inspectors & Field Teams – Track inspections and task completion efficiently
🏢 Government Authorities – Improve infrastructure safety and reporting
📊 Data Analysts – Perform deep analysis and generate actionable insights
This dashboard not only simplifies data analysis but also enhances decision-making by highlighting critical maintenance issues. As a result, you can reduce risks, improve efficiency, and ensure the long-term safety of bridge infrastructure.
📖 Click here to read the Detailed blog post
🎥 Visit our YouTube channel to learn step-by-step video tutorials
👉 https://youtube.com/@PKAnExcelExpert