In the fast-moving auction industry, staying ahead of competitors requires more than just managing bids—it requires data-driven decision-making. Auction houses deal with multiple auctions, bidders, categories, and fluctuating prices. However, when this data is scattered across spreadsheets, it becomes difficult to track performance and uncover valuable insights.
👉 So, how can you simplify auction management and boost profitability effortlessly?
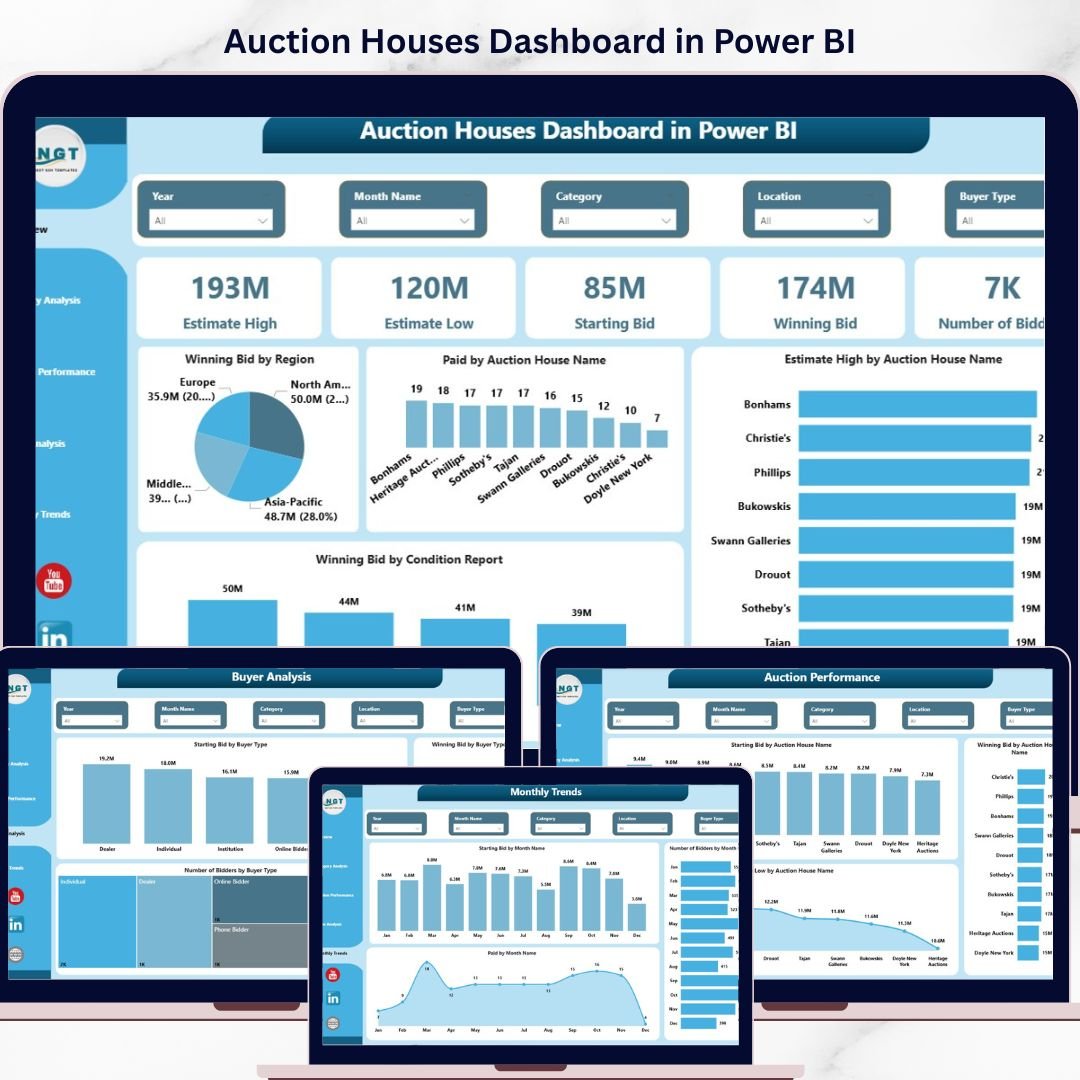
🚀 The answer is the Auction Houses Dashboard in Power BI.
This powerful and interactive dashboard transforms complex auction data into clear, actionable insights. As a result, auctioneers, analysts, and business owners can make faster, smarter, and more profitable decisions.
🔑 Key Features of Auction Houses Dashboard in Power BI
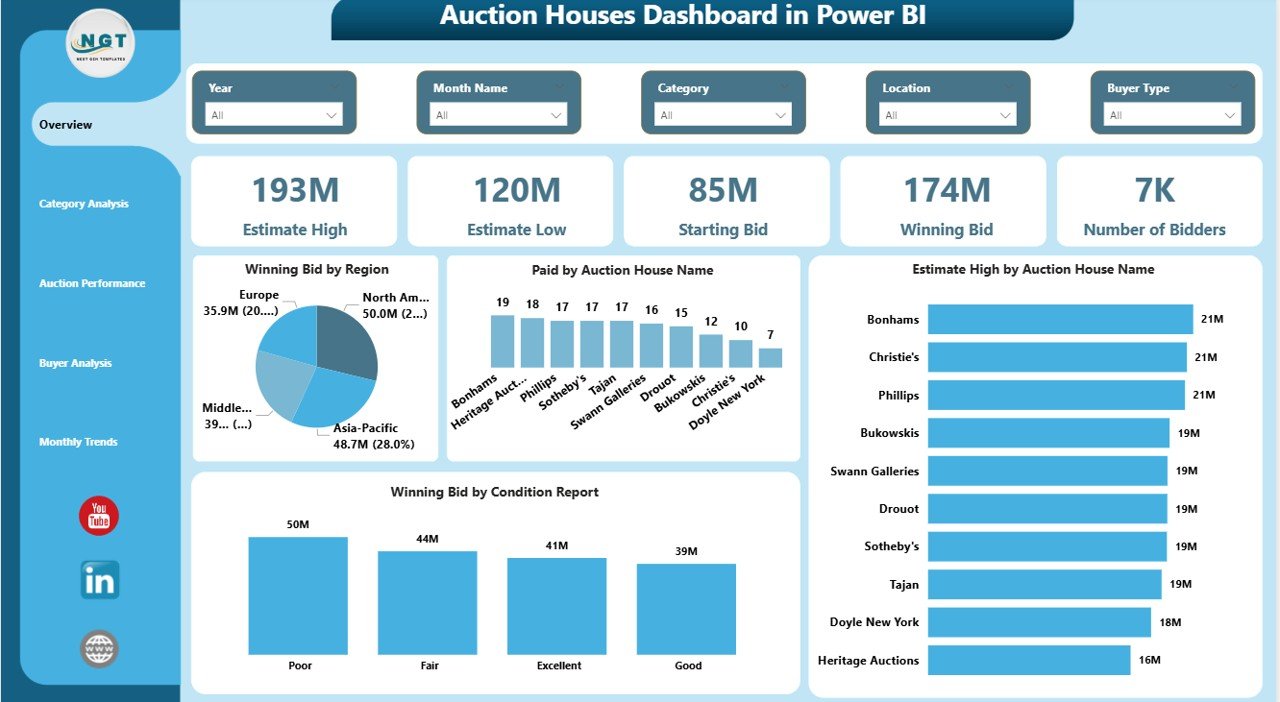
✨ 📊 Interactive Overview Dashboard – Instantly view key KPIs like Estimate High, Starting Bid, Winning Bid, and Number of Bidders.
✨ 🌍 Region & Auction Insights – Analyze winning bids by region and evaluate auction house performance easily.
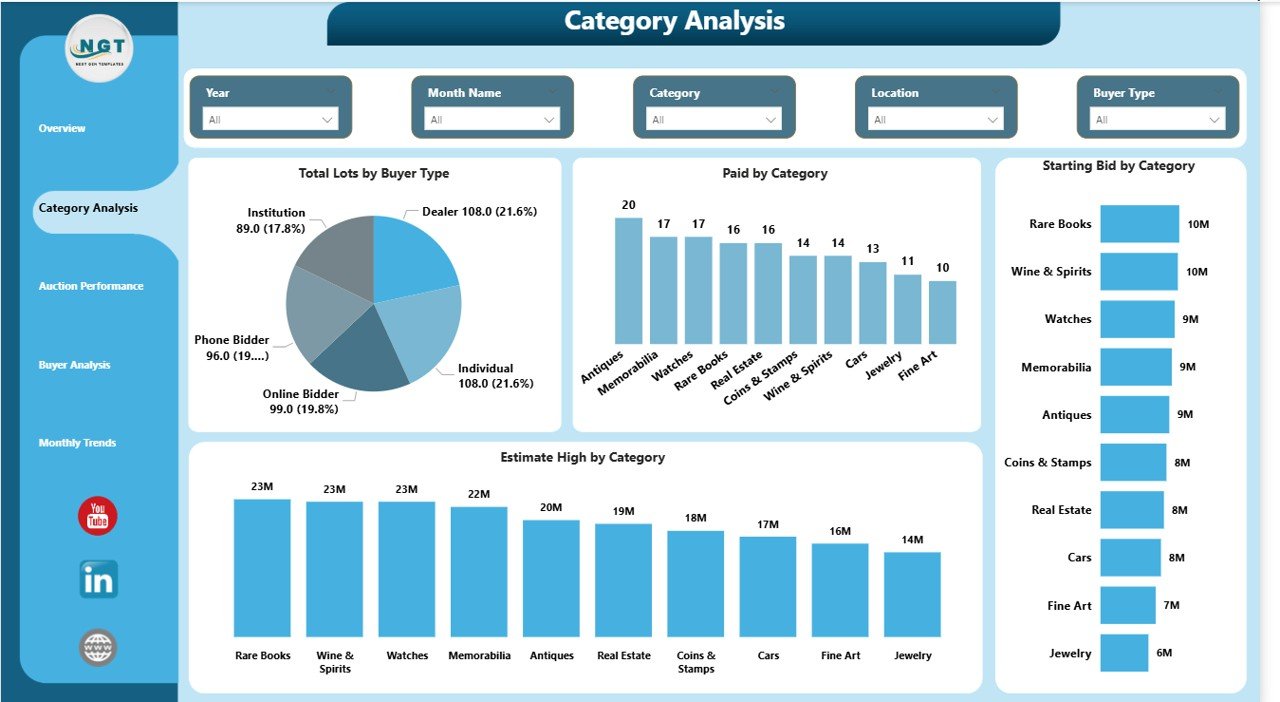
✨ 📦 Category Performance Analysis – Identify top-performing categories and optimize your auction inventory.
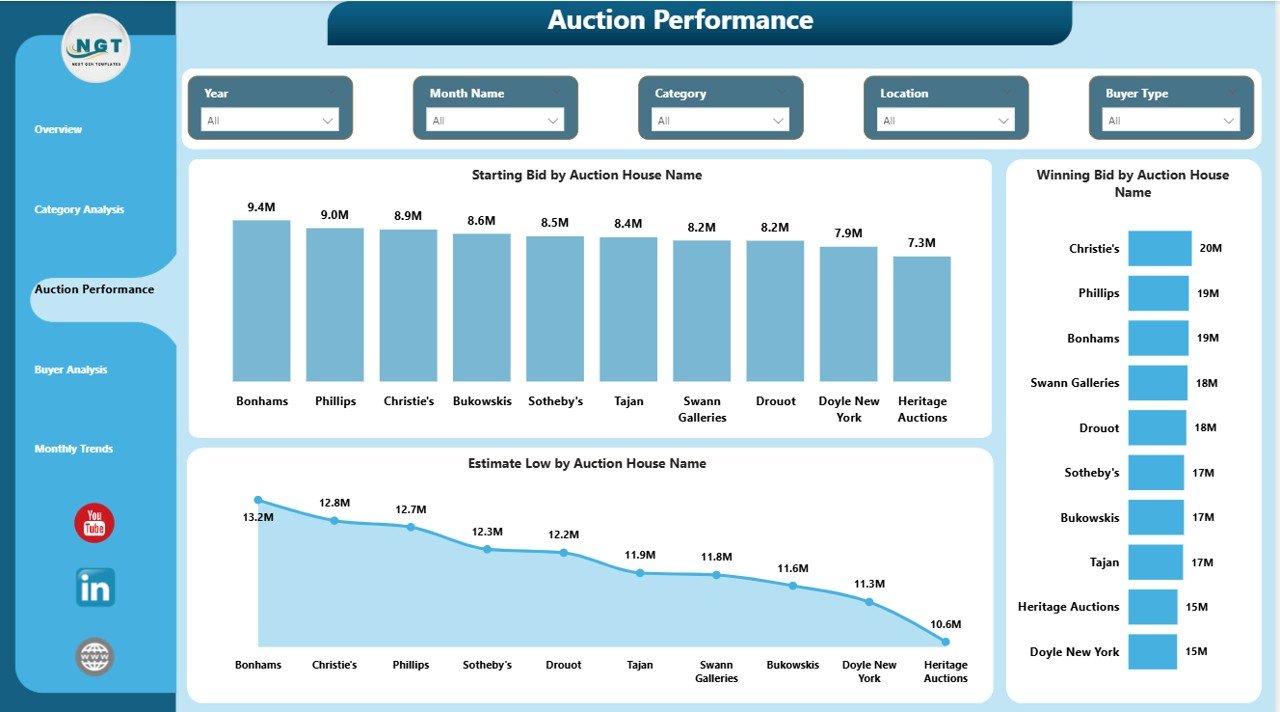
✨ 🏆 Auction Performance Tracking – Compare auctions and uncover high-performing events.
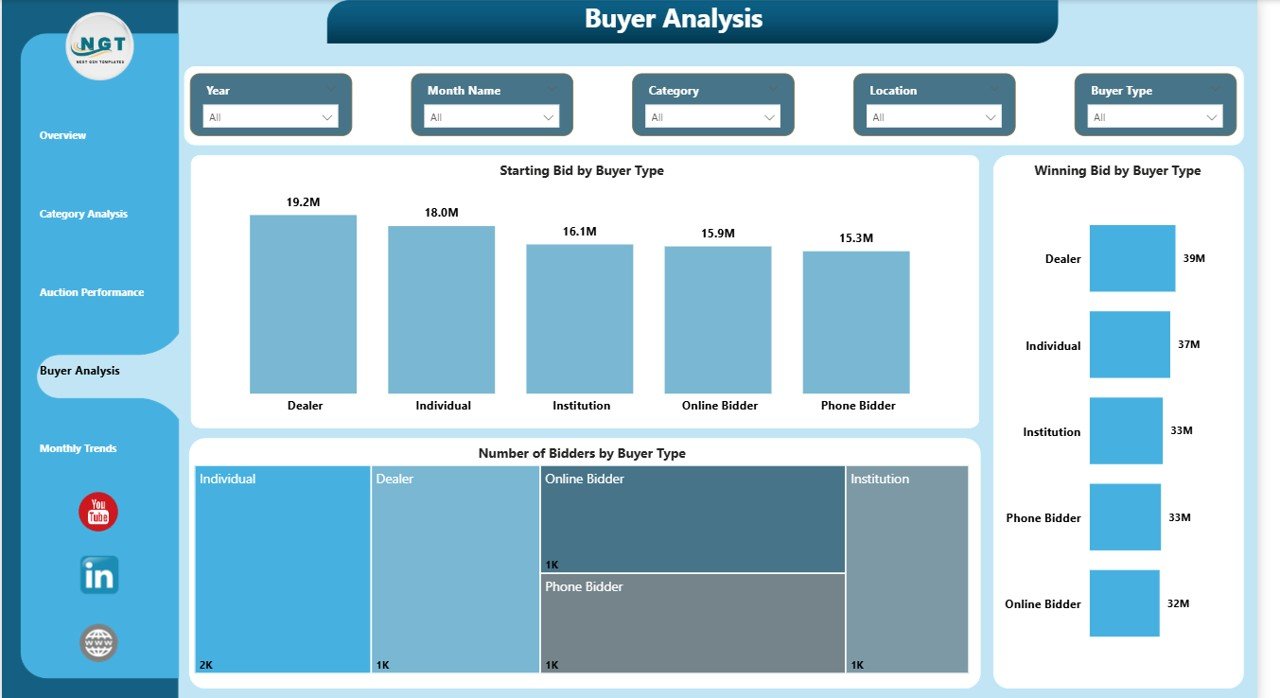
✨ 👥 Buyer Behavior Analysis – Understand bidder participation, preferences, and trends.
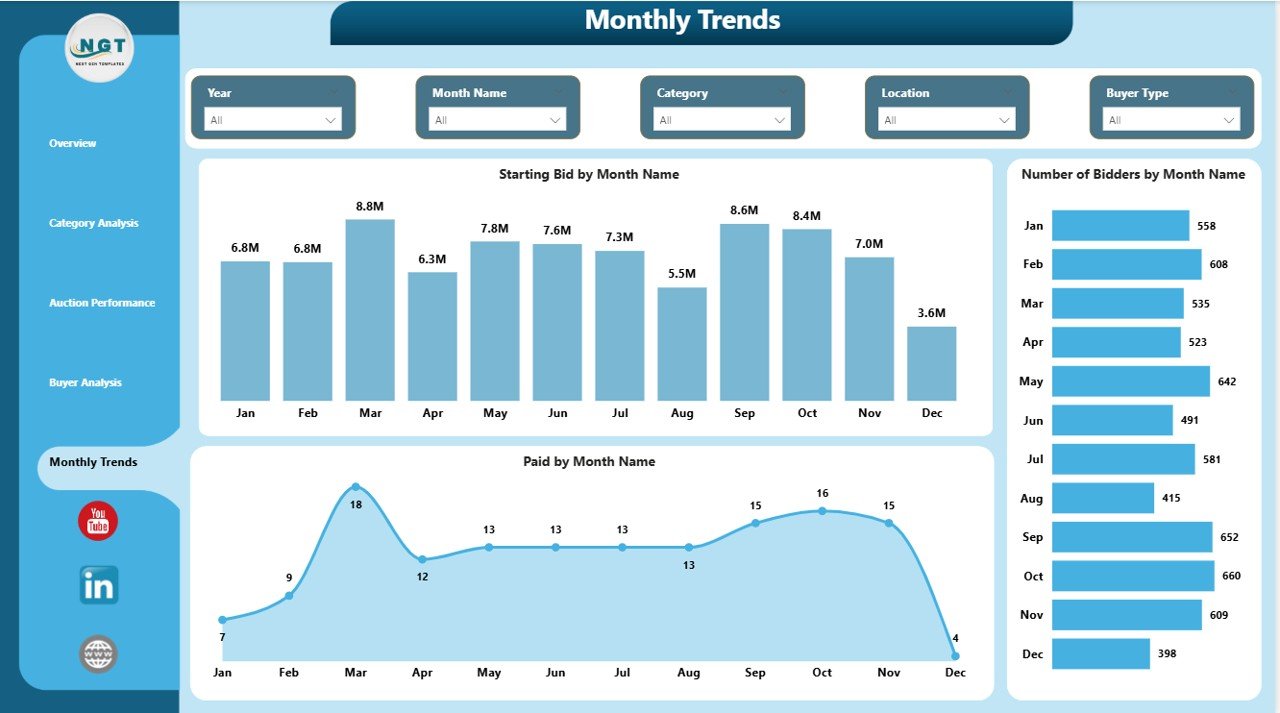
✨ 📅 Monthly Trend Analysis – Track auction activity over time and identify seasonal patterns.
✨ 🎛️ Advanced Filters & Slicers – Drill down into data by auction name, buyer type, category, and more.
✨ ⚡ Real-Time Data Visualization – Convert raw data into meaningful insights instantly.
📁 What’s Inside the Auction Houses Dashboard in Power BI
📌 5 Fully Interactive Pages designed for complete auction analysis:
👉 Overview Page – Get a quick snapshot with KPI cards and performance charts.
👉 Category Analysis – Evaluate category-wise performance and buyer trends.
👉 Auction Performance – Compare auction houses and individual auctions.
👉 Buyer Analysis – Analyze bidder behavior and participation patterns.
👉 Monthly Trend – Track bids, payments, and participation over time.
📊 Key Metrics Included:
- Winning Bid Value
- Starting Bid Amount
- Estimate High & Low
- Number of Bidders
- Paid Amount
- Category Performance
⚙️ How to Use the Auction Houses Dashboard in Power BI
Using this dashboard is simple and effective:
1️⃣ Import Your Data – Add auction data such as bids, buyers, and categories.
2️⃣ Refresh the Dashboard – Let Power BI process and visualize the data.
3️⃣ Apply Filters – Use slicers to focus on specific auctions or categories.
4️⃣ Analyze Insights – Identify trends, patterns, and performance gaps.
5️⃣ Take Action – Optimize bidding strategies and improve auction outcomes.
💡 With just a few clicks, you can turn raw data into powerful insights.
🎯 Who Can Benefit from This Auction Houses Dashboard in Power BI
👨⚖️ Auction Houses & Auctioneers – Track auction success and optimize strategies.
📊 Business Analysts – Gain deep insights into auction performance.
📈 Auction Managers – Monitor operations and improve efficiency.
🧠 Data Analysts – Analyze trends and buyer behavior.
🖼️ Art & Antique Dealers – Evaluate category performance and pricing trends.
👉 In short, anyone involved in auctions can use this dashboard to improve performance and profitability.
💡 Why This Dashboard is a Game-Changer?
✔️ Eliminates manual reporting
✔️ Reduces errors and data confusion
✔️ Improves bidding strategies
✔️ Enhances buyer understanding
✔️ Saves time with automation
🚀 Take control of your auction data and unlock powerful insights today!
📖 Click here to read the Detailed blog post
Watch the step-by-step video tutorial:


