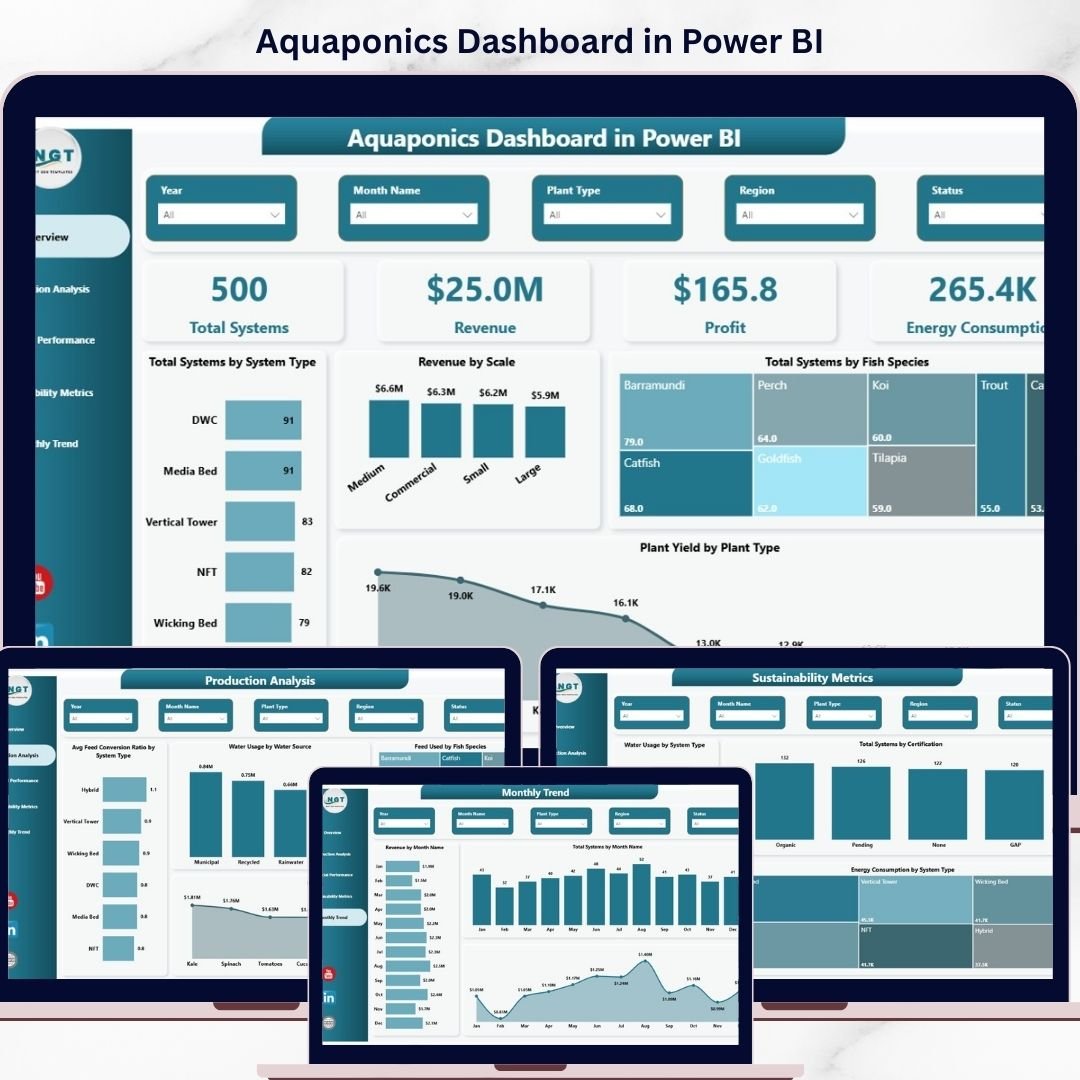
Take control of your farm like never before with the Aquaponics Dashboard in Power BI — a smart, interactive, and ready-to-use reporting solution built for modern aquaponics businesses. Managing fish production, plant yield, revenue, costs, water usage, energy consumption, and sustainability data can feel overwhelming when everything sits in separate files. That is why this dashboard is designed to bring all your critical metrics into one powerful view. Instead of wasting time on manual reports, you can instantly spot trends, track performance, and make faster decisions with confidence. If you want to run your aquaponics operation with more clarity, efficiency, and professionalism, this dashboard is the perfect choice.
Key Features of Aquaponics Dashboard in Power BI
🌿 5 Powerful Dashboard Pages – This product includes five fully designed analytical pages: Overview, Production Analysis, Financial Performance, Sustainability Metrics, and Month Analysis.
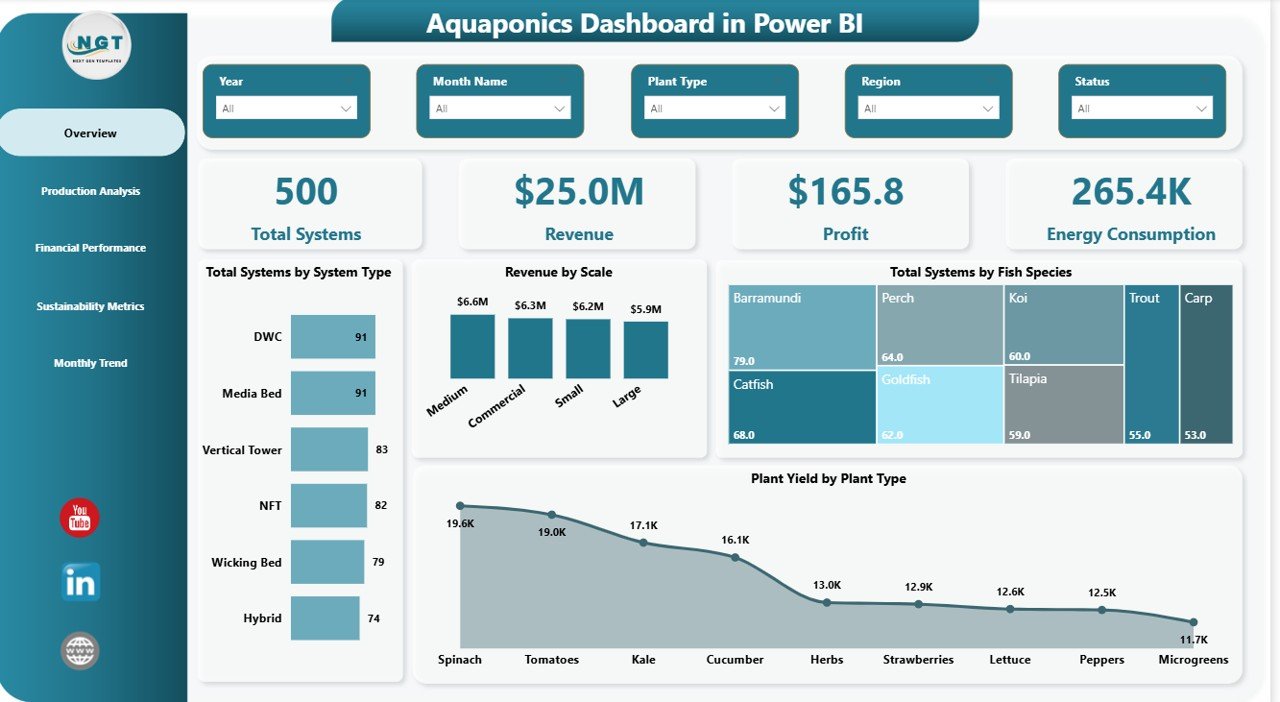
📊 Interactive Overview Page – Get a quick snapshot of your operation using 4 KPI cards: Total Systems, Revenue, Profit, and Energy Consumption.
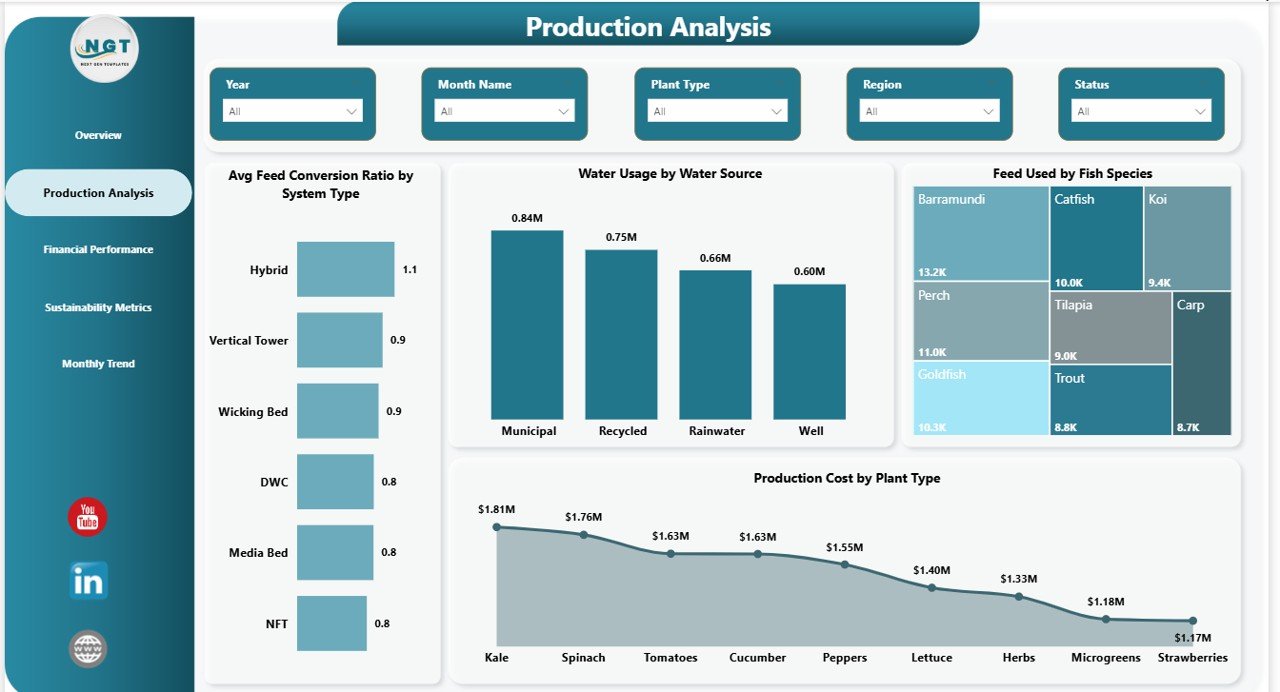
🐟 Production Analysis Insights – Monitor key production metrics like Average Feed Conversion Ratio by System Type, Water Usage by Water Source, Feed Used by Fish Species, and Production Cost by Plant Type.
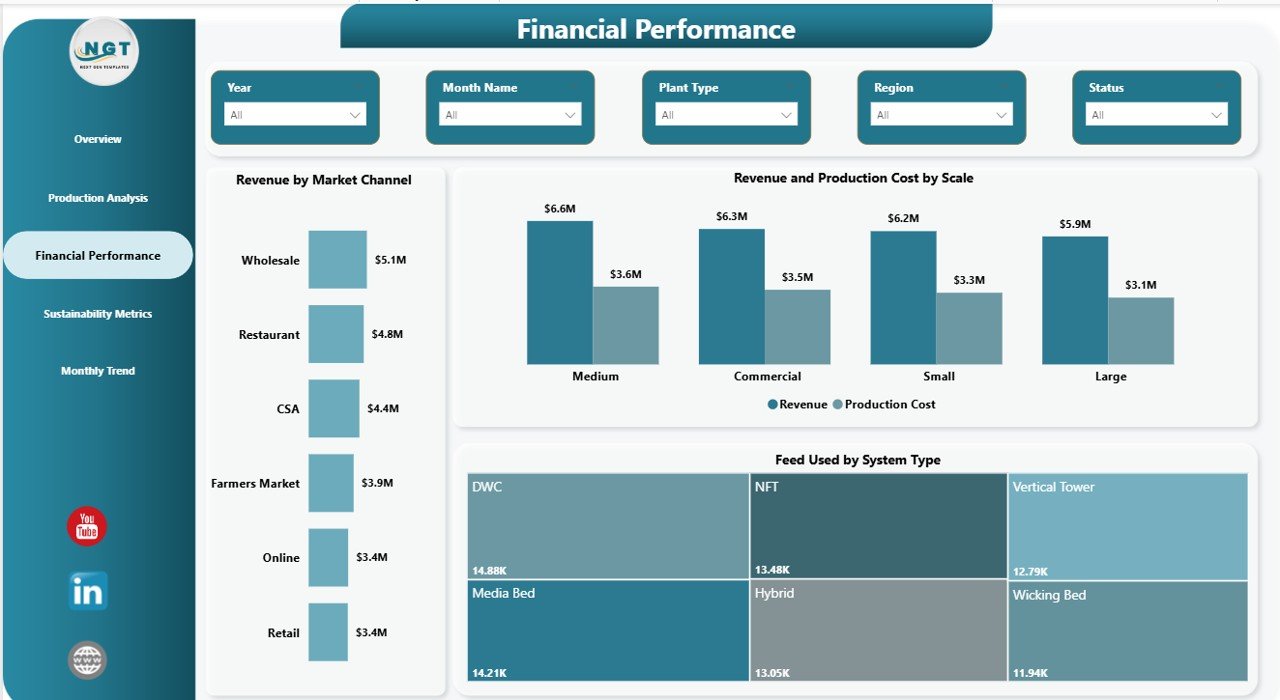
💰 Financial Performance Tracking – Understand business performance with visuals such as Revenue by Market Channel, Revenue and Production Cost by Scale, and Feed Used by System Type.
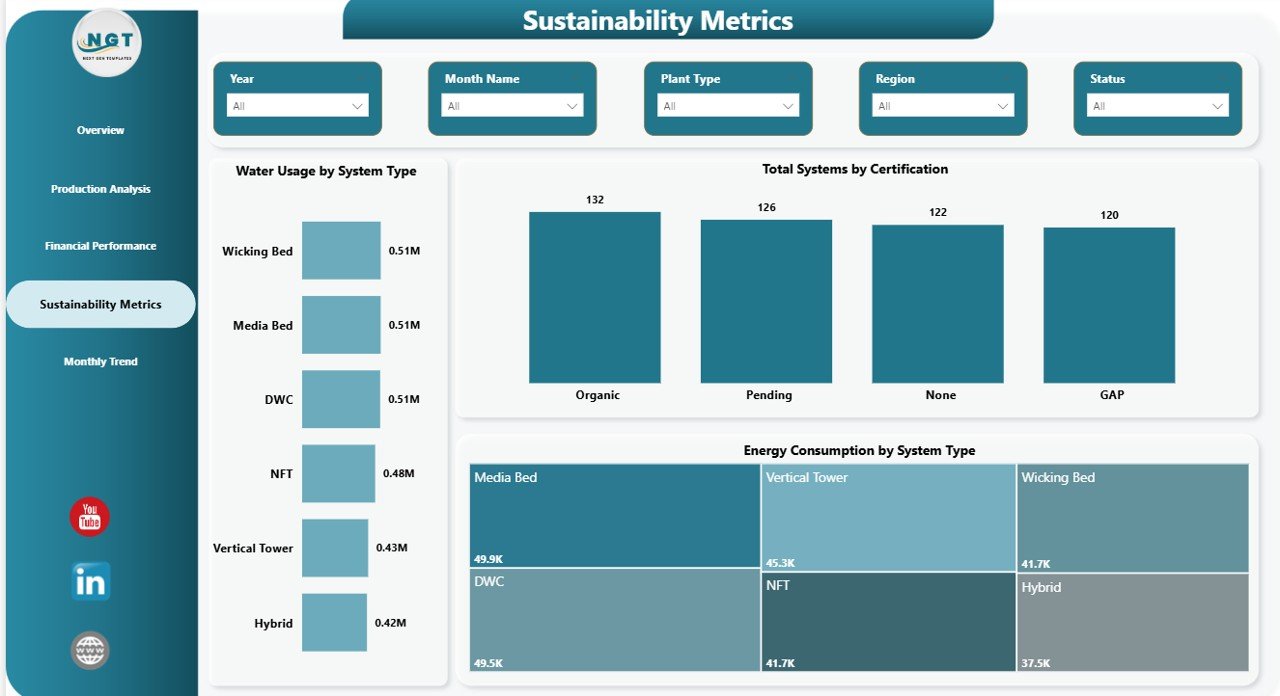
♻️ Sustainability Metrics Page – Track environmental performance through Water Usage by System Type, Total Systems by Certification, and Energy Consumption by System Type.
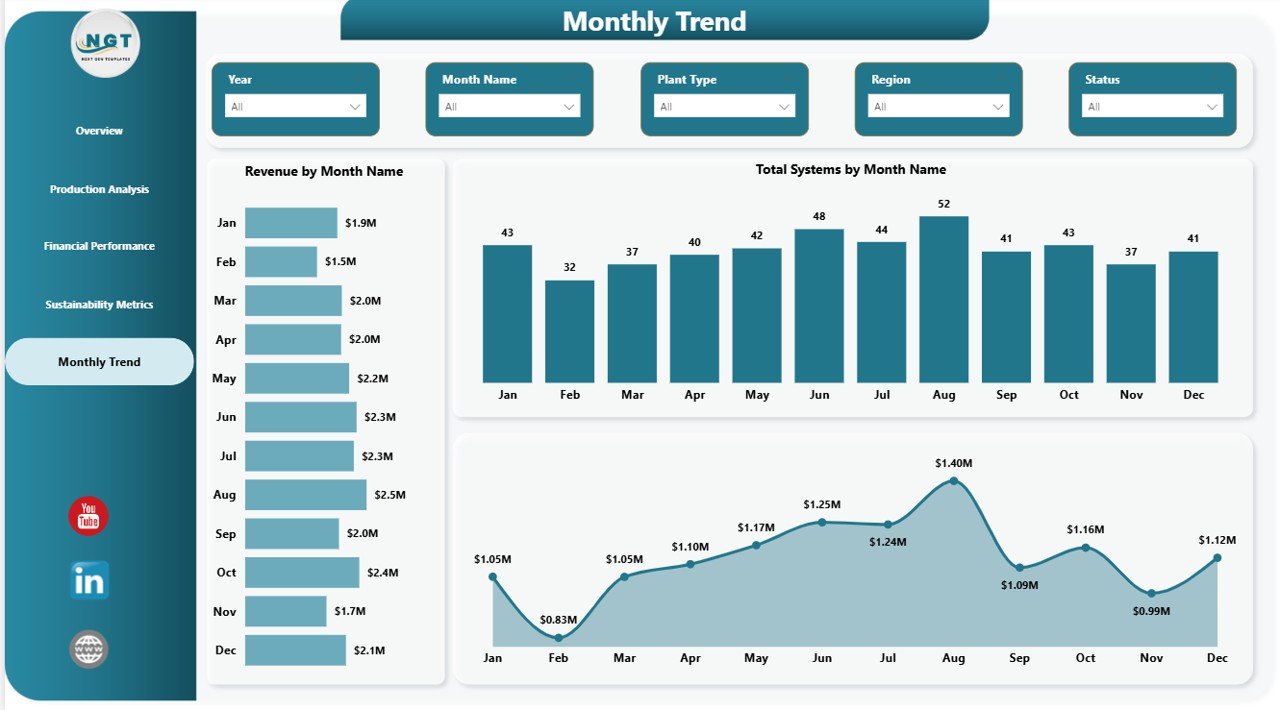
📅 Monthly Trend Analysis – Review Revenue by Month Name, Total Systems by Month Name, and Production Cost by Month Name to uncover trends and seasonal patterns.
🎛️ Dynamic Slicers and Filters – Explore your data easily with interactive controls that help you focus on the exact information you need.
📈 Professional Visual Reporting – Turn raw aquaponics data into clear charts and business-friendly insights for daily reviews, planning, and meetings.
What’s Inside the Aquaponics Dashboard in Power BI
Inside this digital product, you get a professionally structured Power BI dashboard designed to support aquaponics monitoring and analysis. The dashboard helps you centralize essential farm data in one place, making it easier to review operational, financial, and sustainability performance without jumping across multiple spreadsheets.
You will be able to analyze:
-
Total systems
-
Revenue
-
Profit
-
Energy consumption
-
Plant yield
-
Feed usage
-
Production cost
-
Water usage
-
Fish species performance
-
Certification tracking
-
Monthly business trends
This dashboard is ideal for presenting data clearly to teams, managers, and stakeholders. It is built to save time, improve visibility, and help you focus on growth instead of manual reporting.
How to Use the Aquaponics Dashboard in Power BI
🚀 Using this dashboard is simple and practical. First, connect or import your aquaponics data into the Power BI file. Then, refresh the dashboard to update all charts and KPI visuals automatically.
🔍 Use the slicers and filters to review specific parts of your operation, such as system type, fish species, scale, plant type, or month.
📌 Start with the Overview Page to understand your overall business position. After that, move into Production Analysis for operational efficiency, Financial Performance for profitability insights, Sustainability Metrics for environmental tracking, and Month Analysis for trend monitoring.
📊 During meetings or reviews, use the visuals to explain patterns quickly, highlight opportunities, and support better decisions with real data.
Who Can Benefit from This Aquaponics Dashboard in Power BI
👨🌾 Aquaponics Farm Owners who want a smarter way to monitor farm performance
👩💼 Farm Managers who need quick visibility into production, cost, and revenue
♻️ Sustainability Managers who track water use, energy use, and certifications
📉 Financial Analysts who need clear profit and cost reporting
🧠 Agribusiness Consultants who support smart farming businesses
📋 Operations Teams who manage day-to-day efficiency and resource usage
🤝 Investors and Stakeholders who want professional performance reports
🏢 Small and Medium Aquaponics Businesses looking to scale with data-driven decisions
This dashboard is more than a report. It is a practical business tool that helps you reduce reporting time, improve planning, and manage your aquaponics operation with greater confidence. If you want better control, stronger insights, and a more professional way to track your farm, this product is a smart investment.
Click hare to read the Detailed blog post
Watch the step-by-step video tutorial:
Learn more about the full use case, business benefits, and detailed dashboard explanation in the complete blog post.


