Artificial Intelligence is transforming modern organizations. Businesses now rely on AI models for decision-making, automation, forecasting, fraud detection, customer experience, and predictive analytics. However, as organizations deploy more AI systems, managing governance, compliance, risk exposure, and operational costs becomes increasingly complex.
Many companies still track AI governance through scattered spreadsheets and manual reports. As a result, leaders struggle to monitor model ownership, compliance status, risk levels, and governance performance across departments.
This is exactly where the AI Governance Dashboard in Excel becomes an essential solution.
The AI Governance Dashboard in Excel is a ready-to-use analytics template designed to monitor AI models, governance metrics, compliance status, incident tracking, and operational costs in one centralized dashboard. Moreover, it transforms complex governance data into visual insights that help organizations manage AI responsibly.
Because Excel provides powerful features such as pivot tables, charts, slicers, and automated calculations, this dashboard enables organizations to monitor AI governance performance quickly and efficiently.
As a result, companies can improve transparency, strengthen compliance, reduce AI risks, and manage AI operations more effectively.
🤖 Key Feature of AI Governance Dashboard in Excel
The dashboard includes several powerful features that help organizations monitor and manage AI governance efficiently.
📊 Centralized AI Governance Monitoring – Track AI models, compliance status, risk levels, and governance performance in one dashboard.
⚠️ AI Risk Monitoring – Identify high-risk AI models and governance incidents quickly.
📋 Compliance Status Tracking – Monitor compliant, under-review, and non-compliant AI models.
💰 AI Model Cost Analysis – Evaluate operational costs associated with different AI systems.
🏢 Department-Level Governance Insights – Track AI adoption and governance performance across departments.
🌍 Regional Governance Monitoring – Analyze AI governance performance across different geographic regions.
📈 AI Type Performance Analysis – Monitor governance incidents and risk levels by AI technology type.
📅 Monthly Governance Trends – Track governance scores, AI model growth, and cost trends over time.
🔎 Interactive Filters and Slicers – Drill down into governance insights instantly.
⚡ Automatic Dashboard Updates – Refresh data to update charts and KPIs instantly.
These features enable organizations to manage AI responsibly while maintaining transparency and compliance.
📦 What’s Inside the AI Governance Dashboard in Excel
The dashboard contains five analytical pages designed to provide a comprehensive view of AI governance performance.
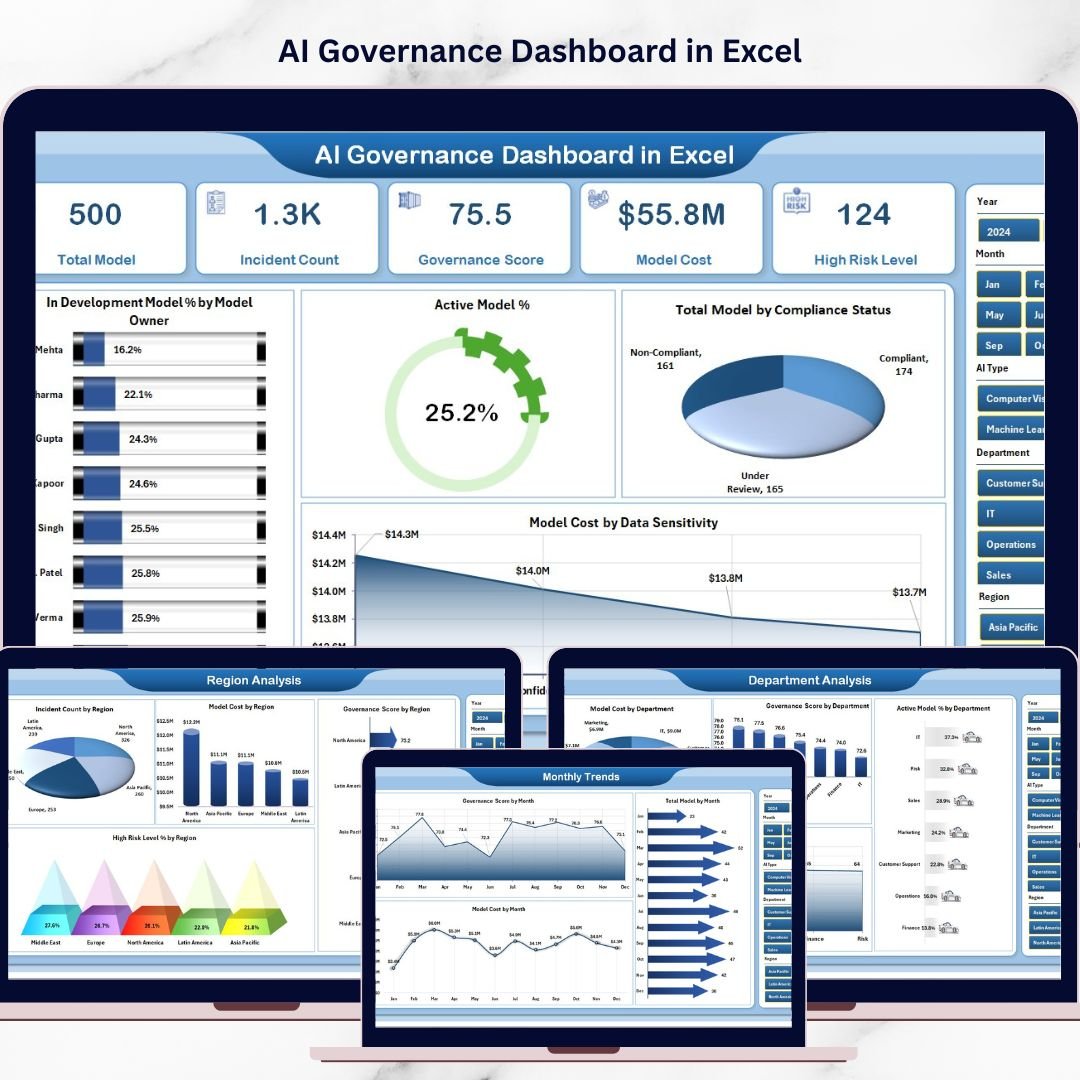
Overview Page – Central AI Governance Monitoring
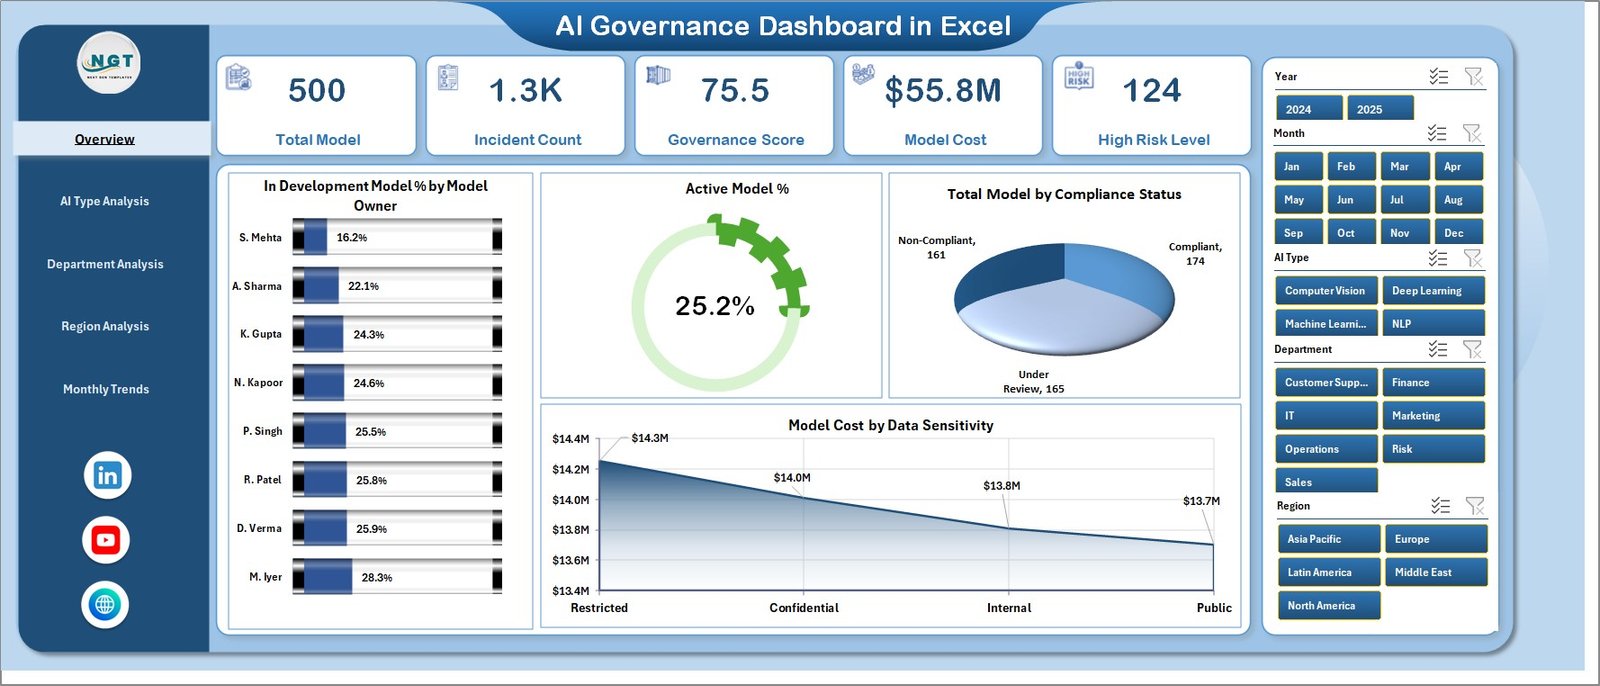
The Overview Page serves as the primary monitoring interface for AI governance.
Users can apply filters using the right-side slicer panel to analyze specific segments.
Key Elements on the Overview Page
• Right-side slicer panel for filtering
• Four KPI cards summarizing governance performance
Charts Included
• In Development Model % by Model Owner
• Active Model Count
• Total Model by Compliance Status
• Model Cost by Data Sensitivity
This page allows leadership teams to quickly evaluate the overall AI governance environment.
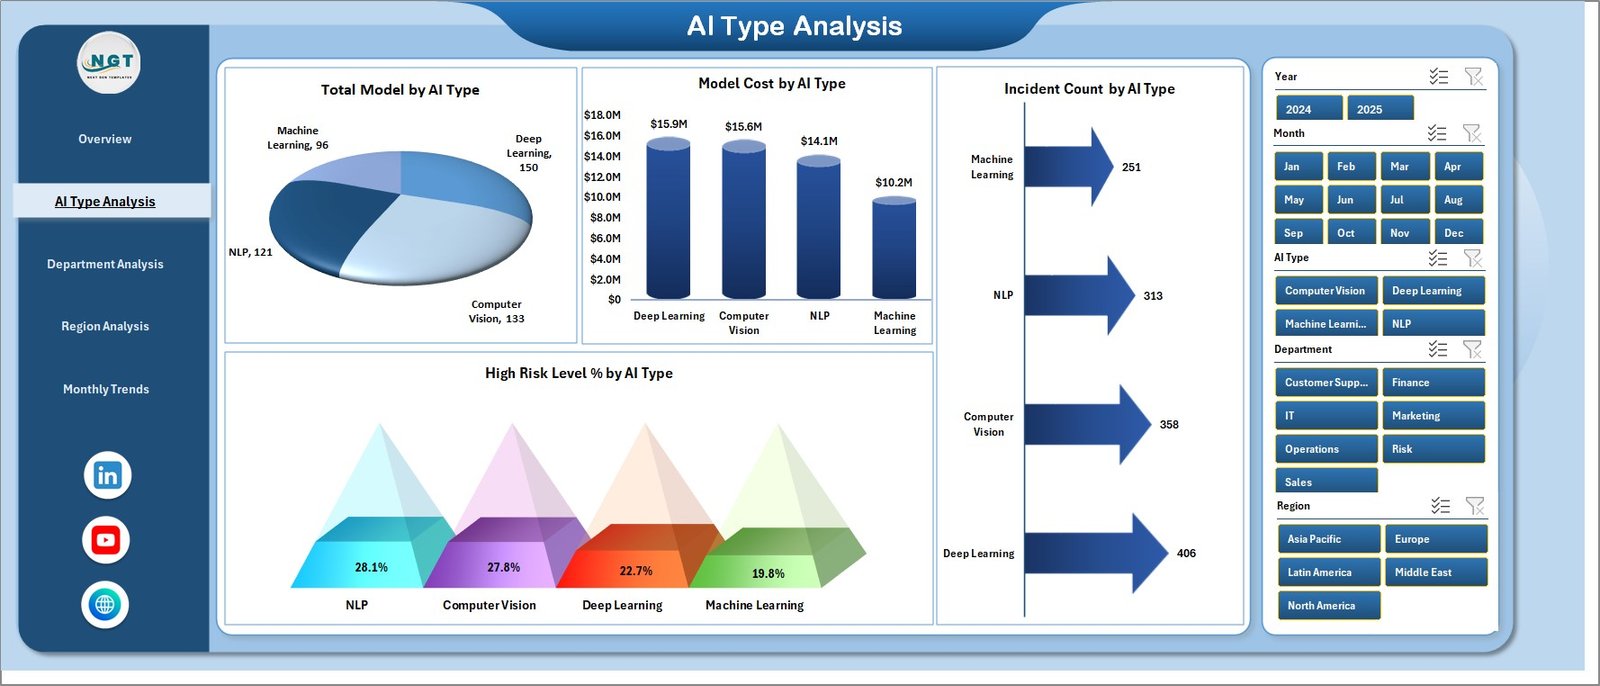
AI Type Analysis – Monitoring AI Technology Risk
Organizations deploy multiple types of AI technologies. Therefore, monitoring governance risk across AI types becomes critical.
Charts Included
• Total Model by AI Type
• Model Cost by AI Type
• Incident Count by AI Type
• High-Risk Level % by AI Type
This page helps organizations identify:
• AI technologies with higher governance risks
• AI categories generating higher operational costs
• Technologies requiring stronger compliance monitoring
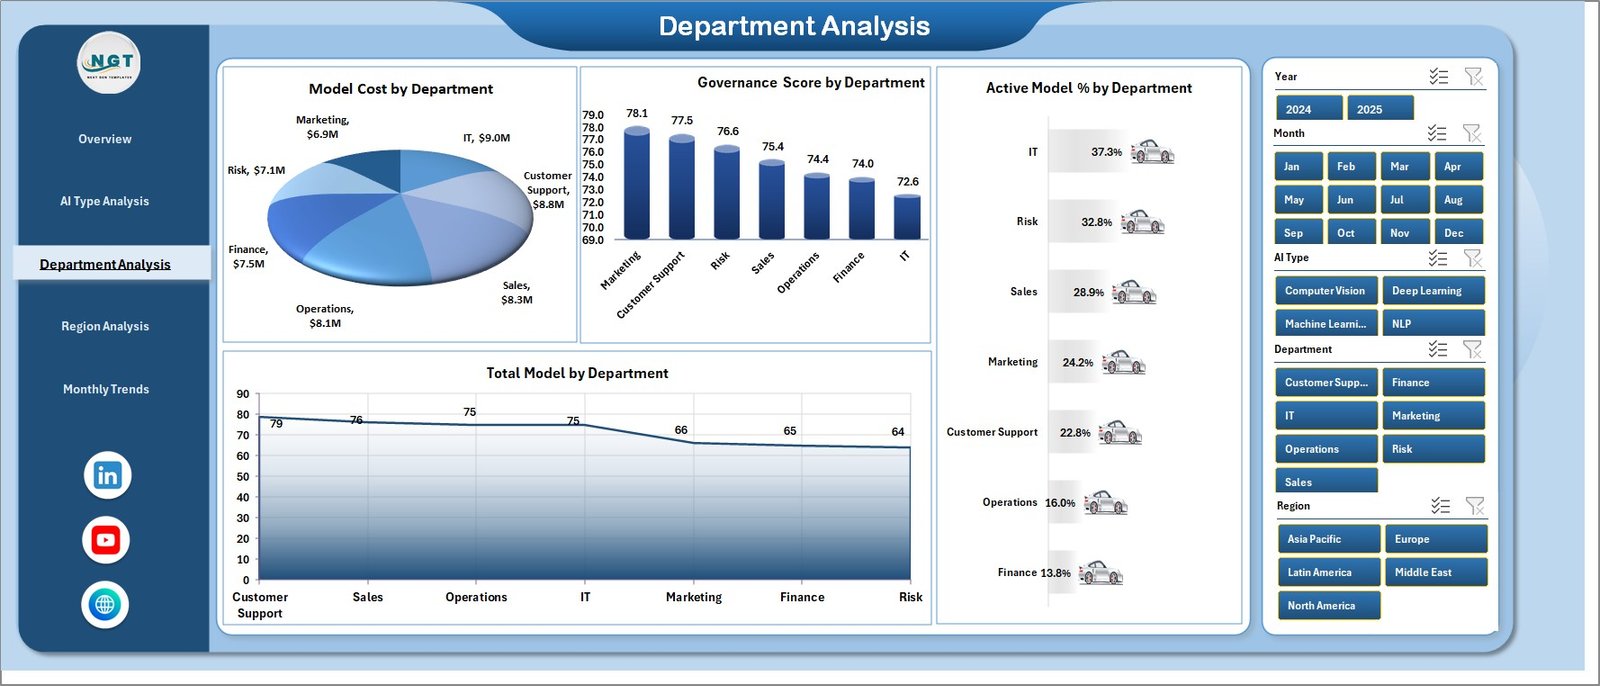
Department Analysis – Tracking AI Governance Across Teams
Organizations often deploy AI across multiple departments such as finance, marketing, customer support, and operations.
Charts Included
• Total Model by Department
• Governance Score by Department
• Active Model % by Department
• Model Distribution by Department
This analysis helps leadership teams understand which departments adopt AI most actively and how well they manage governance.
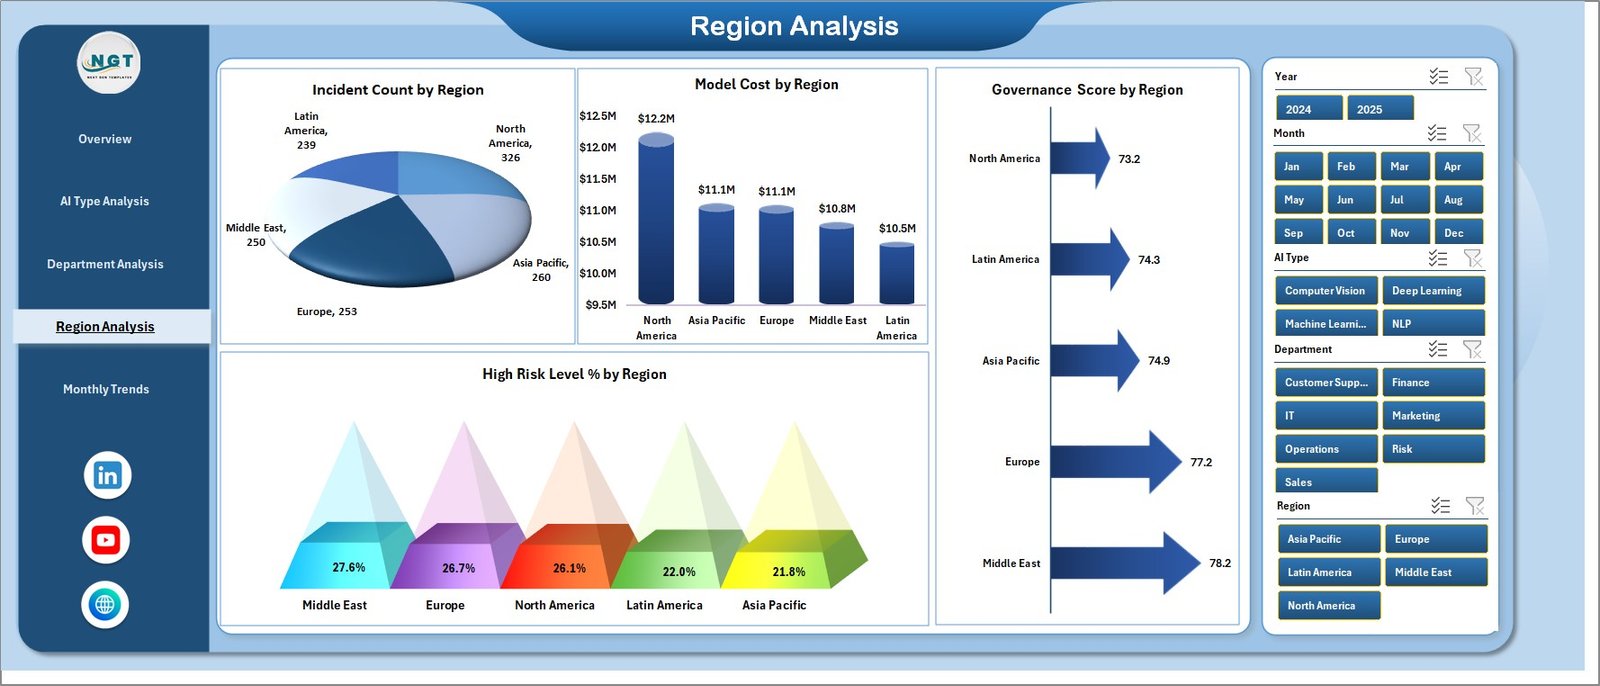
Region Analysis – Global AI Governance Insights
Large organizations operate across multiple geographic regions. Therefore, governance monitoring must also be performed regionally.
Charts Included
• Incident Count by Region
• Model Cost by Region
• Governance Score by Region
• High-Risk Level % by Region
This analysis helps organizations identify:
• Regions with higher governance incidents
• Regions with higher operational AI costs
• Governance maturity across global operations
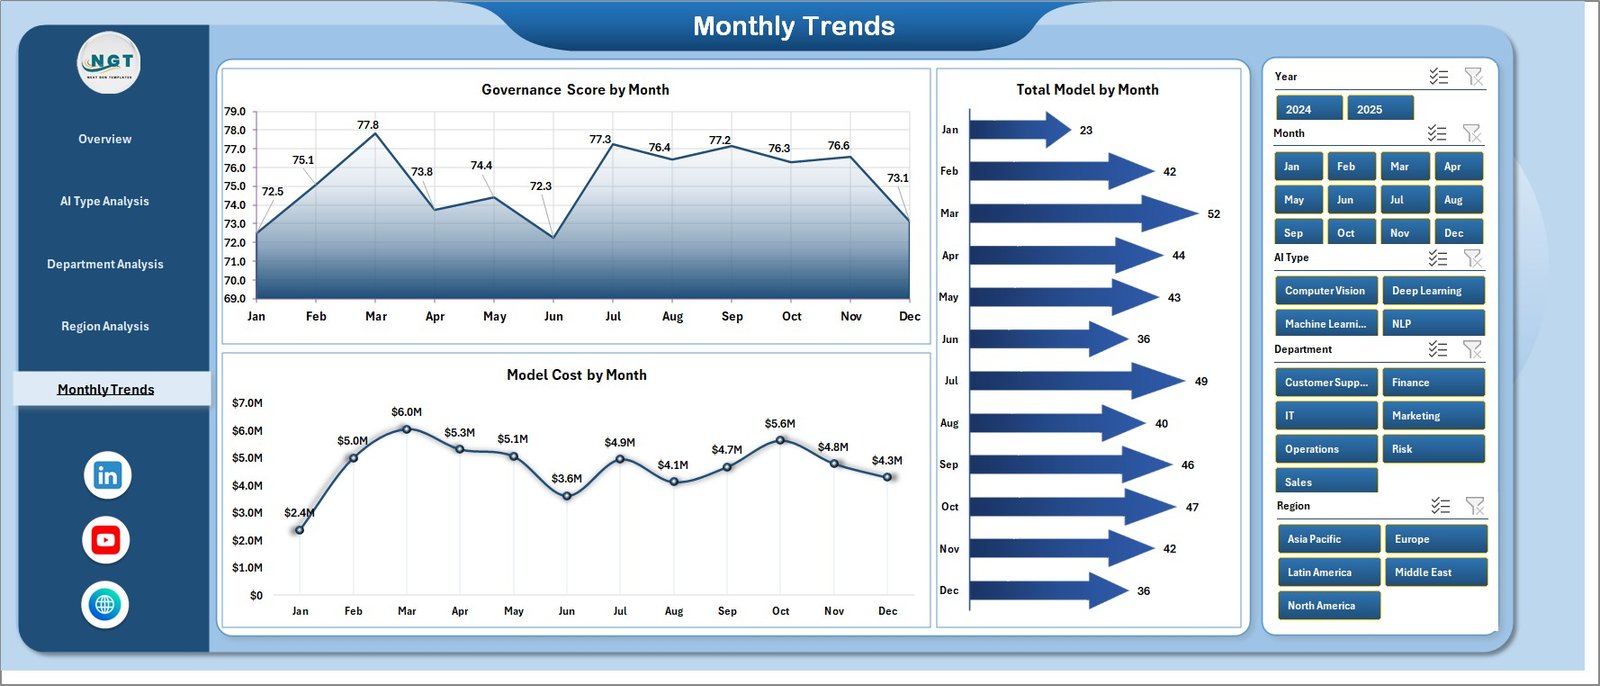
Month Analysis – Tracking Governance Trends Over Time
AI governance performance evolves continuously. Therefore, monitoring trends over time becomes essential.
Charts Included
• Governance Score by Month
• Total Model by Month
• Model Cost by Month
These insights help organizations monitor governance improvement trends and evaluate AI adoption growth.
⚙️ How to Use the AI Governance Dashboard
Using this dashboard is simple and efficient.
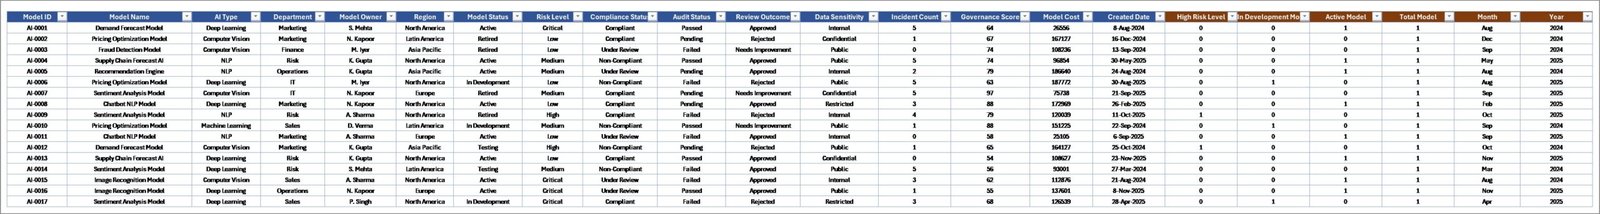
1️⃣ Enter AI model data into the data sheet.
2️⃣ Include information such as model owner, AI type, compliance status, risk level, incident records, and operational cost.
3️⃣ Refresh pivot tables to update the dashboard.
4️⃣ Apply filters using slicers to analyze specific departments, regions, or AI types.
5️⃣ Review charts and KPIs to identify governance risks and opportunities.
Once data updates, the dashboard instantly reflects the latest governance insights.
👥 Who Can Benefit from This Dashboard
The AI Governance Dashboard in Excel is useful for many professionals and organizations managing AI systems.
It is particularly beneficial for:
🤖 AI Governance Teams
📊 Data Science Teams
⚖️ Compliance Officers
💻 Technology Leaders
⚠️ Risk Management Teams
🏢 Executive Leadership
Because the dashboard provides centralized governance insights, it helps organizations ensure responsible AI usage while maintaining compliance and operational control.
💡 Advantages of AI Governance Dashboard in Excel
Organizations gain several benefits when implementing this dashboard.
✔ Centralized monitoring of AI governance metrics
✔ Faster identification of high-risk AI models
✔ Improved compliance tracking
✔ Better governance transparency
✔ Department-level AI monitoring
✔ Regional governance performance insights
✔ Clear visualization of governance trends
✔ Data-driven decision-making for AI operations
Instead of relying on scattered reports, organizations can use this Excel dashboard to monitor AI governance efficiently and proactively manage risks.
This dashboard becomes a powerful tool for organizations that want to implement responsible AI practices and maintain strong governance frameworks.
### Click here to read the Detailed blog post
Visit our YouTube channel to learn step-by-step video tutorials
https://youtube.com/@PKAnExcelExpert