

ERP SaaS Startups Dashboard in Excel helps SaaS founders, revenue operations teams, customer success leads, and startup analysts review ARR, MRR, seats, account records, CAC, NPS, product modules, customer mix, growth health, and implementation status in one editable Excel workbook. For $17.99 one-time, you get a pivot-driven dashboard with multiple analysis pages, KPI cards, slicers, a structured Data Sheet, and a Support Sheet that powers the charts. Update the data, click Data > Refresh All, and the workbook refreshes without a monthly analytics subscription.
Key Features of ERP SaaS Startups Dashboard in Excel
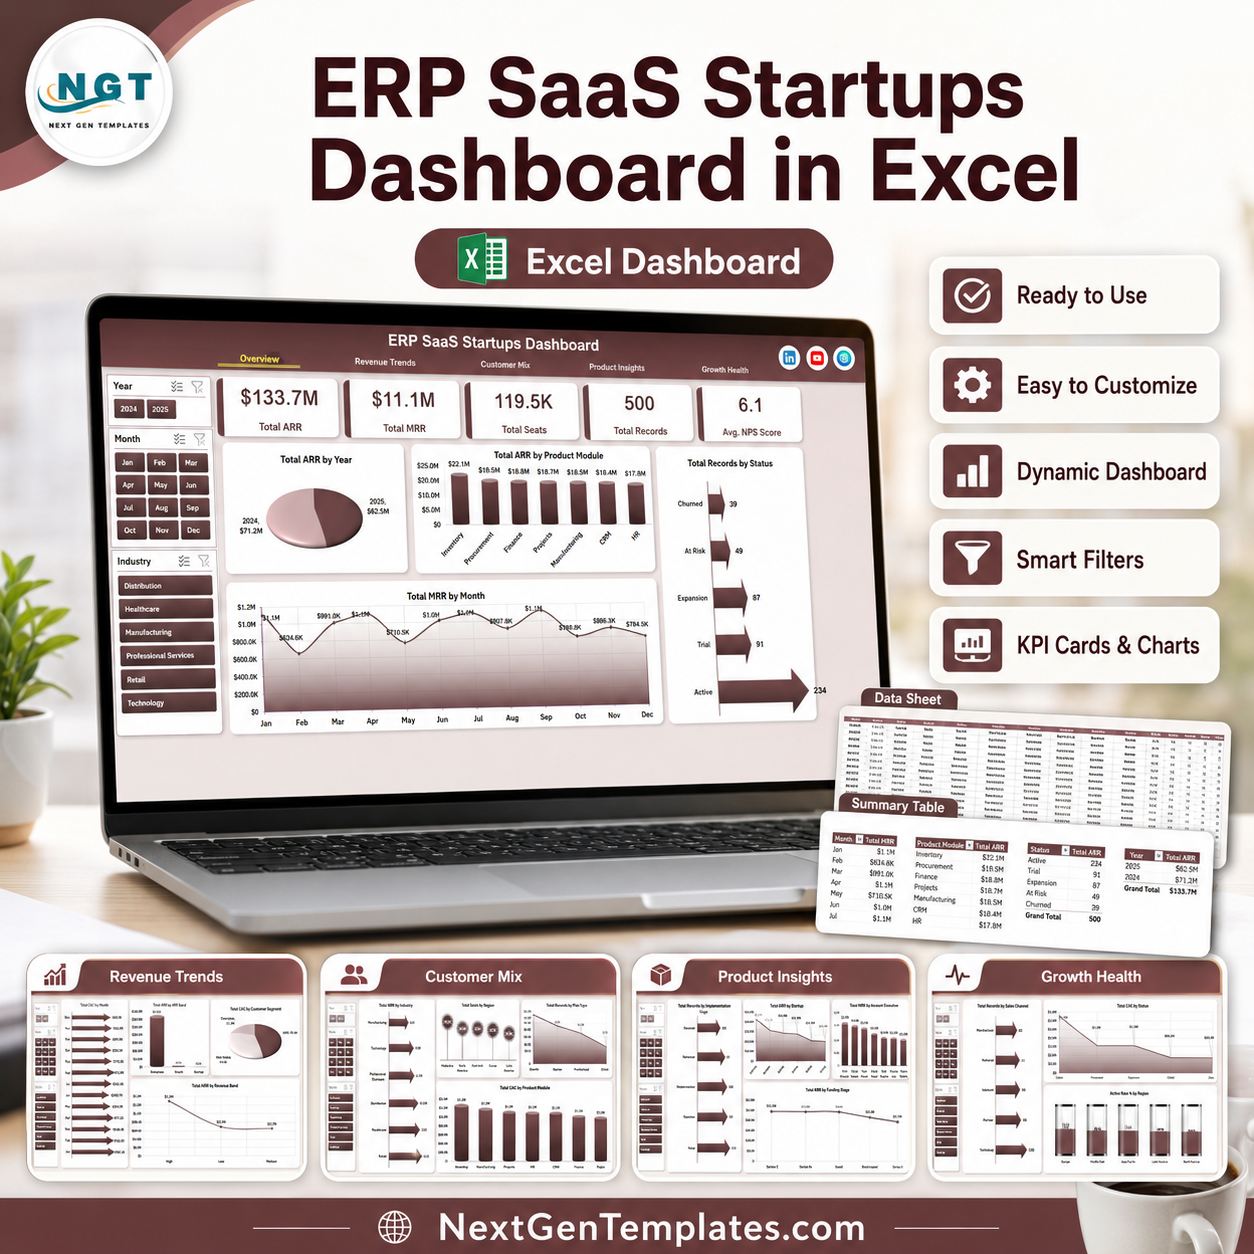
- 5 dashboard pages for Overview, Revenue Trends, Customer Mix, Product Insights, and Growth Health.
- 5 executive KPI cards for Total ARR, Total MRR, Total Seats, Total Records, and Avg. NPS Score.
- SaaS revenue reporting for ARR, MRR, revenue bands, ARR bands, and monthly movement.
- Customer and market analysis by industry, region, plan type, customer segment, and account status.
- Product module visibility across ARR, MRR, CAC, implementation stage, startup, executive owner, and funding stage.
- Interactive slicers let users filter the workbook quickly by the available SaaS dimensions.
- Pivot-powered refresh through a Support Sheet that can be hidden after setup.
What’s Inside the ERP SaaS Startups Dashboard in Excel
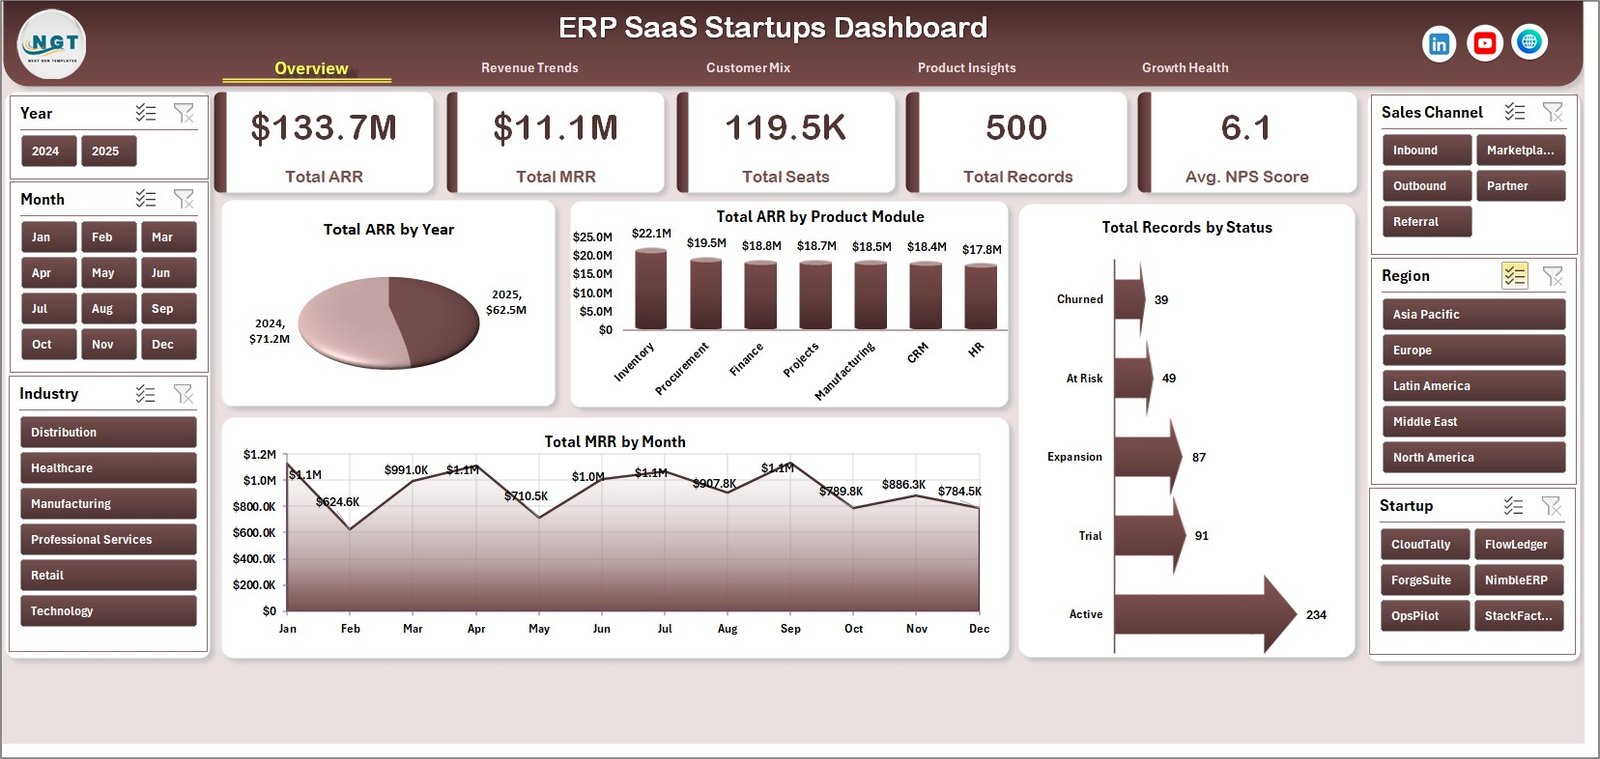
1. Overview Page
The Overview Page gives a leadership-level summary of ERP SaaS startup performance. KPI cards show Total ARR, Total MRR, Total Seats, Total Records, and Avg. NPS Score, so teams can review recurring revenue, adoption scale, customer volume, and satisfaction before going deeper.
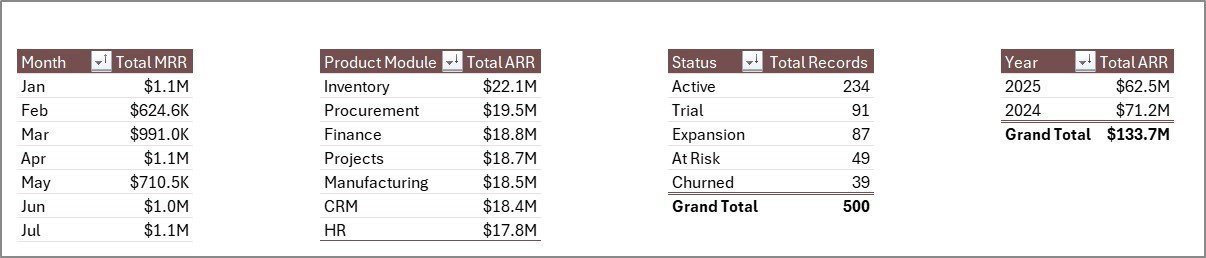
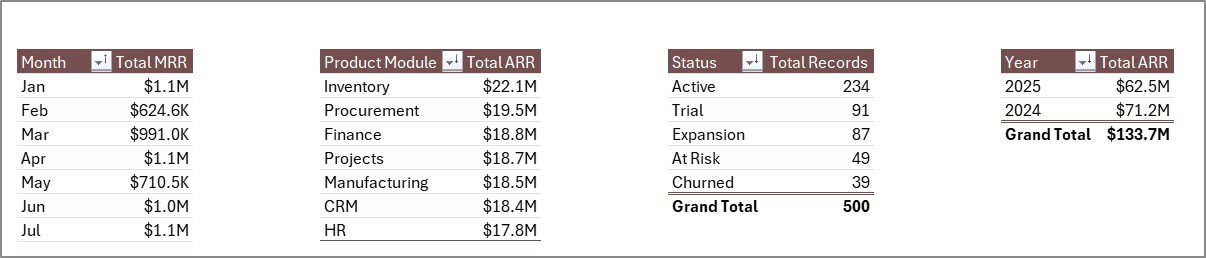
Total ARR by Year: This chart shows annual recurring revenue by year so founders can review long-term revenue growth. It is useful for investor updates, board decks, and yearly planning.
Total ARR by Product Module: This visual highlights which ERP modules contribute the most ARR. It helps product and revenue teams understand whether finance, inventory, HR, CRM, or other modules are driving growth.
Total MRR by Month: This chart tracks monthly recurring revenue movement across the selected filters. Use it to spot acceleration, soft months, or seasonal subscription patterns.
Total Records by Status: This chart shows how accounts or records are distributed by status. It helps teams understand active, pending, churned, onboarding, or other status groups in the dataset.
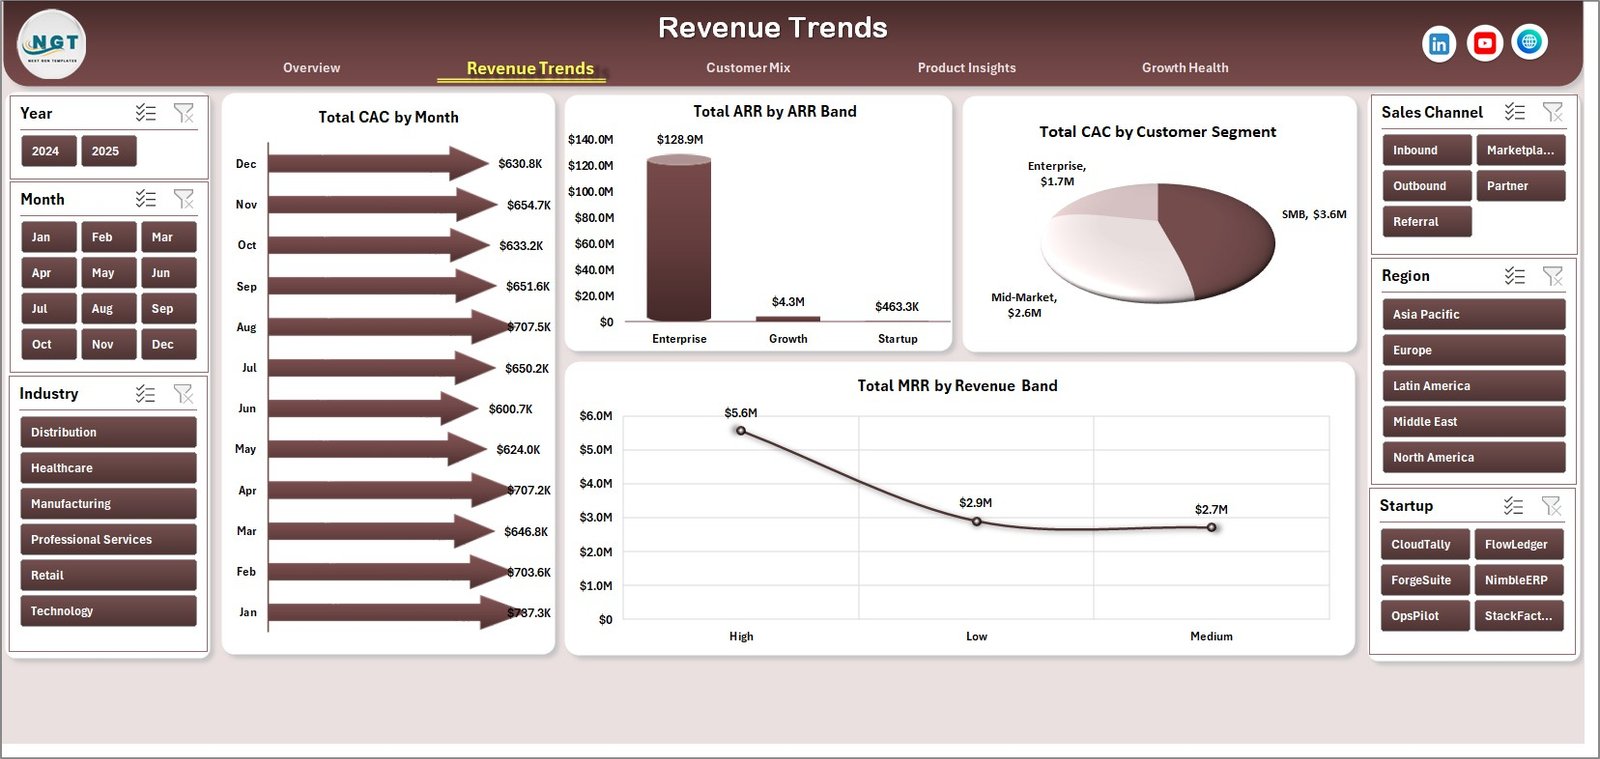
2. Revenue Trends
The Revenue Trends sheet focuses on customer acquisition cost and recurring revenue distribution. It includes Total CAC by Month, Total ARR by ARR Band, Total CAC by Customer Segment, and Total MRR by Revenue Band.
Use this page to compare acquisition spend with revenue tiers and customer segments. It helps revenue teams see where customer acquisition investment is concentrated and which revenue bands carry the strongest subscription value.
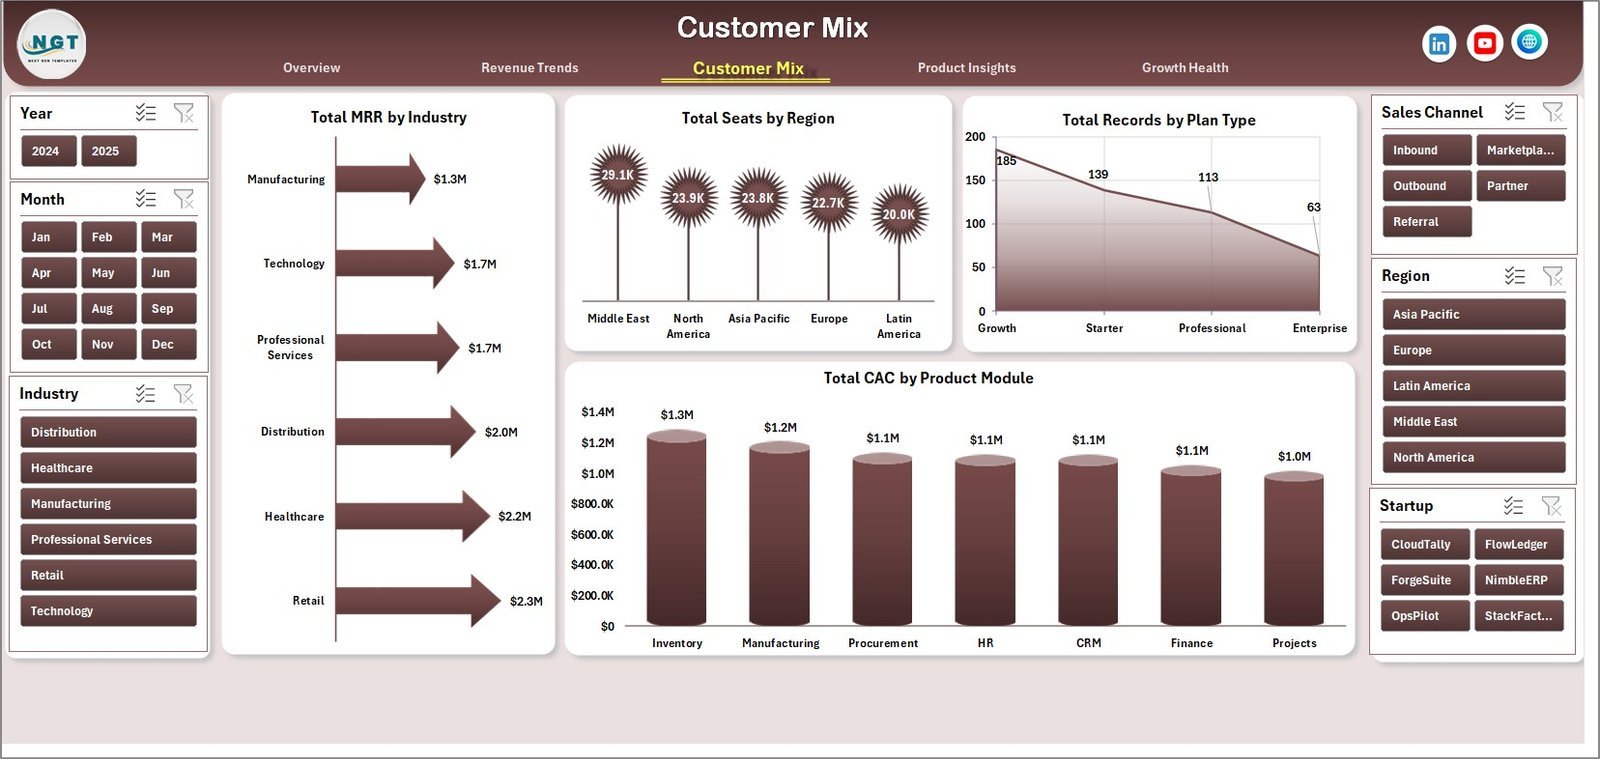
3. Customer Mix
The Customer Mix sheet reviews market composition and account distribution. It includes Total MRR by Industry, Total Seats by Region, Total Records by Plan Type, and Total CAC by Product Module.
This page helps teams understand which industries produce MRR, where seats are concentrated, how plan types are distributed, and which product modules require higher acquisition investment.

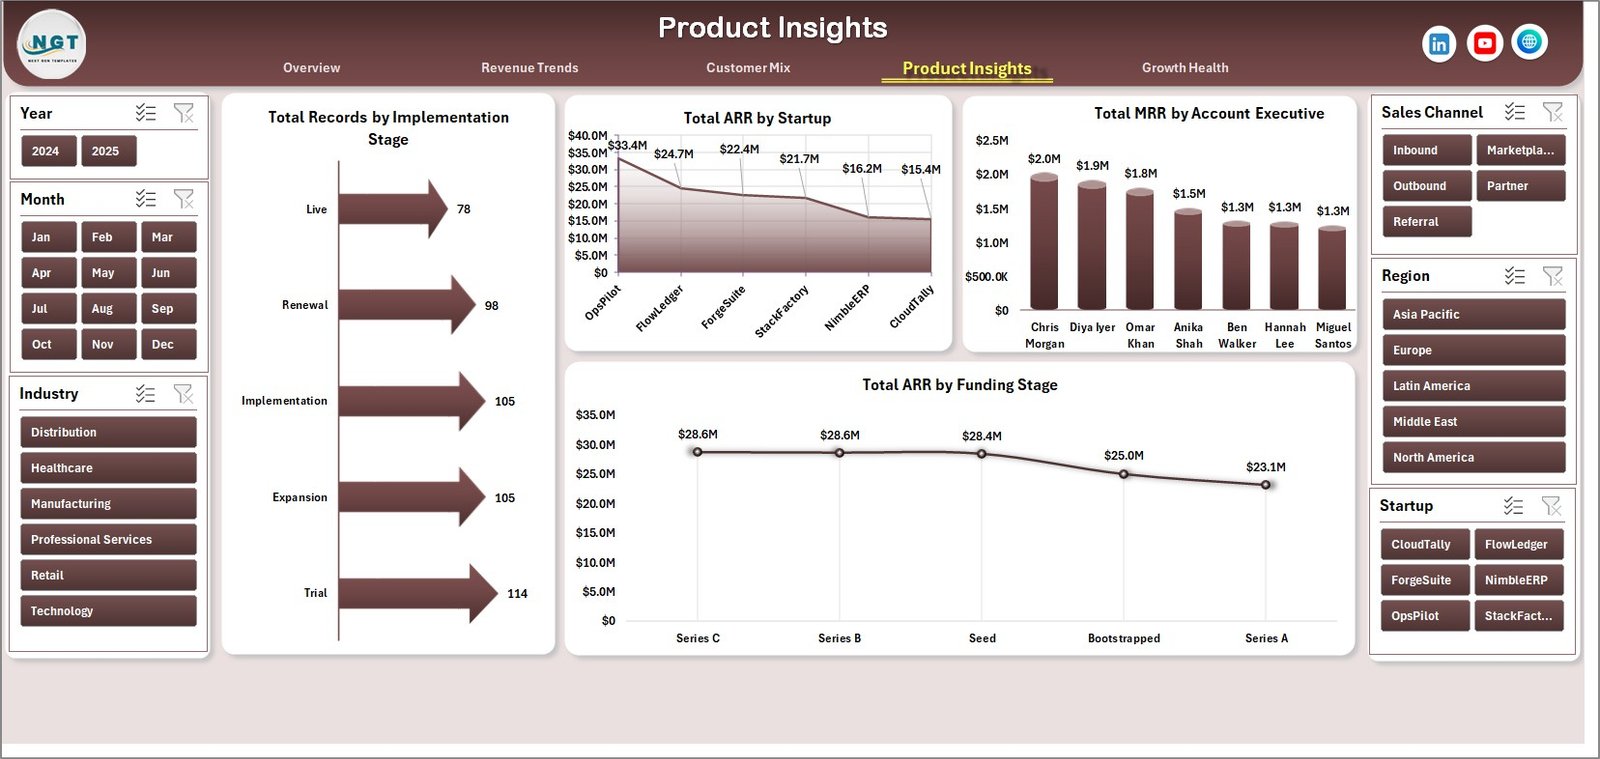
4. Product Insights
The Product Insights sheet connects product adoption, startup performance, ownership, and funding context. It includes Total Records by Implementation Stage, Total ARR by Startup, Total MRR by Account Executive, and Total ARR by Funding Stage.
Use this sheet to review implementation progress, compare startup-level ARR, understand account executive contribution, and see whether funding stage is connected with stronger recurring revenue.
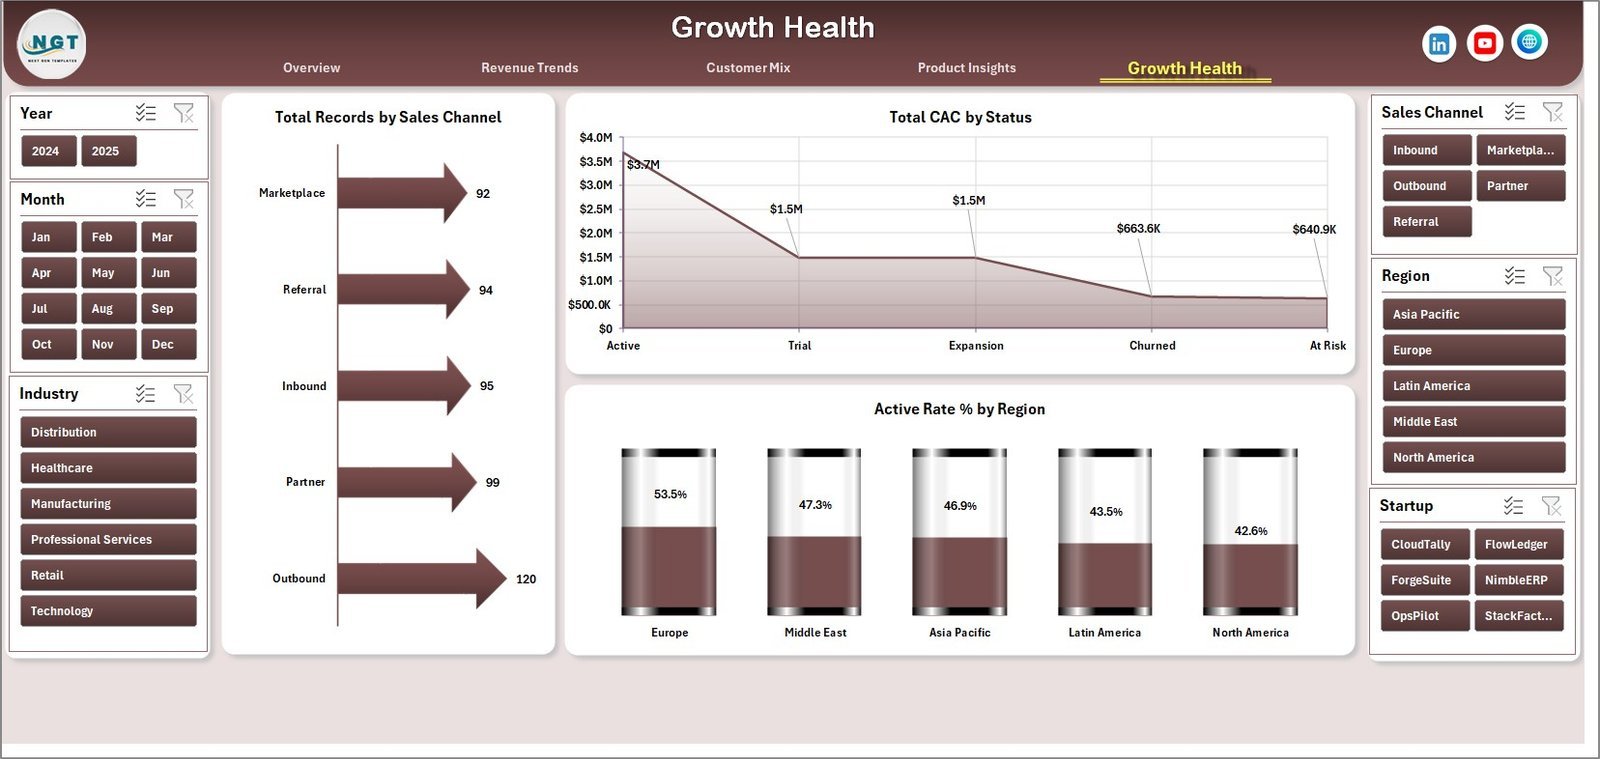
5. Growth Health
The Growth Health sheet helps teams review channel mix, customer status, and regional activity. It includes Total Records by Sales Channel, Total CAC by Status, and Active Rate % by Region.
This page is useful for monitoring whether acquisition channels are producing healthy account activity, where CAC is tied to status groups, and which regions show stronger active-account rates.

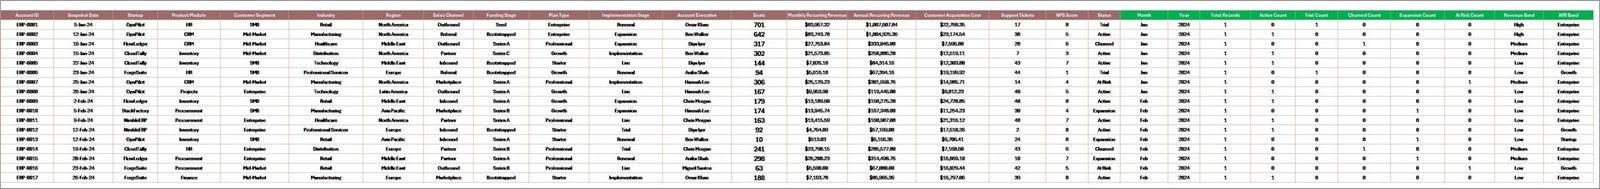
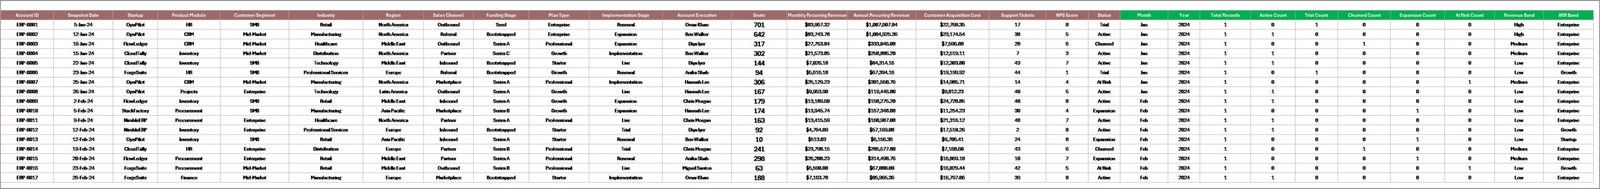
6. Data Sheet Tab
The Data Sheet is where you add or replace the ERP SaaS startup records in the same column format as the sample data. Keep the structure consistent so pivots, slicers, KPI cards, and charts continue to refresh correctly.
7. Support Sheet
The Support Sheet contains the pivot tables used to create the dashboard dynamically. After updating the Data Sheet, go to the Data tab in the Excel Ribbon and click Refresh All. You can keep this sheet hidden during normal use.
ERP SaaS Startups Dashboard in Excel vs. Google Sheets vs. Paid CRM/SaaS – Where This Fits
| Feature | This Excel Dashboard | Google Sheets Alternative | Paid CRM/SaaS |
|---|---|---|---|
| Cost | $17.99 one-time | Low software cost, dashboard build required | Monthly or annual subscription |
| Platform | Microsoft Excel | Browser-based spreadsheet | Vendor cloud platform |
| Setup time | Update Data Sheet and Refresh All | Manual dashboard setup | Implementation and onboarding |
| Customizable fields | Editable workbook, pivots, charts, and slicers | Editable but formulas can break | Limited by vendor settings |
| SaaS metrics | ARR, MRR, CAC, seats, NPS, status, plan, region, module | Must be built manually | Depends on plan and integrations |
| Year-1 cost at 5 users | $17.99 plus existing Excel access | Low tool cost plus build time | Often hundreds or thousands |
Who This Template Is For – and Who It’s Not For
This template is for ERP SaaS founders, startup operators, revenue operations managers, SaaS analysts, customer success leaders, product managers, and consultants who need a practical Excel view of ARR, MRR, CAC, seats, NPS, product modules, regions, customer segments, plans, and account status. It is not a live billing connector, CRM, ERP system, subscription management platform, data warehouse, or real-time product analytics tool.
How to Use the ERP SaaS Startups Dashboard in Excel
- Download and unzip the Excel file.
- Open the workbook in Microsoft Excel.
- Go to the Data Sheet and replace the sample records with your own ERP SaaS data.
- Keep the same headers and field structure.
- Click Data > Refresh All in the Excel Ribbon.
- Review each dashboard page and use slicers to filter by the available dimensions.
Real-World Use Cases
Nina, SaaS founder: Nina uses the Overview and Revenue Trends pages before investor updates to explain ARR, MRR, CAC, and account status in one workbook.
Omar, revenue operations manager: Omar reviews Customer Mix to see which industries, plan types, regions, and modules are producing the strongest revenue signals.
Leah, customer success lead: Leah checks Growth Health and Product Insights to connect implementation stage, active rate, NPS, and executive ownership.
Frequently Asked Questions
What does this dashboard track?
It tracks ARR, MRR, seats, records, NPS score, CAC, product module, status, customer segment, industry, region, plan type, implementation stage, startup, account executive, funding stage, sales channel, and active rate.
Do I need macros?
No. The workbook is designed around Excel tables, pivot tables, slicers, and charts.
How do I refresh the dashboard?
Update the Data Sheet, then click Data > Refresh All. The Support Sheet pivot tables and dashboard charts refresh together.
Can I customize it?
Yes. You can edit fields, charts, colors, slicers, sheet names, and pivot layouts in Excel. Keep a backup before changing source fields.
Is this a replacement for an ERP or CRM?
No. It is an Excel analytics template for prepared data, not an operational ERP, billing, CRM, or subscription platform.
Can I use it for a seed-stage SaaS startup?
Yes. It is useful for early-stage and growing SaaS teams that track recurring revenue and customer metrics in spreadsheet exports.
About the Author
Built by PK – Microsoft Certified Professional with 15+ years of Excel, Google Sheets, and Power BI experience. Founder of NextGenTemplates, reaching 300K+ subscribers across YouTube channels. Every template is hand-built and tested before release.
Explore Related Templates
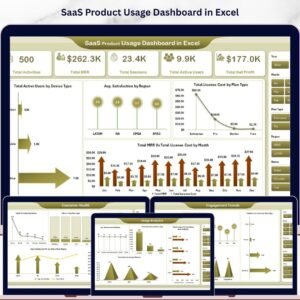
You may also like SaaS Product Usage Dashboard in Excel and SaaS Metrics Dashboard in Excel. Browse more Excel Dashboard templates and IT Excel templates.
Download the ERP SaaS Startups Dashboard in Excel today and turn ARR, MRR, CAC, seats, product module, customer mix, and growth health data into clear Excel reporting.
Last updated: June 9, 2026.


Reviews
There are no reviews yet.