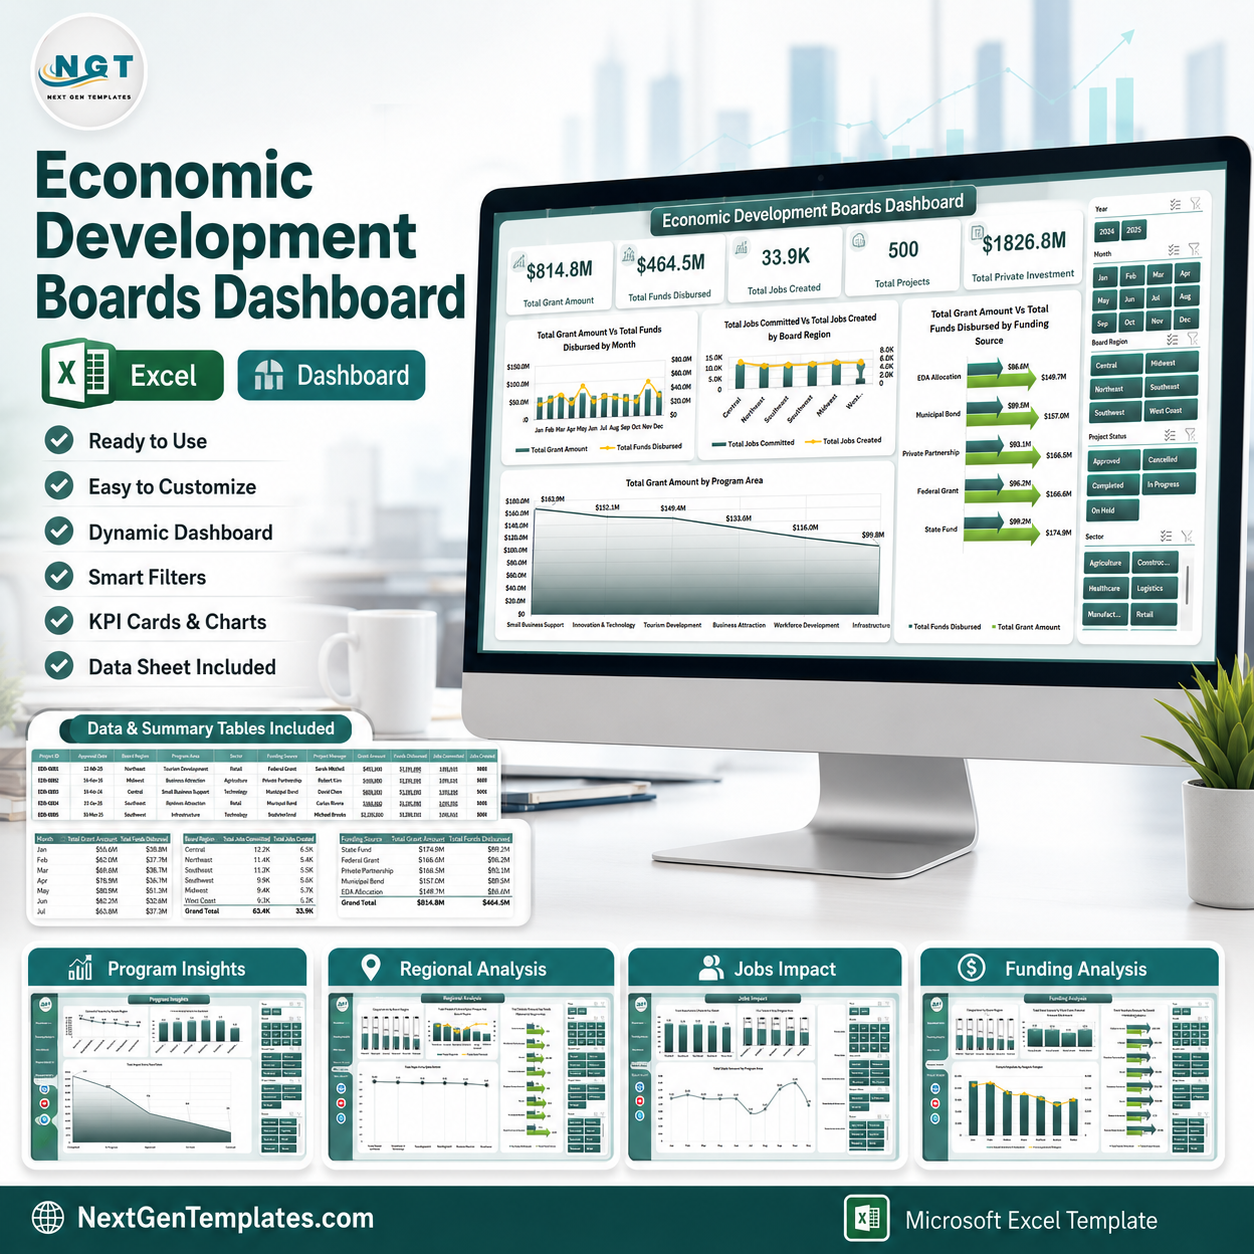
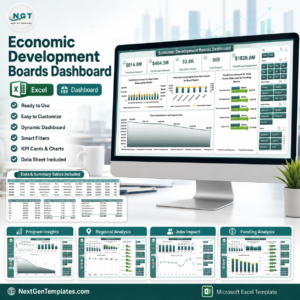
Economic development boards often manage grants, disbursements, private investment, projects, jobs, and regional outcomes across many programs at once. The Economic Development Boards Dashboard in Excel gives teams a ready-to-use reporting file with 5 analysis pages, 5 executive KPI cards, multiple slicers, a structured data sheet, and a support sheet powered by pivot tables. It is built for monthly reviews, board meetings, grant monitoring, and program impact reporting without a recurring software subscription.
Use it to replace scattered spreadsheets with one Excel dashboard that can be refreshed after updating the data sheet. Instant download, one-time payment, editable workbook, and no subscription lock-in.
Key Features of Economic Development Boards Dashboard in Excel
- 5 dashboard pages covering overview, funding, jobs impact, regional performance, and program insights.
- Executive KPI cards for Total Grant Amount, Total Funds Disbursed, Total Jobs Created, Total Projects, and Total Private Investment.
- Interactive slicers to filter the dashboard by region, month, funding source, sector, program area, and project status.
- Funding analysis visuals to compare grant amounts, disbursements, and funding source performance.
- Jobs and investment impact tracking for jobs committed, jobs created, businesses assisted, and private investment.
- Refreshable pivot structure so charts update when users replace the sample data and click Refresh All.
What’s Inside the Economic Development Boards Dashboard in Excel
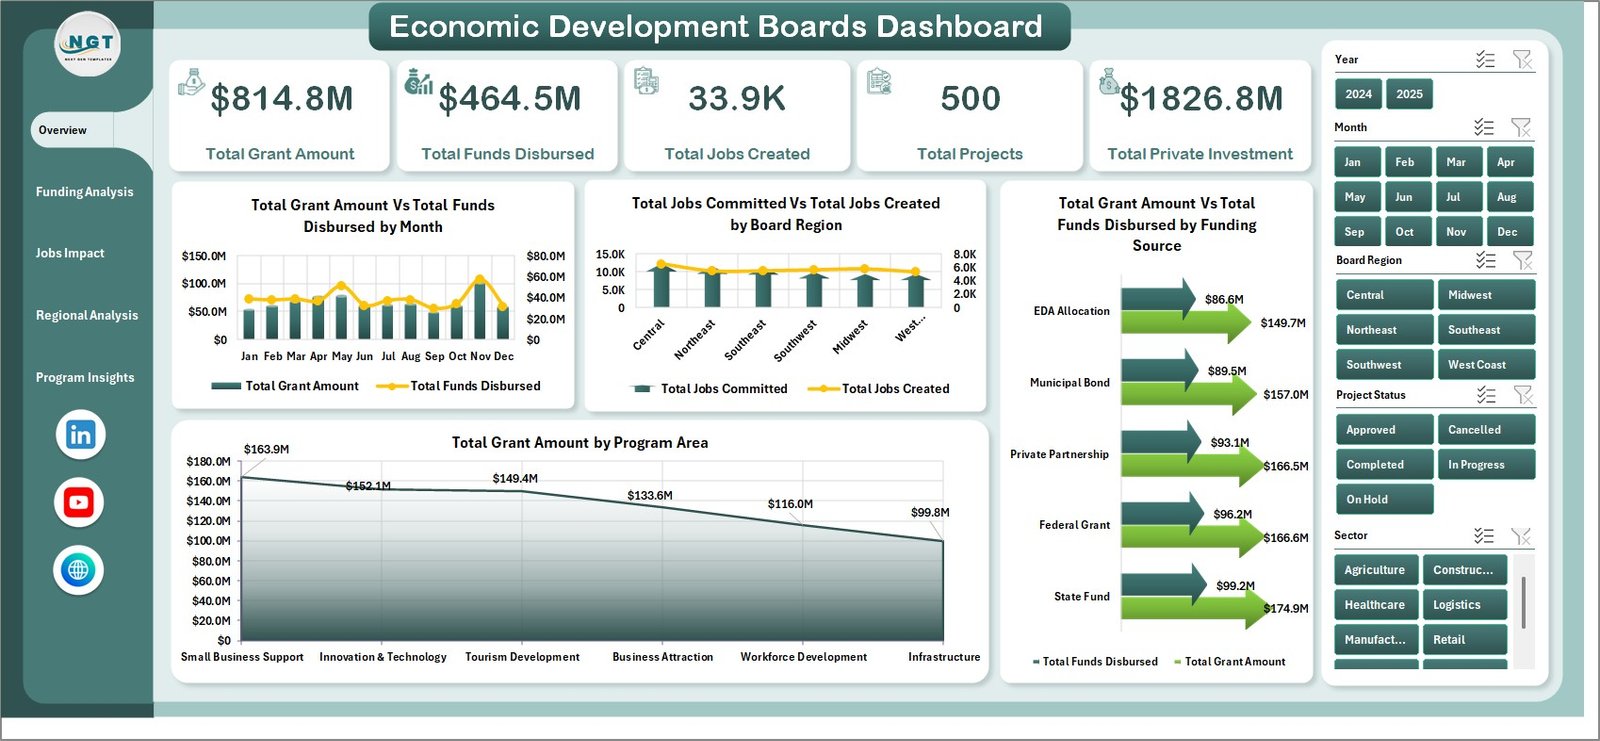
Overview Page
The Overview page shows the high-level health of economic development programs. KPI cards summarize total grants, disbursed funds, jobs created, project count, and private investment so leadership can read the main position in seconds.
The chart Total Grant Amount Vs Total Funds Disbursed by Month compares approved funding against actual disbursement timing. It helps teams see whether grant execution is keeping pace with awards across the year.
The chart Total Jobs Committed Vs Total Jobs Created by Board Region compares planned employment impact with realized jobs. This makes it easier to spot regions where projects are ahead of plan or need follow-up.
The chart Total Grant Amount Vs Total Funds Disbursed by Funding Source shows which funding streams are moving from approval to payout. It is useful for grant managers reviewing bottlenecks by source.
The chart Total Grant Amount by Program Area breaks grants across program areas. It helps board members understand where economic support is concentrated.
Economic Development Boards Dashboard in Excel
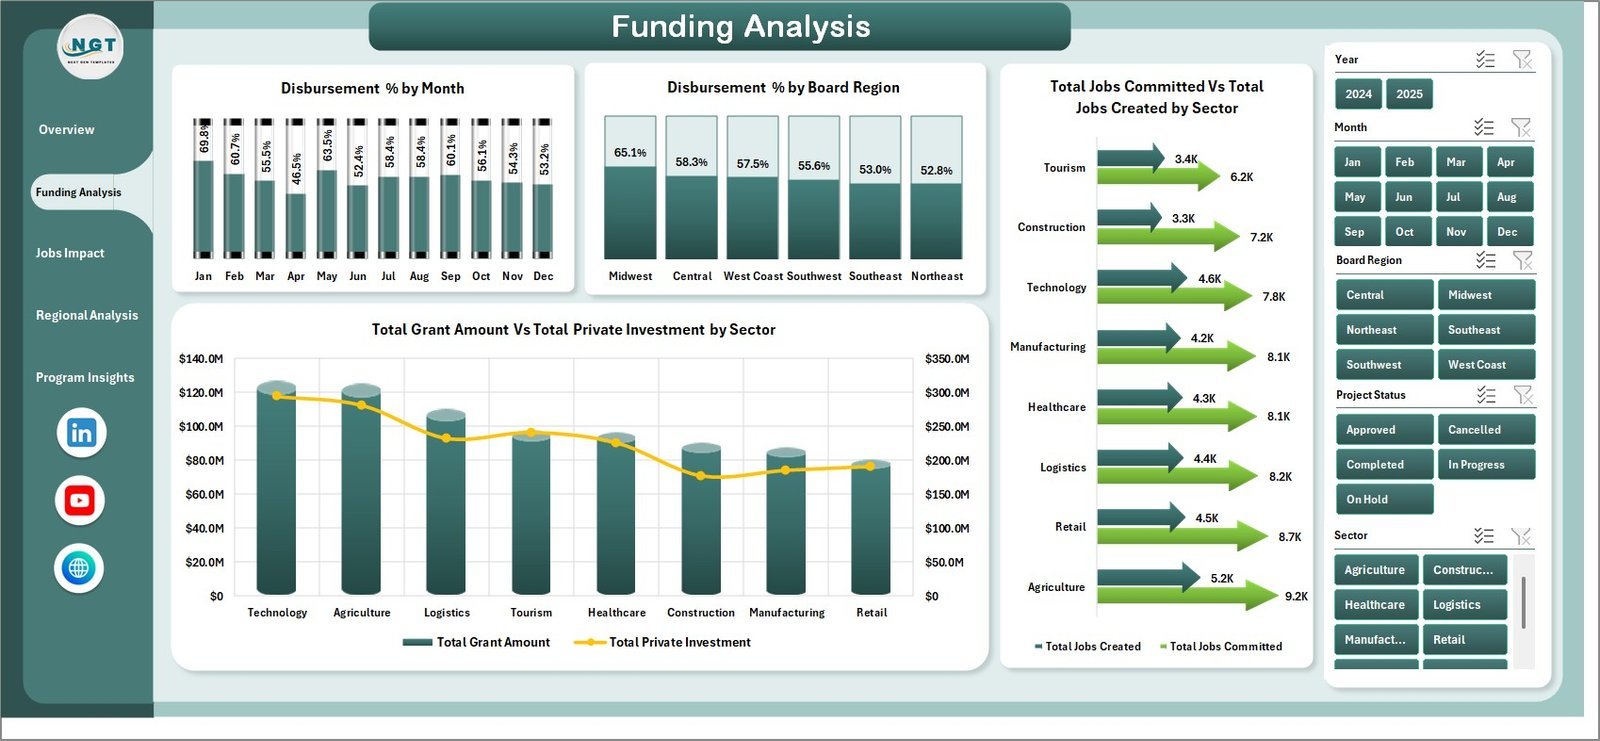
Funding Analysis
The Funding Analysis page focuses on payout performance and funding efficiency. It includes Disbursement % by Month, Disbursement % by Board Region, Jobs Committed vs Jobs Created by Sector, and Grant Amount vs Private Investment by Sector.

Funding Analysis
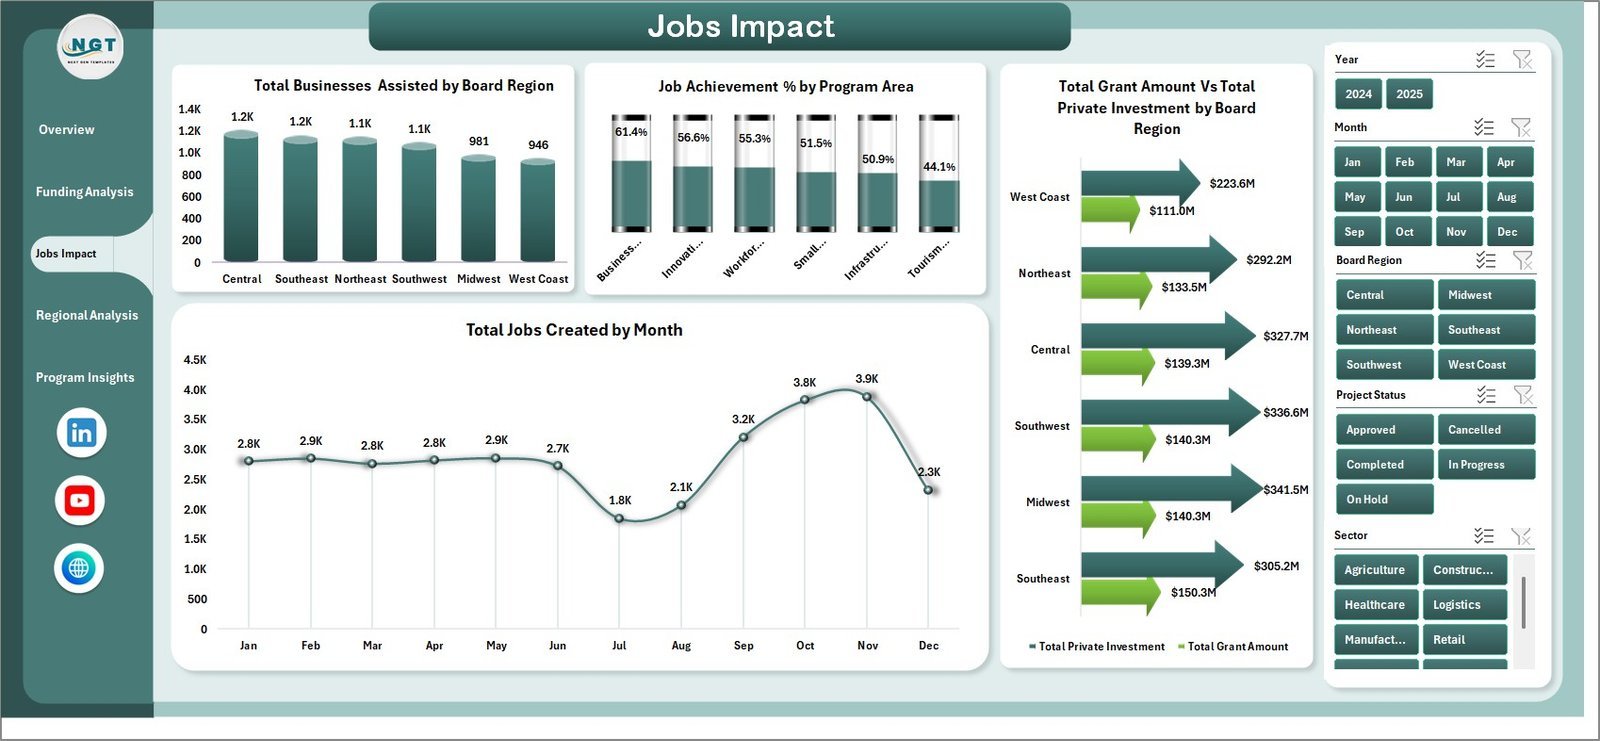
Jobs Impact
The Jobs Impact page connects public funding with employment and business support outcomes. It shows businesses assisted by region, job achievement percentage by program area, private investment by region, and monthly jobs created.
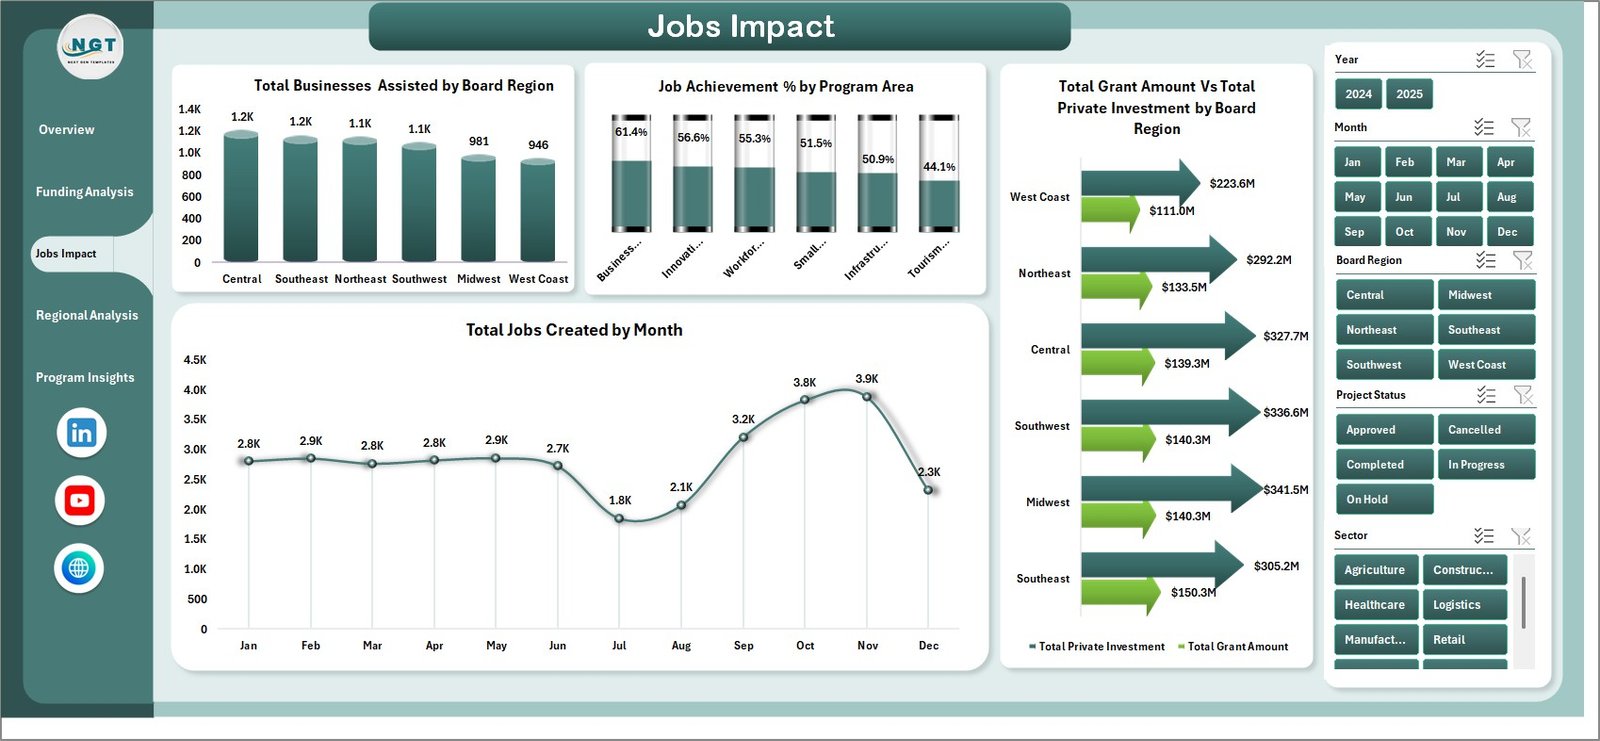
Jobs Impact
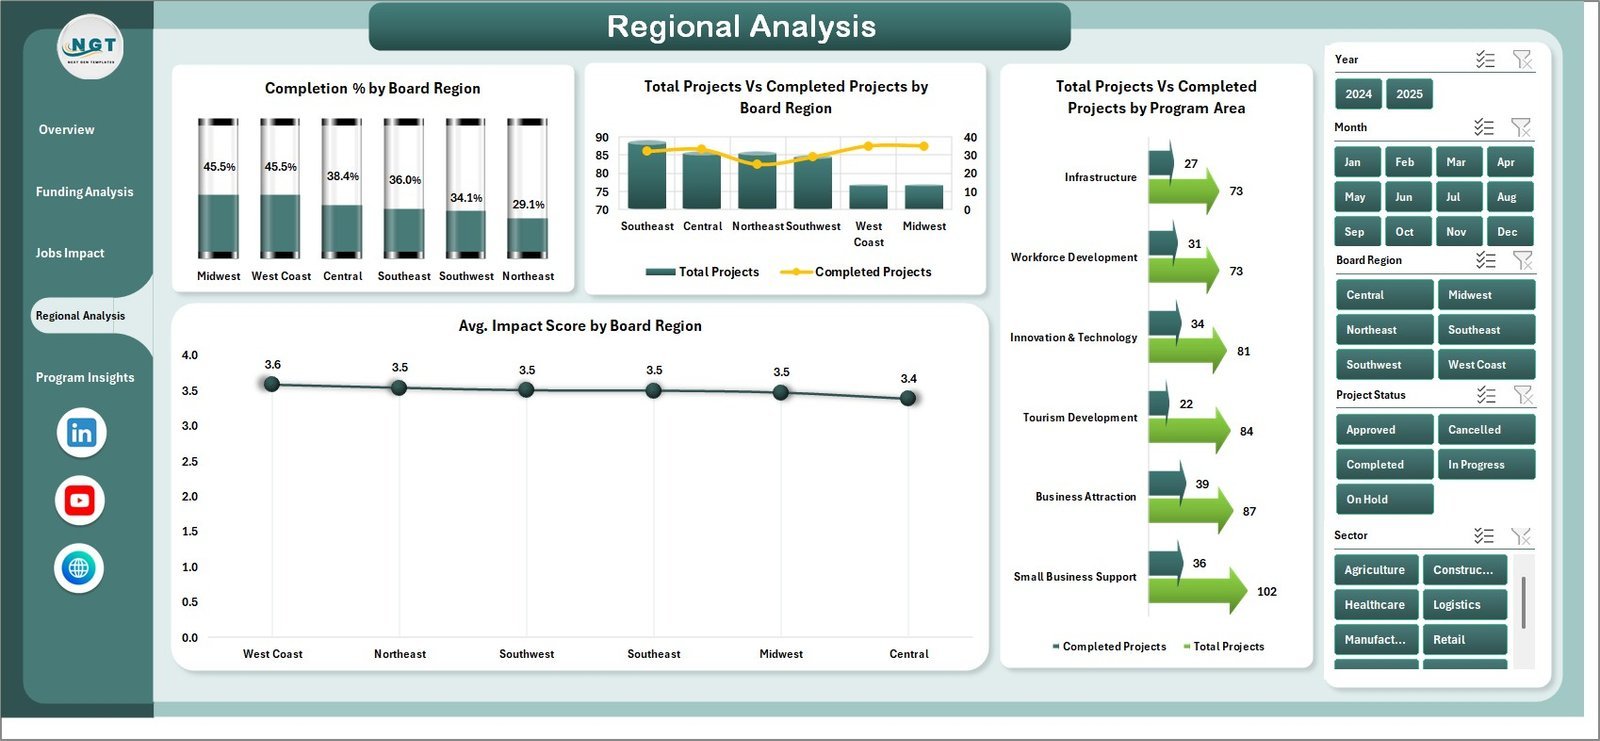
Regional Analysis
The Regional Analysis page helps compare completion rates, project delivery, and impact score across board regions. It highlights where programs are performing consistently and where implementation support may be needed.

Regional Analysis
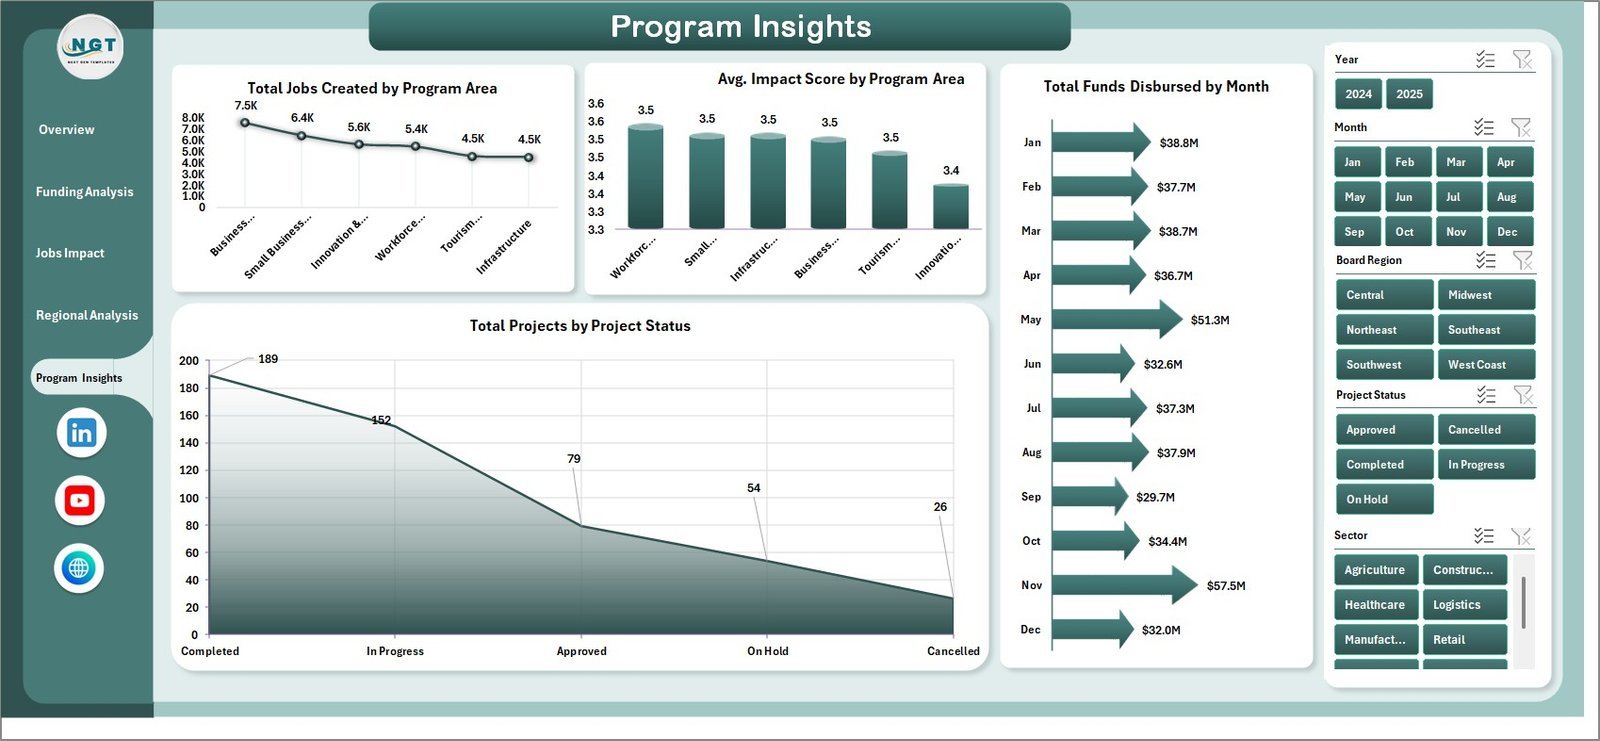
Program Insights
The Program Insights page reviews performance by program area and status. It includes jobs created, average impact score, funds disbursed by month, and total projects by project status.

Program Insights
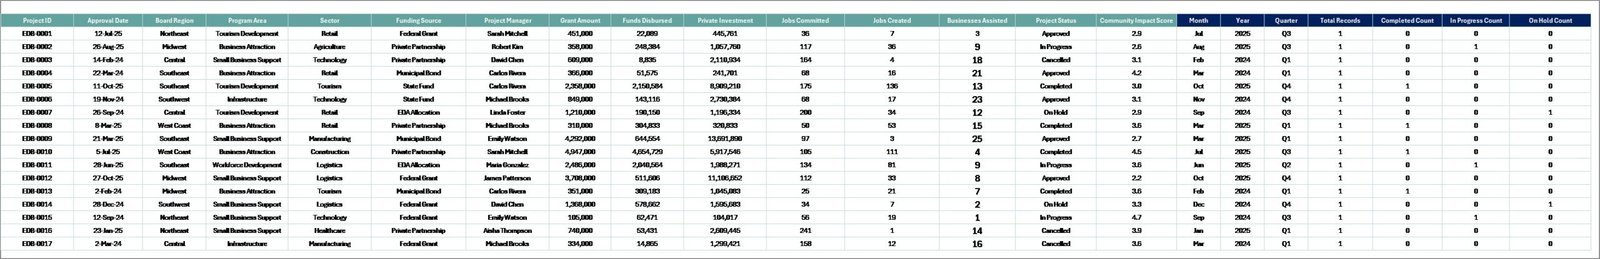
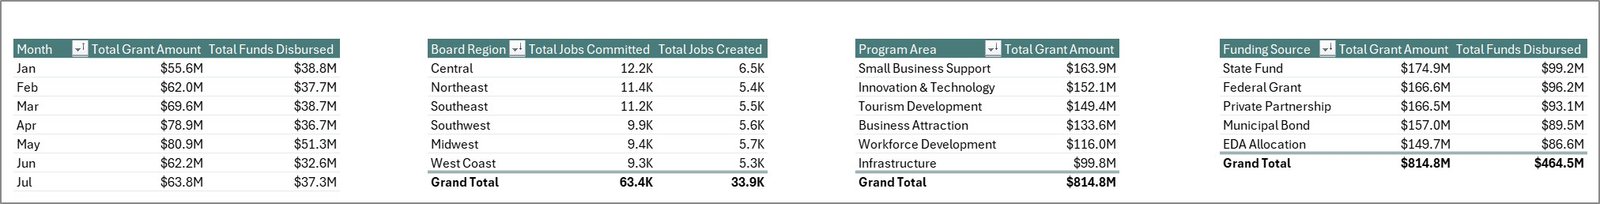
Data Sheet Tab
The Data sheet stores the input records in a structured format. Replace the sample rows with your own grant, region, sector, project, jobs, disbursement, and investment data while keeping the same column format.

Data Sheet tab
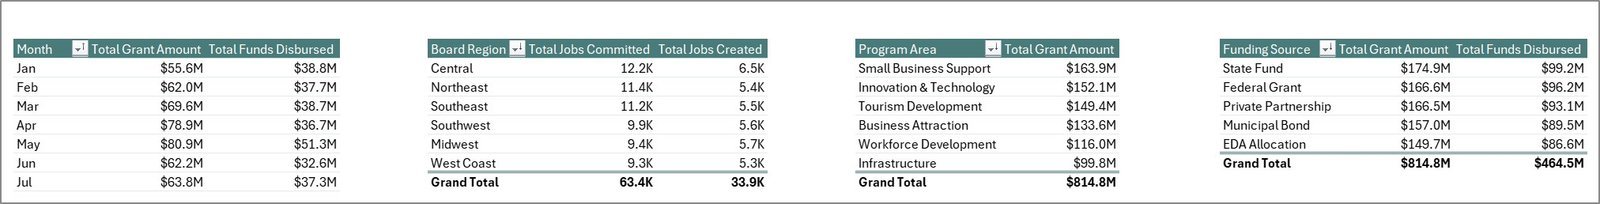
Support Sheet
The Support sheet contains pivot tables used to drive the dashboard charts. After updating the Data sheet, go to the Excel Data tab and click Refresh All. The pivots and charts refresh together, and the Support sheet can remain hidden for day-to-day users.
Support sheet tab
Economic Development Boards Dashboard in Excel vs. Google Sheets vs. Paid CRM/SaaS – Where This Fits
| Feature | Economic Development Boards Dashboard in Excel | Google Sheets Dashboard | Paid Grant Management SaaS |
|---|---|---|---|
| Cost | $17.99 one-time | Low cost, manual build | Often monthly or annual subscription |
| Platform | Microsoft Excel | Browser-based Sheets | Vendor cloud platform |
| Setup time | Under 15 minutes | Several hours to rebuild | Days or weeks with onboarding |
| Customizable fields | Fully editable workbook | Editable, but chart setup required | Limited by vendor configuration |
| Best fit | Board reporting and program analytics | Collaborative lightweight tracking | End-to-end grants workflow |
| Year-1 cost at 5 users | $17.99 total | Free to low cost plus build time | Hundreds to thousands of dollars |
Who This Template Is For – and Who It’s Not For
This template is for economic development boards, grant administrators, regional development agencies, public-sector analysts, non-profit program managers, and consultants preparing funding impact reports.
It is not for teams needing applicant portals, workflow approvals, case management, automated payments, or enterprise permission controls. In those cases, a dedicated grant management platform may be a better fit.
How to Use the Economic Development Boards Dashboard in Excel
- Download and unzip the file after purchase.
- Open the workbook in Microsoft Excel.
- Go to the Data sheet and replace the sample data with your own records.
- Keep the same column structure so pivot tables can refresh correctly.
- Go to the Data tab in the Excel Ribbon and click Refresh All.
- Use slicers on each dashboard page to filter by month, region, sector, funding source, and program area.
Real-World Use Cases
A regional economic development director uses the Overview page before board meetings to explain grant awards, disbursements, private investment, and job creation in one view.
A grant program analyst uses Funding Analysis to monitor monthly disbursement percentages and identify regions where approved funds are not moving fast enough.
A policy consultant uses Jobs Impact and Regional Analysis to prepare client-ready reports comparing program outcomes by sector, region, and program area.
Frequently Asked Questions
Does this dashboard work in Microsoft Excel?
Yes. The Economic Development Boards Dashboard in Excel is built for Microsoft Excel and uses Excel sheets, charts, slicers, and pivot tables.
Can I replace the sample data?
Yes. Add your own records in the Data sheet using the same structure, then click Refresh All from the Excel Data tab.
What pages are included?
The workbook includes Overview, Funding Analysis, Jobs Impact, Regional Analysis, Program Insights, Data Sheet, and Support Sheet tabs.
Can I hide the Support sheet?
Yes. The Support sheet contains pivot tables for the charts and can be hidden after setup.
Is this a grant management system?
No. It is an Excel dashboard for analytics and reporting. It does not include workflow approvals, applicant portals, or payment processing.
Can I customize the dashboard design?
Yes. Because it is an Excel workbook, you can edit charts, colors, slicers, formulas, and sheets to match your reporting style.
About the Author
Built by PK – Microsoft Certified Professional with 15+ years of Excel, Google Sheets, and Power BI experience. Founder of NextGenTemplates, reaching 300K+ subscribers across YouTube channels. Every template is hand-built and tested before release.
Explore Related Templates
For similar reporting needs, explore our Excel Dashboard templates, Excel KPI Dashboard templates, and the related Economic Development Boards KPI Dashboard in Excel. You may also like the Bridge Construction Dashboard in Excel for infrastructure reporting.
Download the Economic Development Boards Dashboard in Excel today and turn economic development data into a clean, refreshable Excel dashboard for board reporting and program reviews.
Watch the step-by-step video tutorial:


Reviews
There are no reviews yet.