Electricity infrastructure projects are complex, capital-intensive, and involve multiple stakeholders, contractors, engineers, and project managers. From power generation plants and transmission networks to renewable energy installations and grid upgrades, every electricity project requires precise planning and continuous monitoring. Without proper visibility into project performance, companies may face delays, cost overruns, and reduced profitability.
This is where the Electricity Project Dashboard in Power BI becomes a game-changing solution.
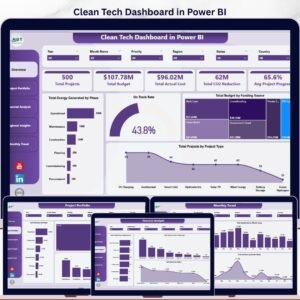
The Electricity Project Dashboard in Power BI is a powerful, interactive business intelligence tool designed to transform complex electricity project data into clear, actionable insights. Instead of relying on scattered spreadsheets and manual reports, organizations can monitor project performance using dynamic charts, KPI cards, and interactive filters.
With this dashboard, project managers and decision-makers can track project costs, expected revenue, expected profit, completion ratios, contractor performance, regional performance, and project delays in one centralized platform. As a result, electricity companies gain better control over project performance and can make faster, smarter decisions.
Whether you manage power generation projects, transmission lines, substations, renewable energy installations, or infrastructure upgrades, this dashboard helps you monitor operations efficiently and maximize profitability.
📊 Key Feature of Electricity Project Dashboard in Power BI
⚡ Interactive KPI Cards
Track critical electricity project metrics such as Project Cost, Expected Revenue, Expected Profit, Completion Ratio %, and Profit Margin % instantly.
📈 Five Powerful Dashboard Pages
The dashboard includes five dedicated pages: Overview, Project Type Analysis, Contractor Analysis, Region Analysis, and Monthly Trends Analysis.
📊 Dynamic Visualizations
Interactive charts help analyze project cost distribution, delayed projects, contractor performance, and revenue performance.
🧭 Advanced Filtering with Slicers
Users can quickly filter data using interactive slicers to explore specific project insights.
👷 Contractor Performance Tracking
Evaluate contractor efficiency through metrics like Expected Revenue, Profit Contribution, and Delay Percentage.
🌍 Regional Performance Analysis
Identify regions with higher delays, higher investments, or faster project completion.
📅 Monthly Trend Monitoring
Analyze project activity, costs, and revenue patterns across different months.
⚡ Power BI Interactive Experience
Fully interactive visuals allow users to explore electricity project data in real time.
📦 What’s Inside the Electricity Project Dashboard in Power BI
This ready-to-use Power BI dashboard includes five professionally designed pages:
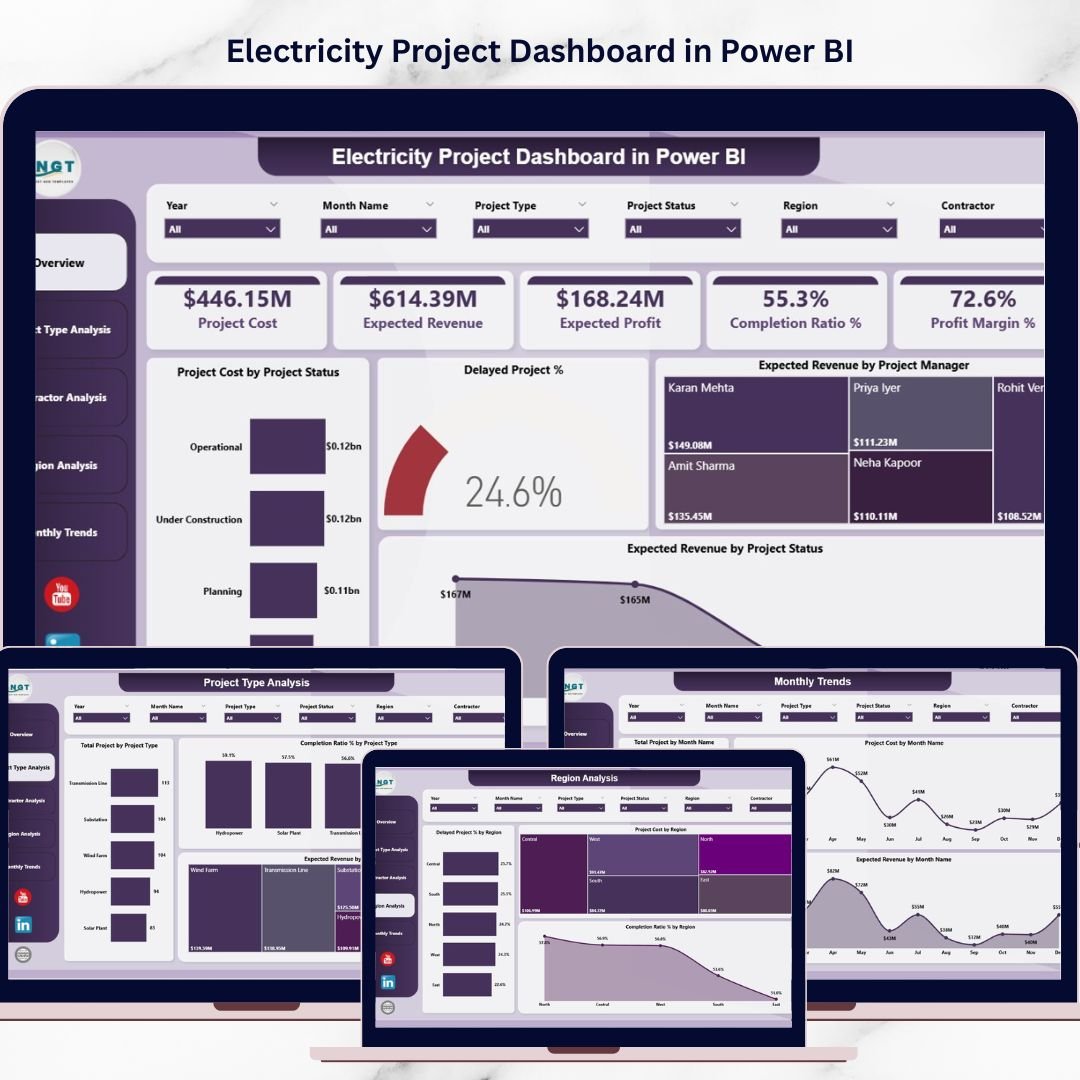
1️⃣ Overview Page
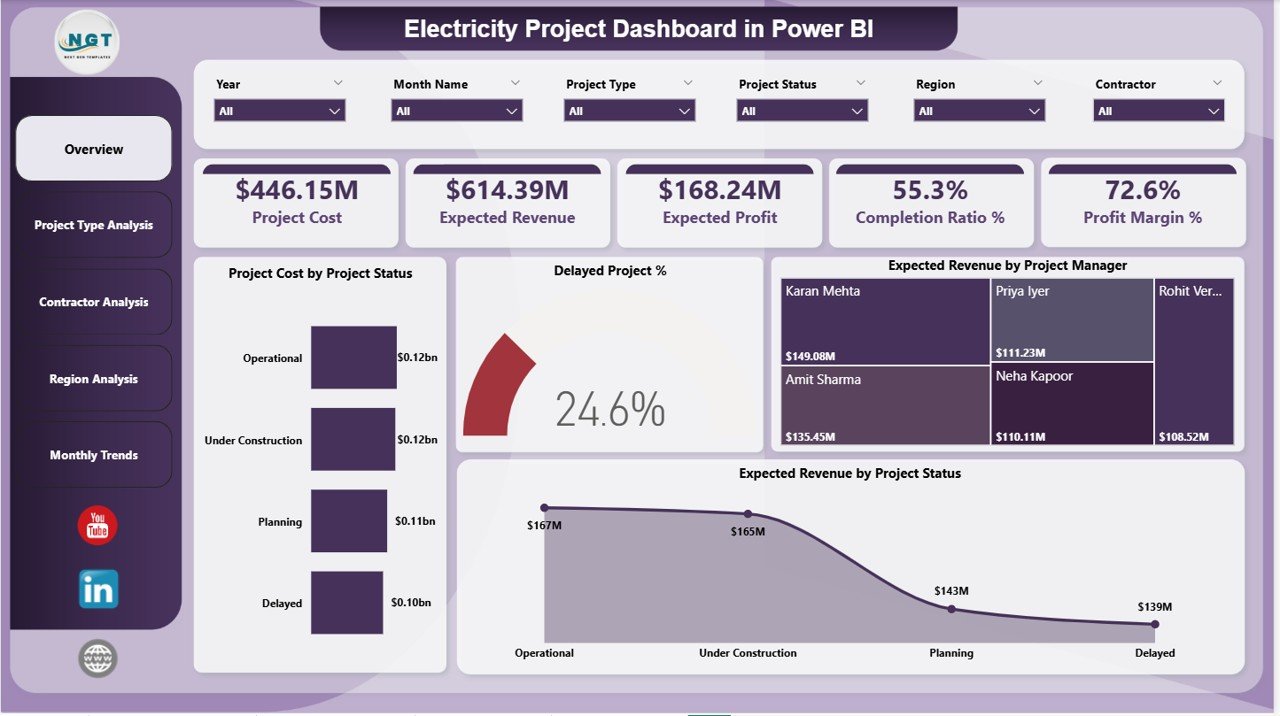
The Overview page acts as the main control center. It displays important KPIs such as Project Cost, Expected Revenue, Expected Profit, Completion Ratio %, and Profit Margin %. Additionally, it contains charts like Project Cost by Project Status, Delayed Project %, Expected Revenue by Project Manager, and Expected Revenue by Project Status.
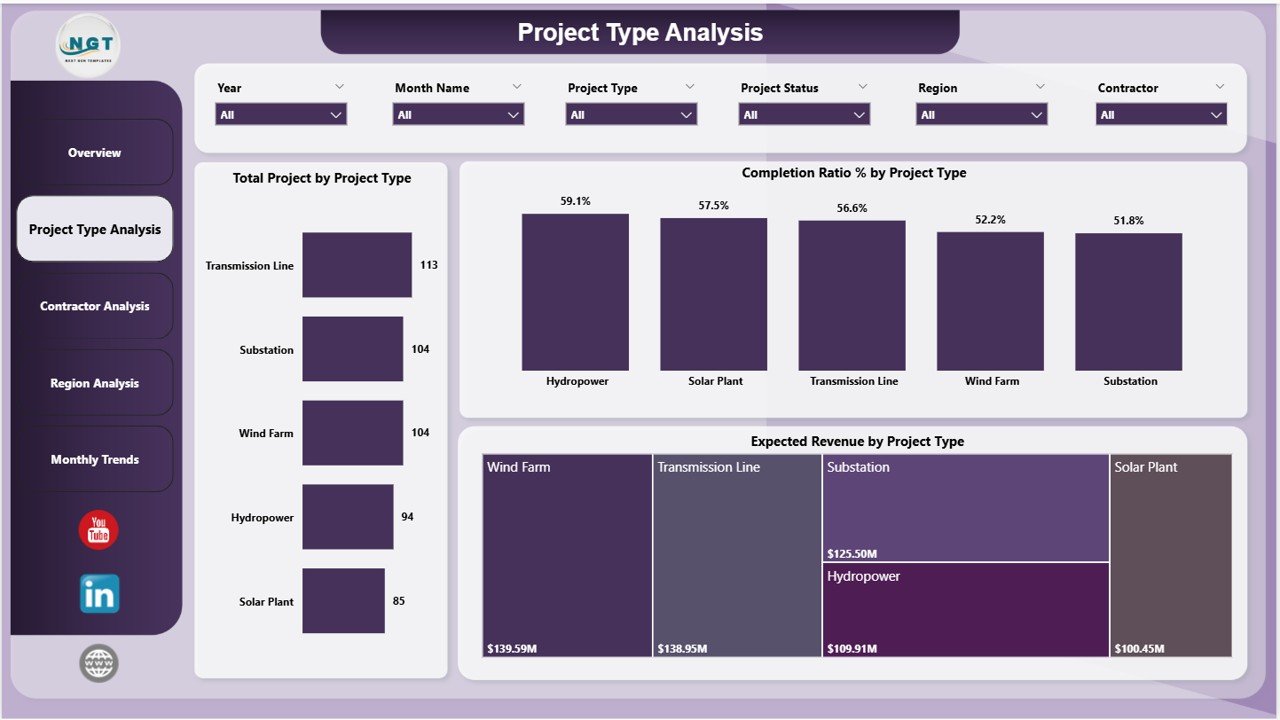
2️⃣ Project Type Analysis
This page analyzes electricity projects by category. It includes charts such as Total Projects by Project Type, Completion Ratio % by Project Type, and Expected Revenue by Project Type.
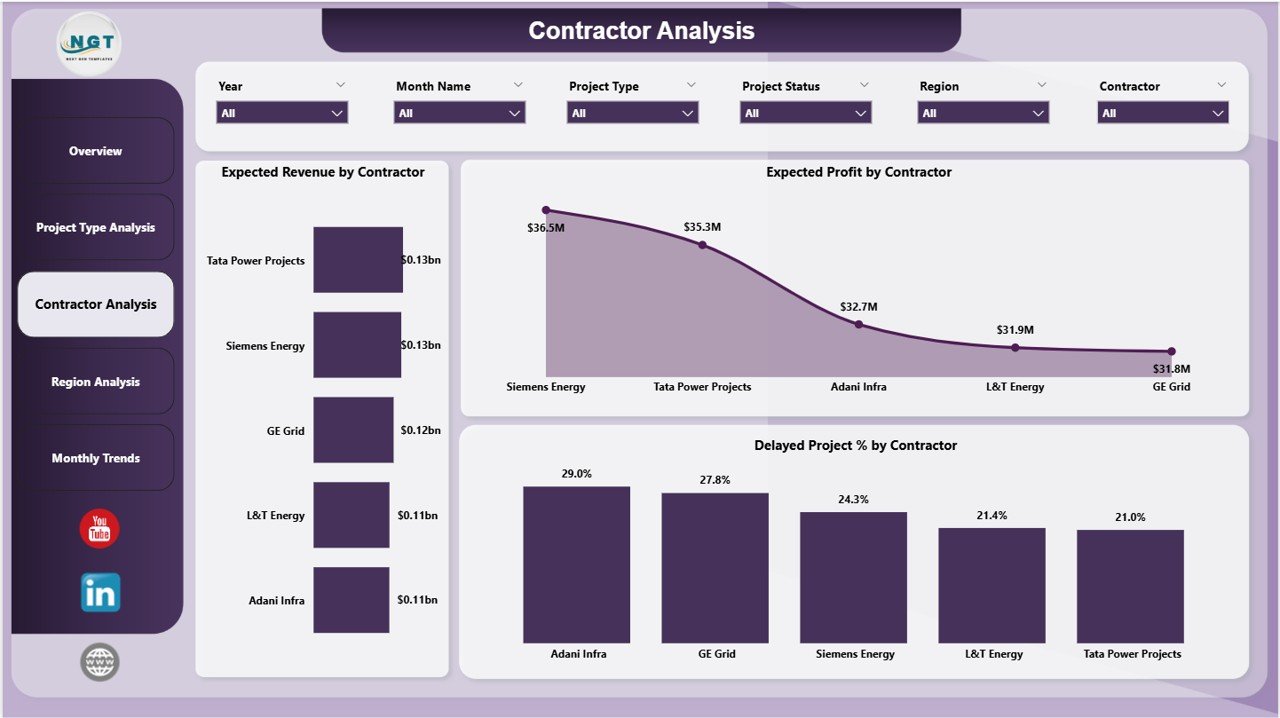
3️⃣ Contractor Analysis
The Contractor Analysis page evaluates contractor efficiency. Charts include Expected Revenue by Contractor, Expected Profit by Contractor, and Delayed Project % by Contractor.
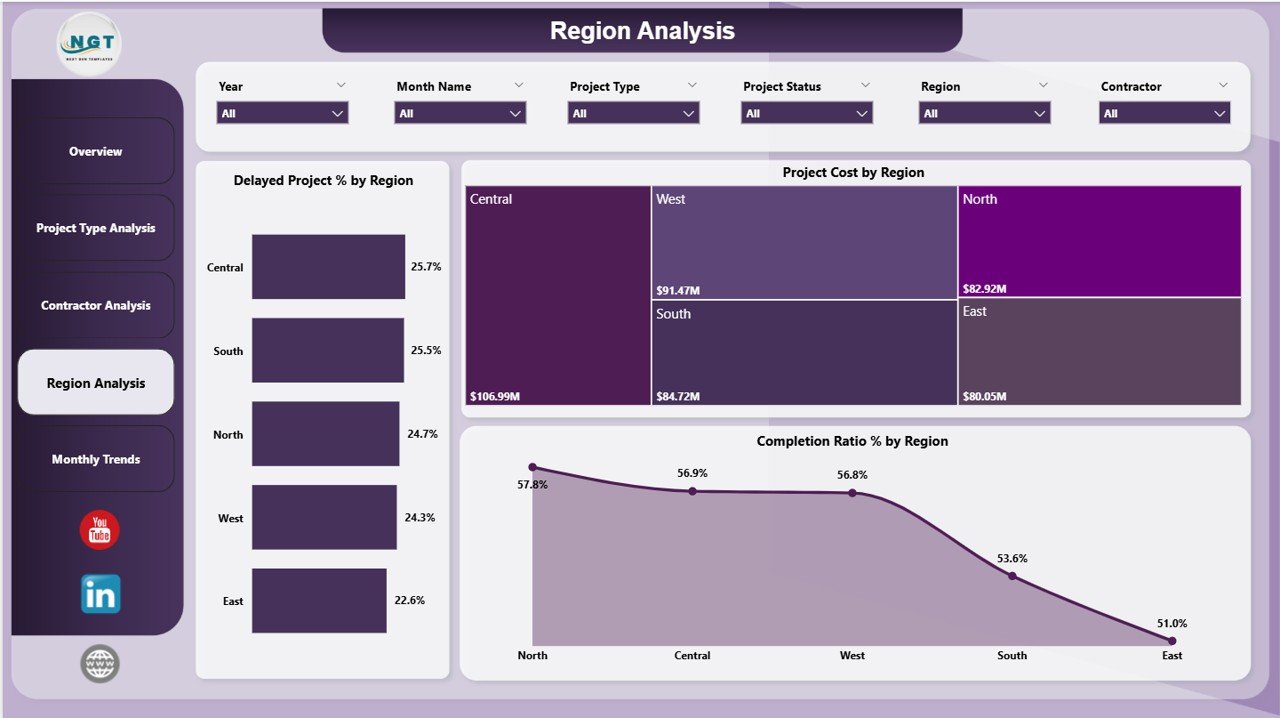
4️⃣ Region Analysis
This page provides insights into regional project performance through charts such as Delayed Project % by Region, Project Cost by Region, and Completion Ratio % by region.
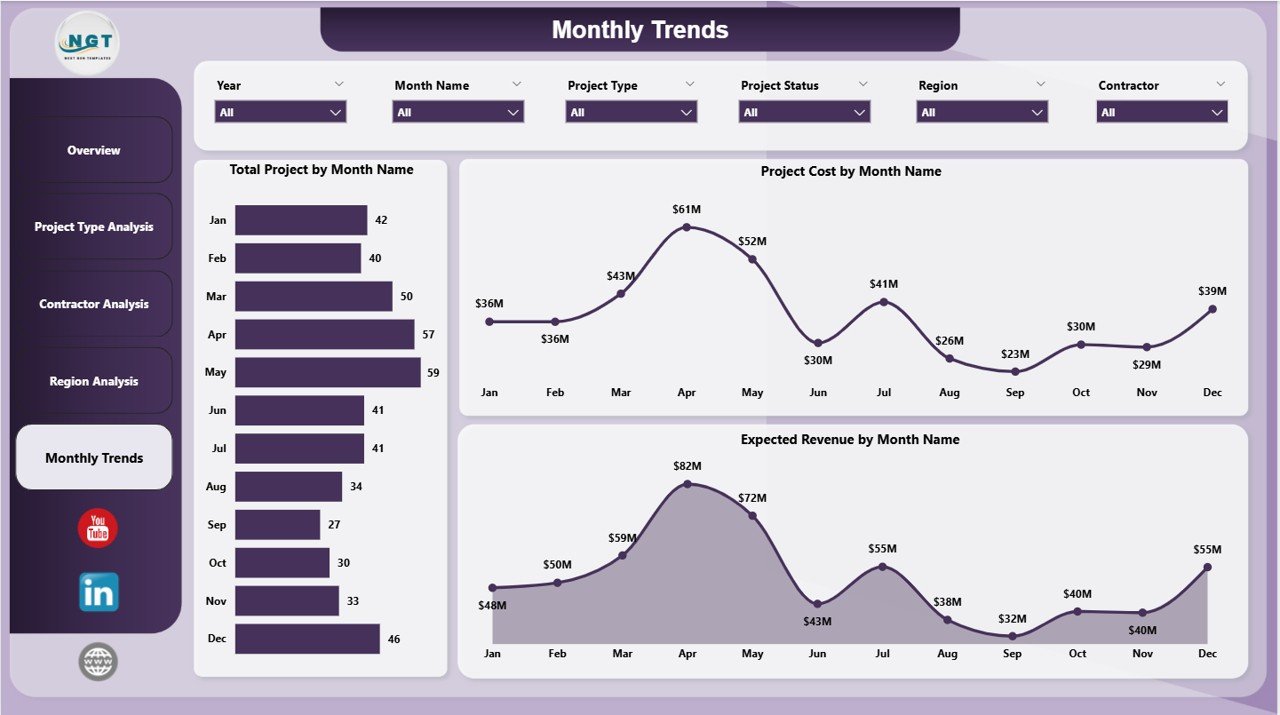
5️⃣ Monthly Trends Analysis
The Monthly Trends page helps managers analyze trends using charts like Total Projects by Month Name, Project Cost by Month Name, and Expected Revenue by Month Name.
⚙️ How to Use the Electricity Project Dashboard in Power BI
Using this dashboard is simple and user-friendly.
First, connect your electricity project dataset to the Power BI dashboard. After importing your data, the dashboard automatically visualizes project information using interactive charts and KPI indicators.
Next, use the built-in slicers and filters to analyze project performance based on project type, contractor, region, or time period.
Managers can instantly identify delayed projects, cost distribution, revenue forecasts, and profitability metrics. Furthermore, users can explore deeper insights by switching between dashboard pages.
Because Power BI updates dashboards quickly, organizations can monitor project performance regularly and make informed decisions.
👨💼 Who Can Benefit from This Electricity Project Dashboard in Power BI
⚡ Project Managers
Monitor project progress, completion ratios, and delays efficiently.
⚡ Electricity and Energy Companies
Track multiple infrastructure projects across different regions.
⚡ Infrastructure Developers
Evaluate contractor performance and project profitability.
⚡ Financial Analysts
Analyze project investment, expected revenue, and profit margins.
⚡ Renewable Energy Organizations
Monitor solar, wind, hydro, and renewable infrastructure projects.
⚡ Government Energy Departments
Track and manage public electricity infrastructure development.
This dashboard is ideal for any organization involved in electricity infrastructure planning, project management, or energy sector analytics.
Click here to read the Detailed blog post
Visit our YouTube channel to learn step-by-step video tutorials
👉 https://youtube.com/@PKAnExcelExpert