
The 3D Printing Manufacturing Dashboard in Power BI is a powerful and ready-to-use analytics solution designed to help manufacturers monitor production performance, control operational costs, and improve decision-making. As additive manufacturing becomes more widely adopted across industries such as aerospace, automotive, healthcare, and electronics, companies must monitor several operational variables including machine costs, labor hours, material consumption, product performance, and overall profitability.
However, many organizations still manage their manufacturing data through scattered spreadsheets and disconnected reports. This often leads to poor visibility, inefficient production planning, and higher operational costs.
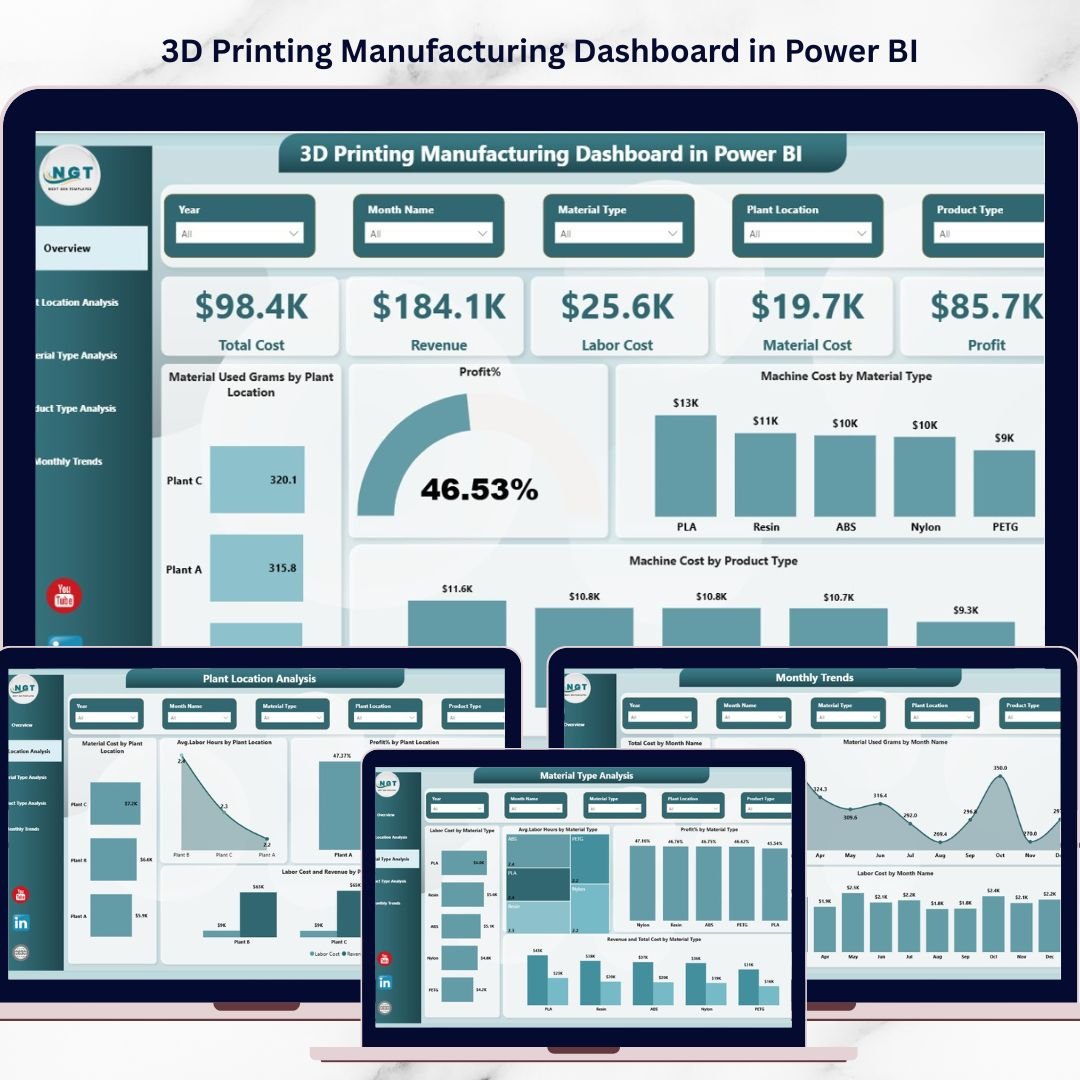
The 3D Printing Manufacturing Dashboard in Power BI solves this problem by transforming complex manufacturing data into clear, interactive visual insights. With this dashboard, decision-makers can easily track production metrics, evaluate profitability, analyze material usage, and identify operational inefficiencies — all from a single centralized dashboard.
Because the dashboard is built using Power BI’s powerful data visualization and filtering capabilities, users can explore insights by plant location, material type, product category, and month. As a result, manufacturers gain complete visibility into their additive manufacturing operations and can quickly identify areas for improvement.
Whether you are a manufacturing manager, operations analyst, production planner, or business executive, this dashboard will help you make faster, smarter, and more data-driven decisions.
Key Feature of 3D Printing Manufacturing Dashboard in Power BI 🚀
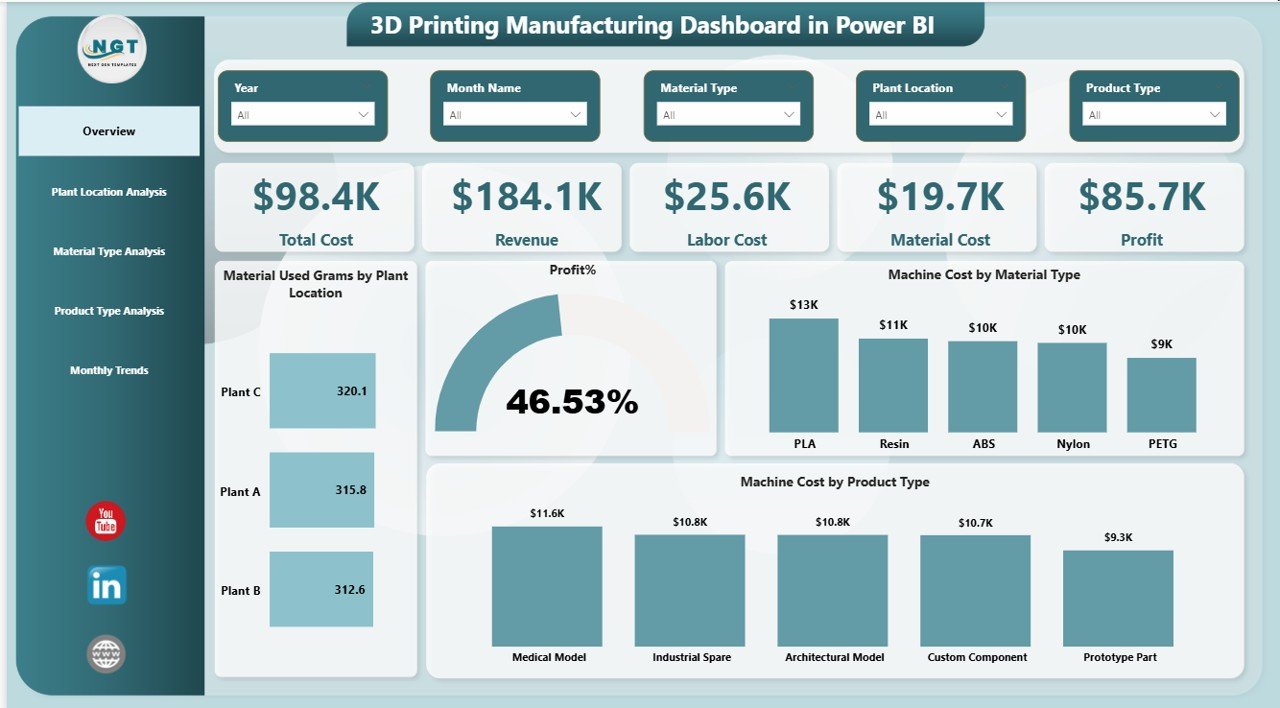
📊 Interactive Manufacturing Overview Dashboard
Monitor key financial and operational metrics including total cost, revenue, labor cost, material cost, and profit in one unified view.
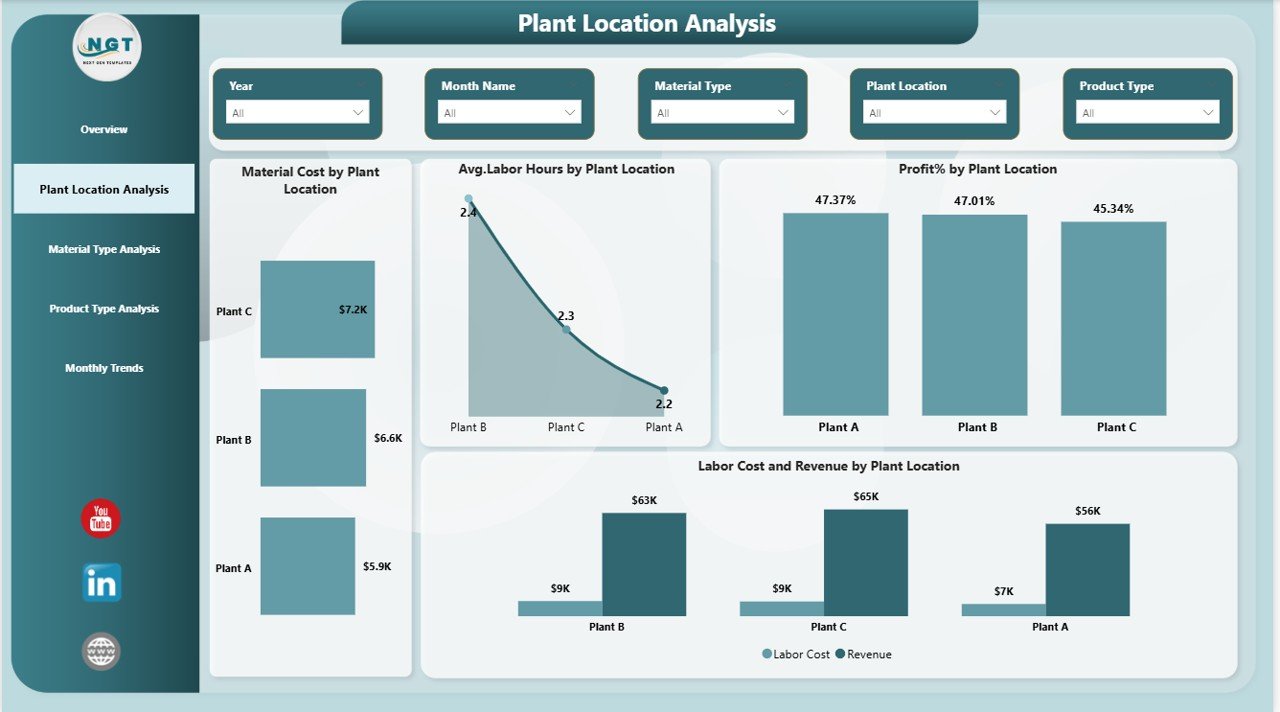
🏭 Plant Location Performance Analysis
Compare performance across multiple manufacturing facilities and identify high-performing plants or operational inefficiencies.
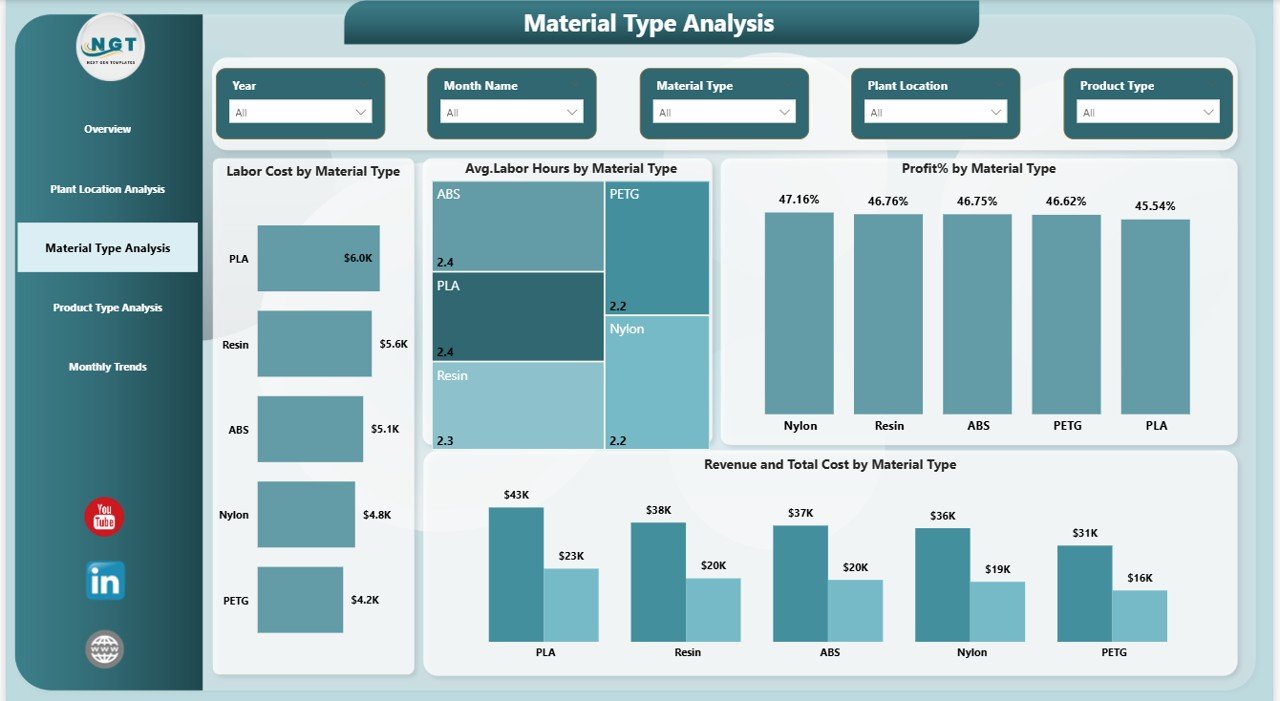
🧱 Material Type Cost Analysis
Analyze how different printing materials affect machine costs, labor hours, and profitability.
📦 Product Type Performance Insights
Understand which product categories generate the highest cost, require more production time, or deliver higher profit margins.
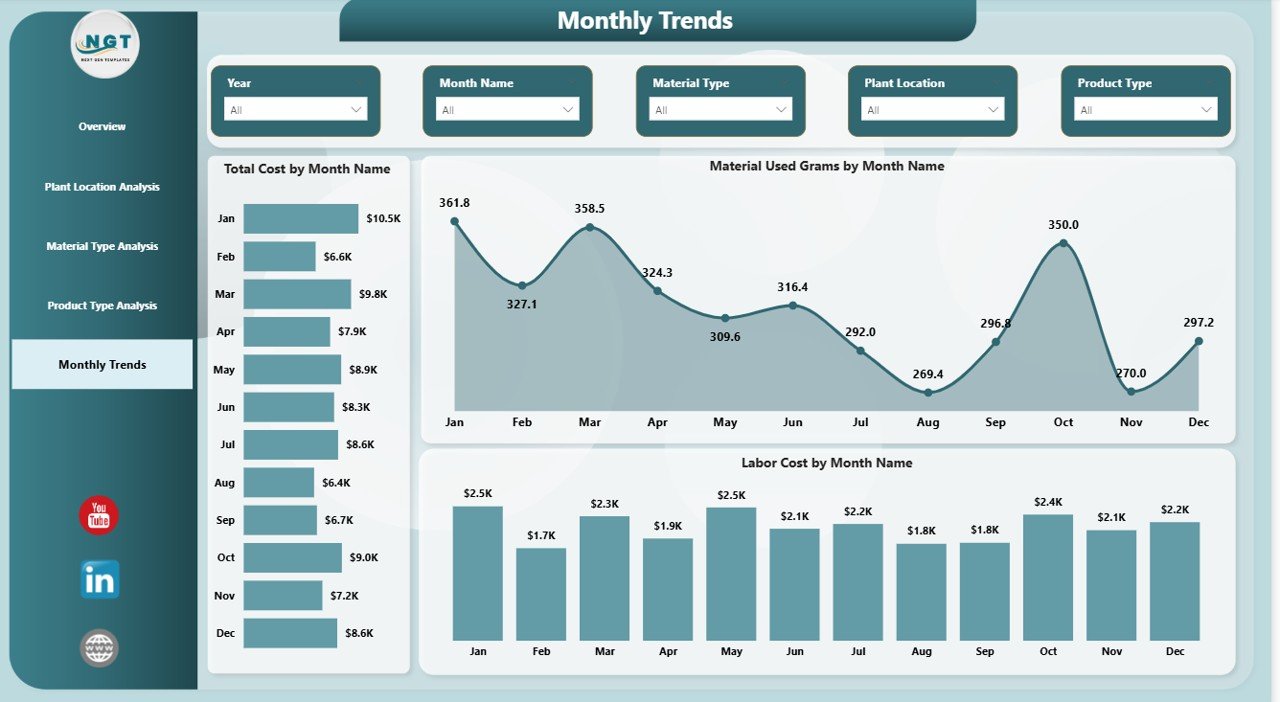
📅 Monthly Production Trend Analysis
Track how manufacturing costs, labor expenses, and material consumption change throughout the year.
⚙️ Advanced Power BI Visualizations
Interactive charts, slicers, and filters allow users to analyze manufacturing data from multiple perspectives instantly.
📈 Profitability Monitoring
Evaluate profit percentage and identify which materials, products, or locations contribute most to revenue.
🔍 Operational Efficiency Tracking
Quickly identify bottlenecks in production such as excessive labor hours or high machine operating costs.
What’s Inside the 3D Printing Manufacturing Dashboard in Power BI 📦
This ready-to-use Power BI solution includes five powerful analytical pages designed to monitor manufacturing performance from multiple perspectives.
Overview Page
Provides a quick snapshot of overall manufacturing performance with KPI cards and analytical charts.
Plant Location Analysis Page
Compares material costs, labor hours, profit percentage, and revenue across manufacturing plants.
Material Type Analysis Page
Evaluates how different printing materials impact labor cost, production time, and profitability.
Product Type Analysis Page
Highlights production cost, average print time, labor hours, and quality score for different product categories.
Month Analysis Page
Tracks cost trends, material usage, and labor expenses across different months.
How to Use the 3D Printing Manufacturing Dashboard in Power BI ⚙️
Using this dashboard is simple and straightforward.
1️⃣ Collect Manufacturing Data
Gather production data including material usage, machine cost, labor hours, product types, and revenue.
2️⃣ Prepare Structured Data
Organize the dataset using fields such as date, plant location, material type, product category, and cost metrics.
3️⃣ Load the Data into Power BI
Import the dataset into the Power BI dashboard template.
4️⃣ Refresh the Dashboard
Once the data is connected, simply refresh the dashboard to update all charts automatically.
5️⃣ Use Filters and Slicers
Analyze performance by filtering data using plant location, material type, product type, or month.
Who Can Benefit from This 3D Printing Manufacturing Dashboard 🎯
This dashboard is extremely valuable for organizations involved in additive manufacturing and production analytics.
🏭 Manufacturing Companies using 3D Printing
📊 Production Managers and Operations Leaders
📈 Business Intelligence Analysts
💼 Manufacturing Consultants
🔬 Engineering and Product Development Teams
🏢 Industrial Automation and Smart Manufacturing Firms
If your organization wants to reduce production costs, improve operational efficiency, and monitor profitability, this dashboard provides the perfect analytical solution.
Click here to read the Detailed blog post
Watch the step-by-step video tutorial:


