Is your IT team drowning in ticket reports, spreadsheets, and manual updates? If yes, you’re not alone.
Managing IT operations without structured reporting creates confusion, missed SLAs, rising ticket backlogs, and poor visibility into agent performance. Many organizations still rely on disconnected spreadsheets, making it difficult for IT managers to monitor ticket volume, resolution time, priority handling, and department efficiency in one centralized view.
The IT Dashboard in Google Sheets solves this problem completely.
This ready-to-use, interactive dashboard transforms raw ticket data into meaningful performance insights. Instead of analyzing complex tables manually, managers get visual summaries, KPI cards, and dynamic charts that update instantly based on selected filters.
Built entirely in Google Sheets, this dashboard allows real-time collaboration, easy customization, and seamless performance tracking — without expensive BI tools or complex setup.
If you want full visibility, improved SLA compliance, and smarter IT performance management, this dashboard is built for you.
🚀 Key Feature of IT Dashboard in Google Sheets
✅ Interactive KPI Cards – Instantly monitor Total Tickets, Open Tickets, SLA Compliance, and Resolution Time.
✅ Dynamic Dropdown Filters – Analyze performance by Year, Month, Department, Ticket Type, Priority, Status, and Assigned Agent.
✅ Department-Level Analysis – Compare SLA performance and efficiency across teams.
✅ Agent Productivity Tracking – Measure resolution time and ticket handling efficiency.
✅ Ticket Type Performance Insights – Identify high-volume or problematic ticket categories.
✅ Monthly Trend Analysis – Track SLA compliance and ticket trends over time.
✅ Cloud-Based Collaboration – Multiple users access in real time.
✅ Easy Customization – Modify KPIs and filters based on your IT structure.
This dashboard becomes your IT performance command center.
📦 What’s Inside the IT Dashboard in Google Sheets
This dashboard includes multiple structured analysis pages:
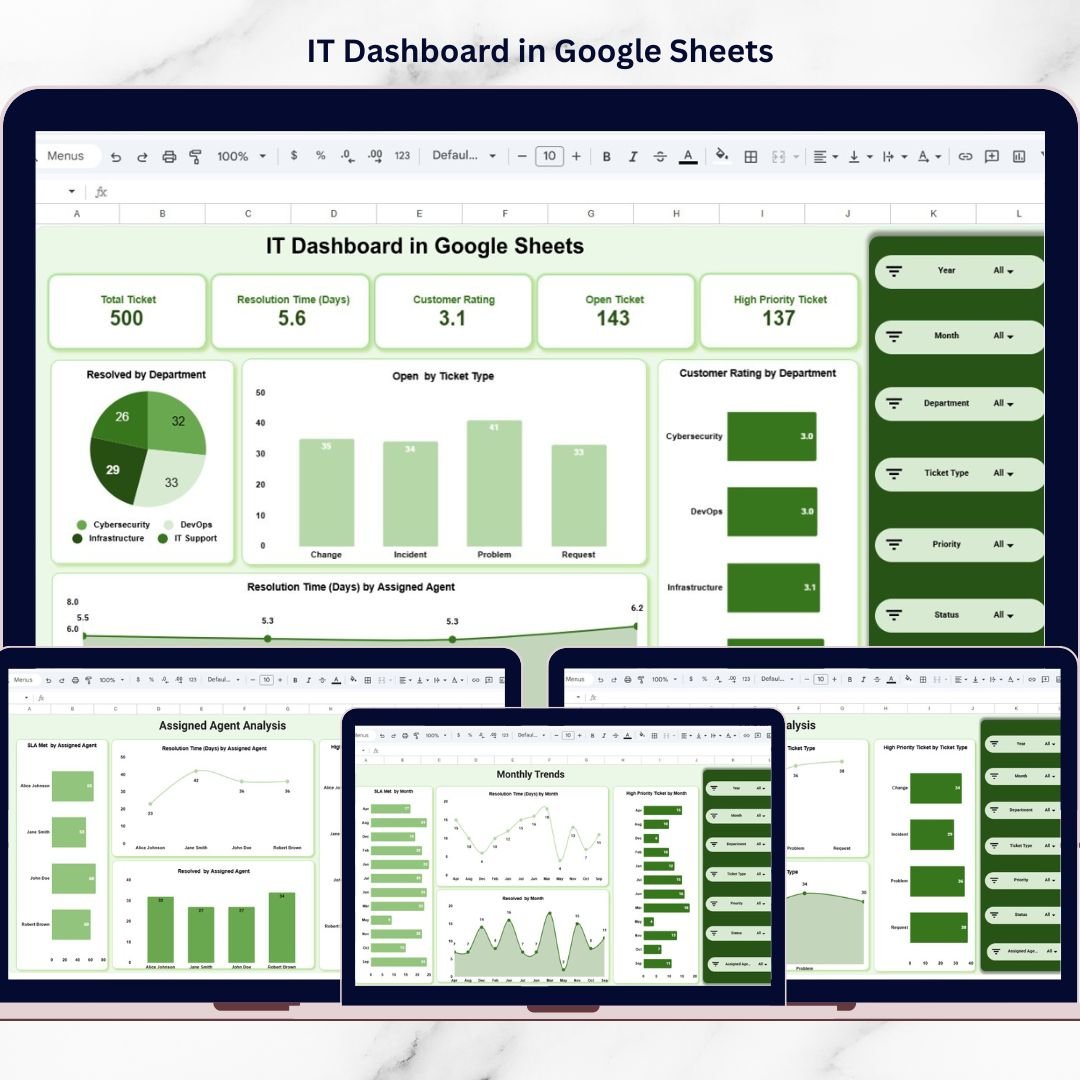
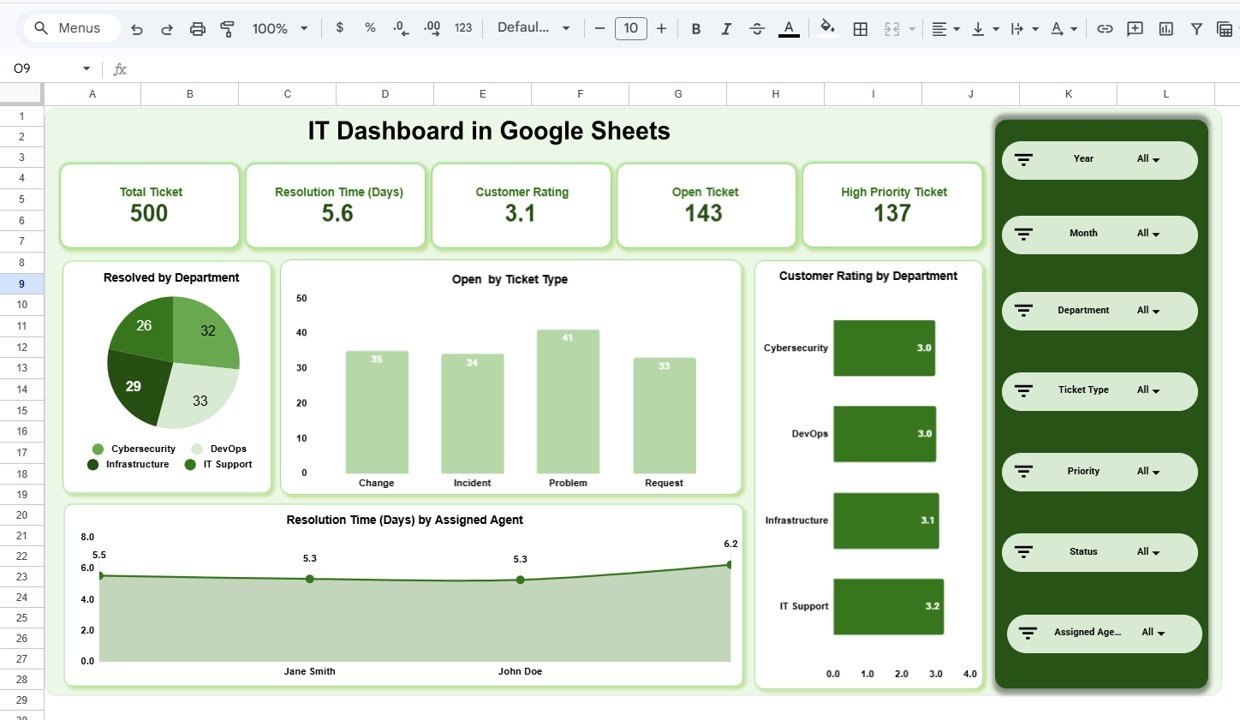
1️⃣ Main Dashboard Page
-
KPI Summary Cards (Total Tickets, Avg Resolution Time, Customer Rating, Open Tickets, High Priority Tickets)
-
Resolved Tickets by Department
-
Open Tickets by Ticket Type
-
Customer Rating by Department
-
Resolution Time by Assigned Agent
This page gives leadership a quick overview of IT health.
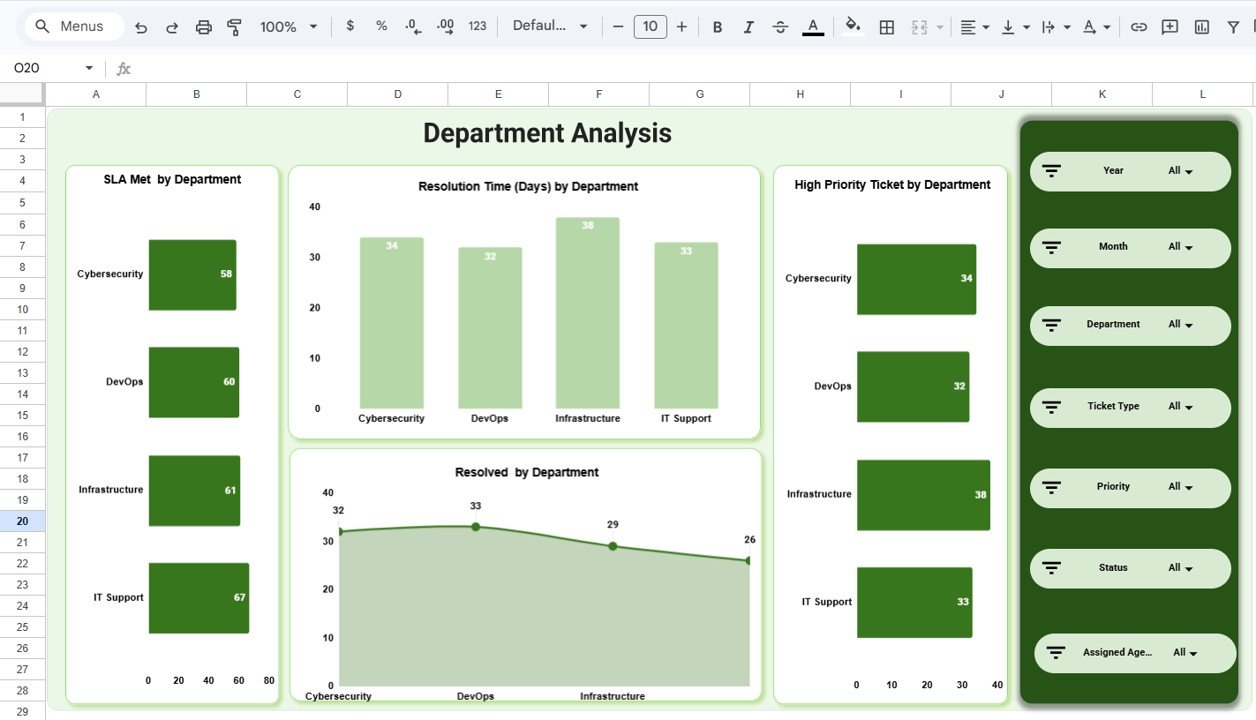
2️⃣ Department Analysis Page
-
SLA Met by Department
-
Resolution Time by Department
-
High Priority Tickets by Department
-
Tickets Resolved by Department
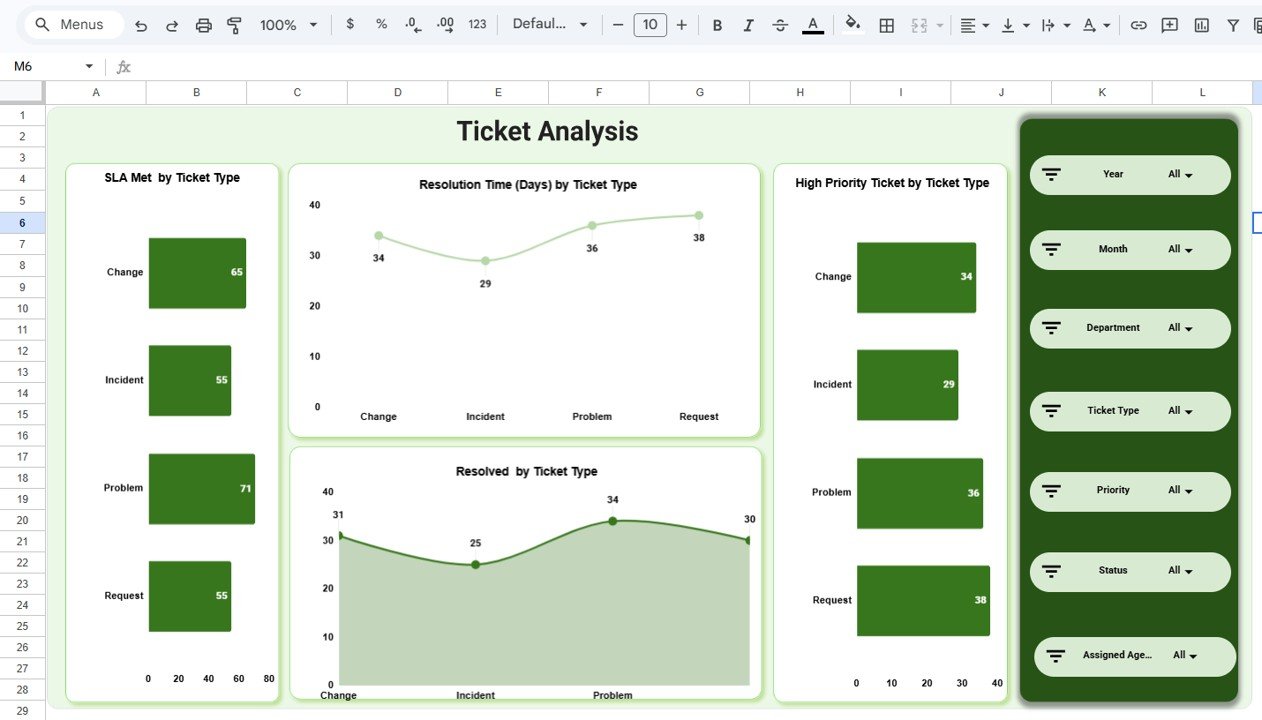
3️⃣ Ticket Analysis Page
-
SLA Compliance by Ticket Type
-
Resolution Time by Ticket Type
-
High Priority Ticket Distribution
-
Ticket Resolution Breakdown
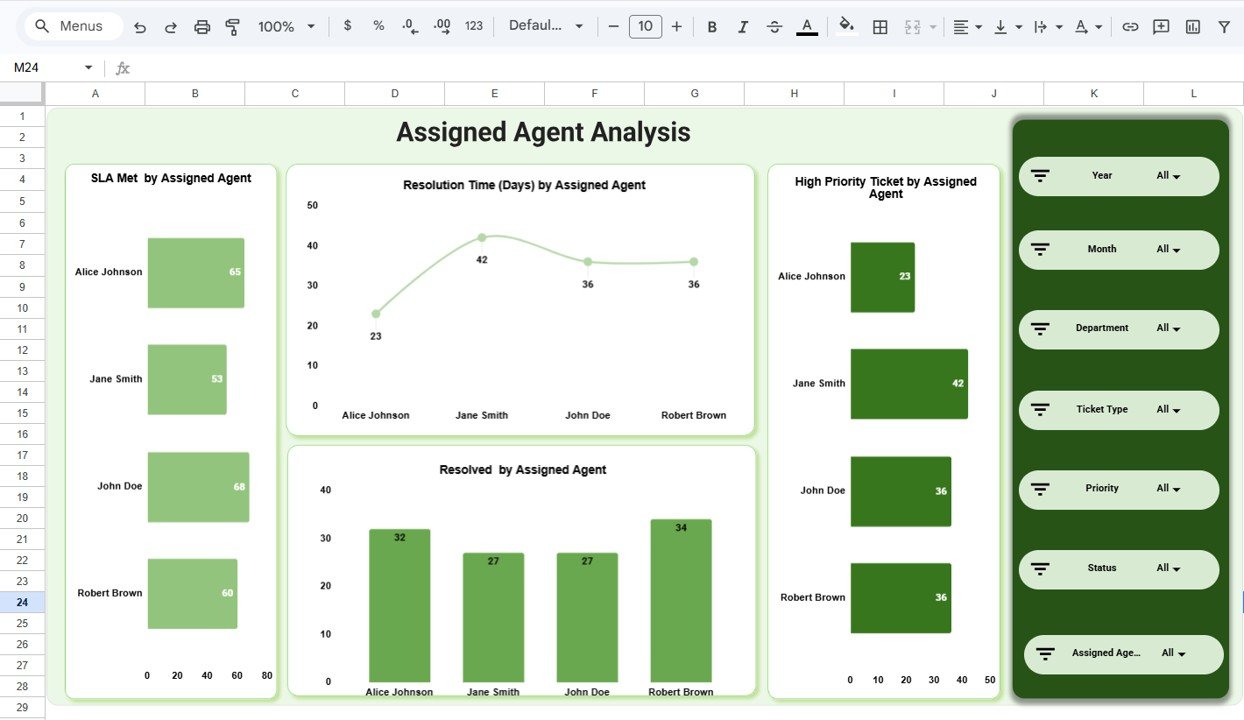
4️⃣ Assigned Agent Analysis Page
-
SLA Met by Agent
-
Resolution Time by Agent
-
High Priority Tickets by Agent
-
Resolved Tickets by Agent
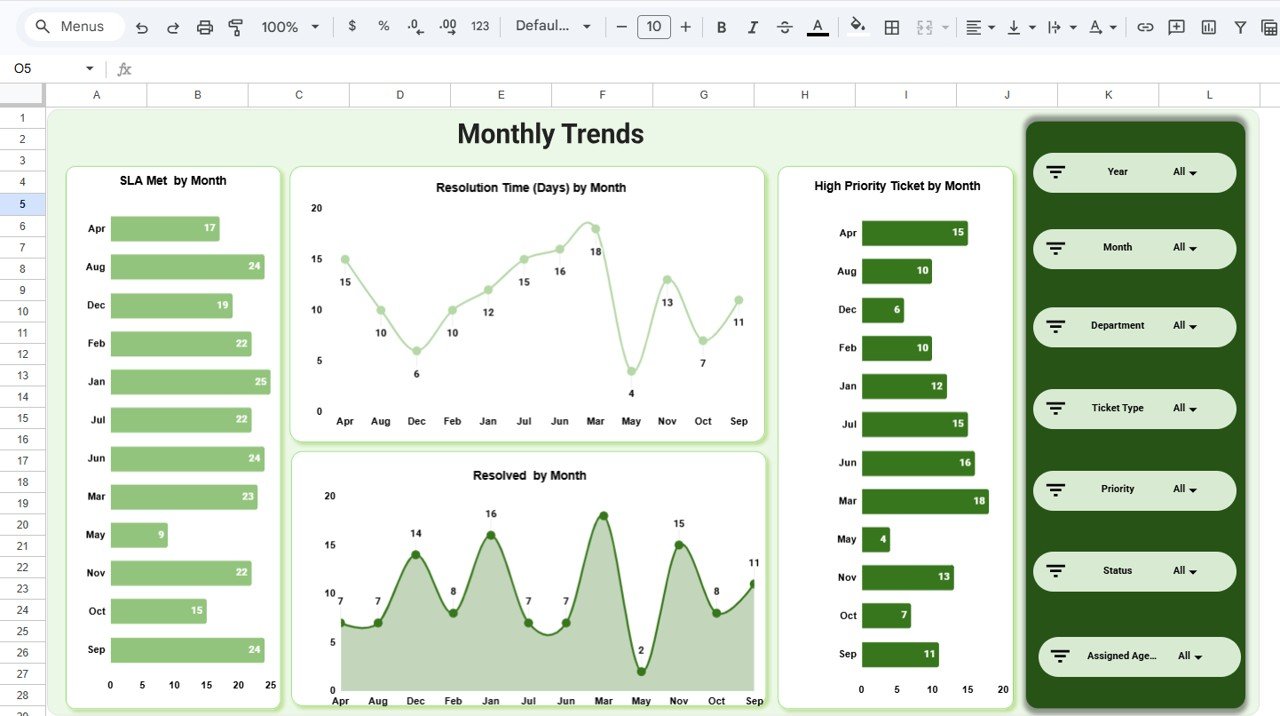
5️⃣ Monthly Trends Page
-
SLA Performance by Month
-
Resolution Time Trend
-
High Priority Ticket Trend
-
Monthly Ticket Resolution Trend
Each page provides a different perspective for complete IT performance control.
⚙️ How to Use the IT Dashboard in Google Sheets
Using the dashboard is simple:
-
Enter ticket data in the data sheet regularly.
-
Ensure SLA and priority details are updated correctly.
-
Use dropdown filters to analyze performance by department, agent, or month.
-
Review KPI summary cards for overall IT health.
-
Explore detailed pages for deeper analysis.
-
Monitor trends monthly to improve planning and resource allocation.
Within minutes, you gain structured IT performance visibility.
👥 Who Can Benefit from This IT Dashboard in Google Sheets
This dashboard is ideal for:
-
IT Managers
-
Service Desk Teams
-
Helpdesk Supervisors
-
CIOs and IT Directors
-
Managed Service Providers (MSPs)
-
Small and Large IT Departments
-
Operations Managers
Any organization managing service tickets can use this dashboard to improve performance.
By centralizing ticket metrics, SLA tracking, agent productivity, and department performance, this dashboard eliminates reporting confusion. Managers identify bottlenecks early, monitor high-priority issues efficiently, and improve service quality continuously.
Instead of reacting to problems, your IT team shifts toward proactive, data-driven management.
If you want structured IT reporting with automated analysis and dynamic filtering, this dashboard delivers exactly what your organization needs.
### Click here to read the Detailed blog post
Watch the step-by-step video tutorial:


