Managing modern city operations is no longer possible using traditional spreadsheets and manual reports. Municipal departments must monitor citizen complaints, infrastructure services, sanitation activities, operational costs, and service efficiency continuously. Without centralized analytics, city administrators struggle to identify performance gaps, control budgets, and improve citizen satisfaction.
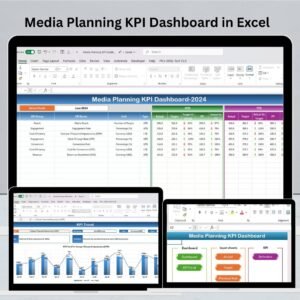
The Municipal Services Dashboard in Power BI is a powerful, ready-to-use analytics solution designed to transform complex municipal data into clear, interactive, and actionable insights. Built using Microsoft Power BI, this dashboard provides a centralized command center where decision-makers can monitor service performance, analyze operational costs, and track citizen service outcomes in real time.
Instead of reviewing multiple disconnected reports, municipal leaders can evaluate city performance from one professional dashboard interface. With dynamic filters, automated calculations, and interactive visuals, users can instantly analyze operations by department, service type, request channel, priority level, or time period.
This dashboard empowers municipalities to move from reactive management to data-driven governance, helping cities become smarter, more efficient, and more transparent.
## 🚀 Key Features of Municipal Services Dashboard in Power BI
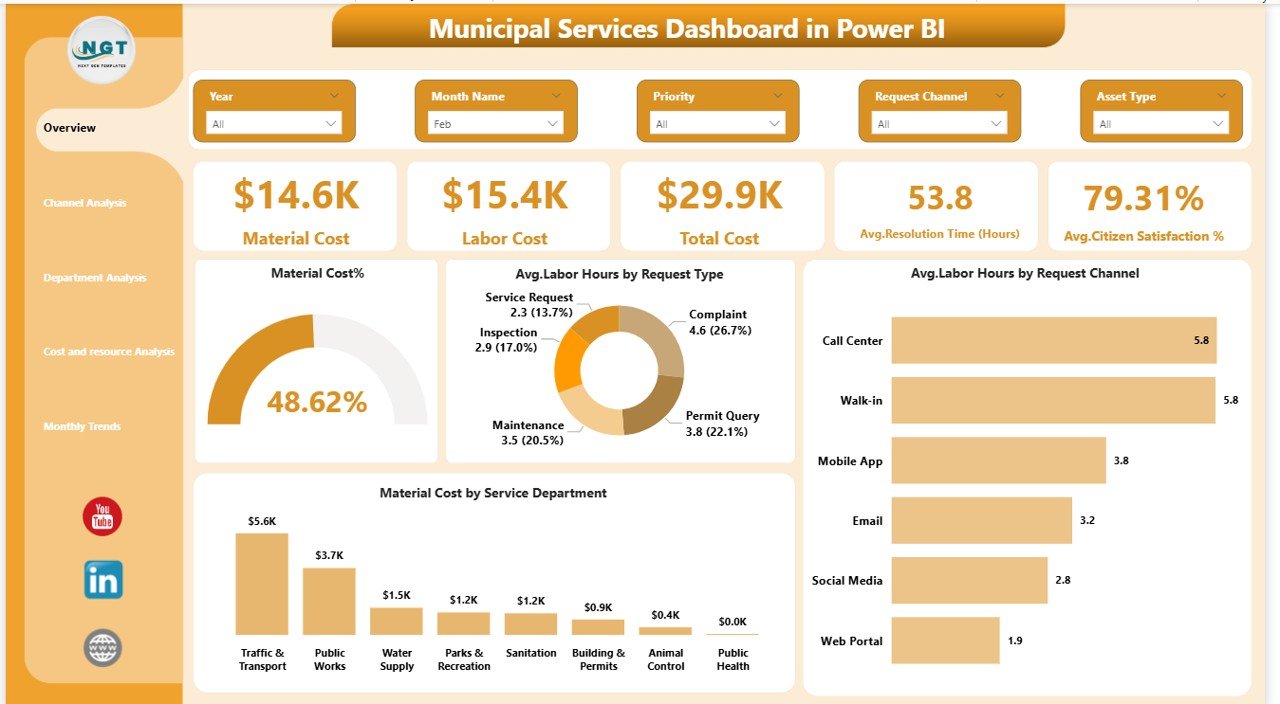
✅ Interactive KPI cards showing operational performance instantly
✅ Real-time tracking of material cost, labor cost, and total expenses
✅ Citizen satisfaction and resolution time monitoring
✅ Multi-page analytical dashboard for deep operational insights
✅ Dynamic slicers for department, service type, and time filtering
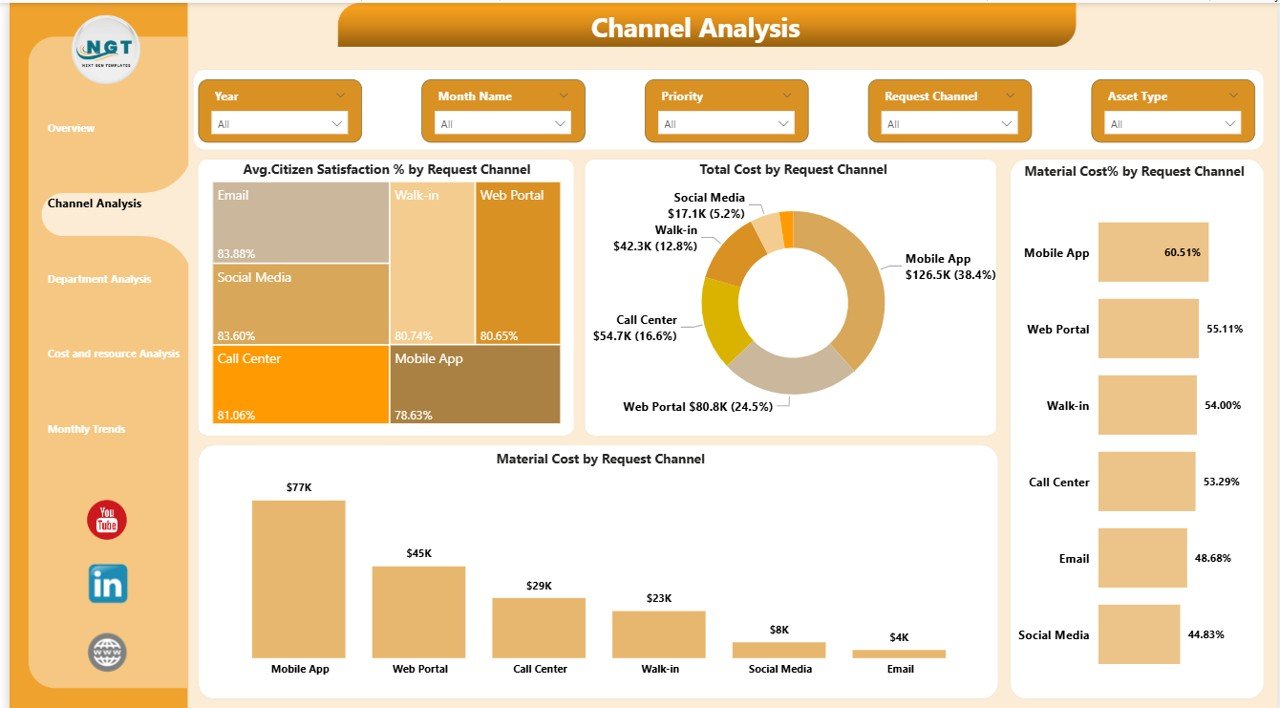
✅ Channel performance analysis for citizen request optimization
✅ Department efficiency comparison visuals
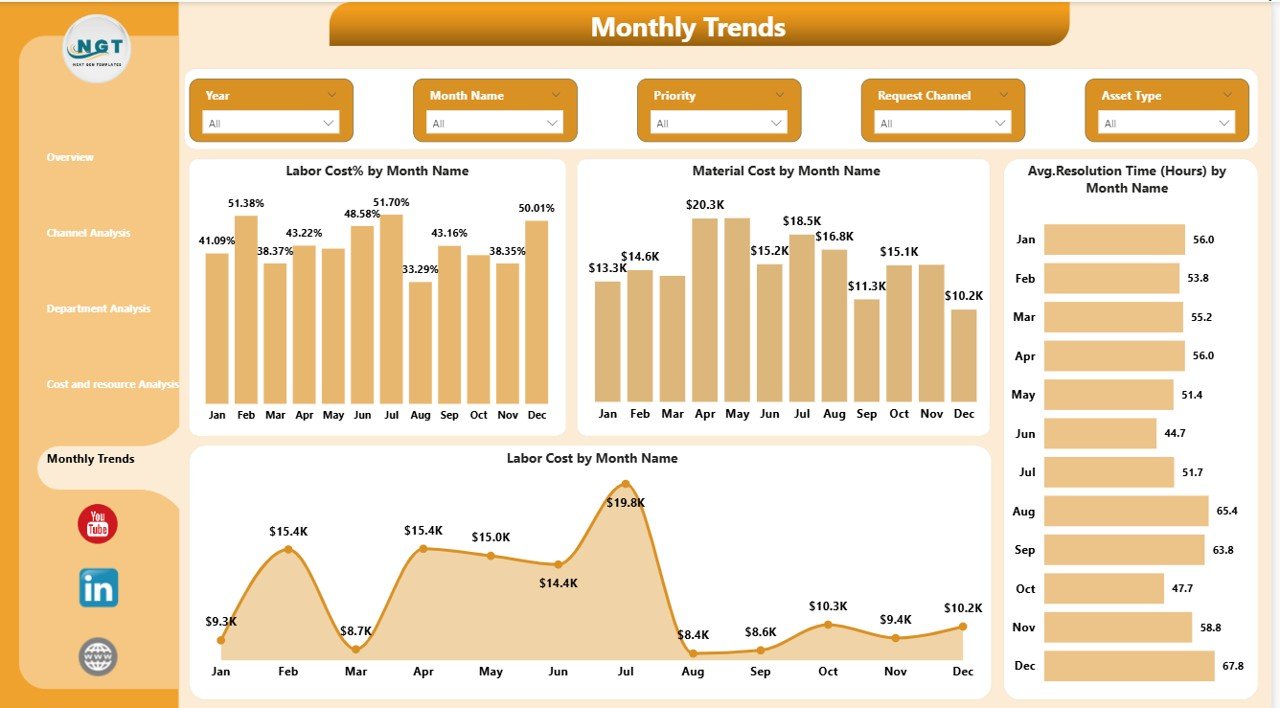
✅ Monthly trend analysis for strategic planning
✅ Automated calculations and drill-down capabilities
✅ Professional and easy-to-understand visual design
## 📊 What’s Inside the Municipal Services Dashboard in Power BI
This dashboard includes five fully interactive analytical pages:
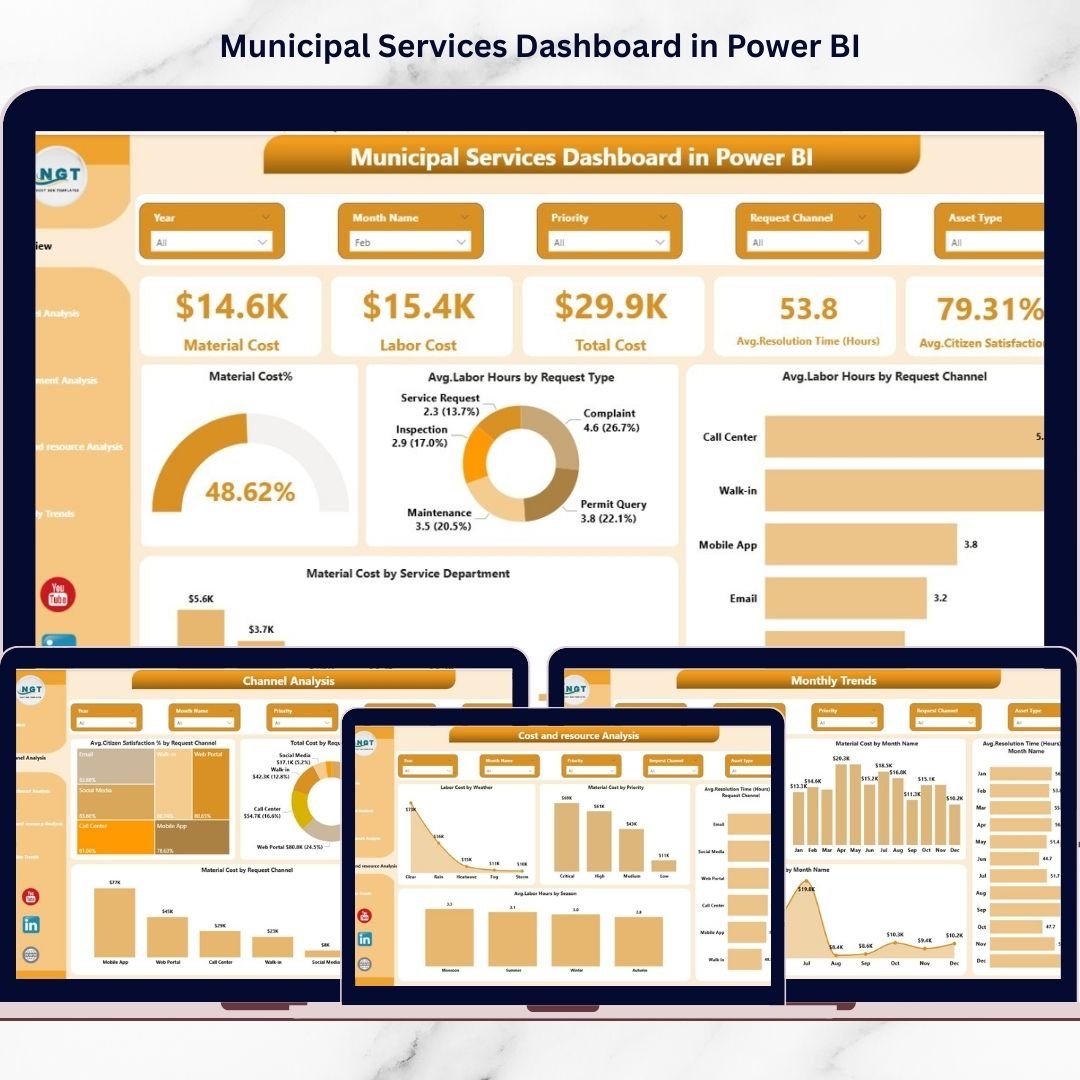
Overview Page – Central command view with KPI cards and performance visuals.
Channel Analysis – Understand how citizens interact through apps, calls, or offices.
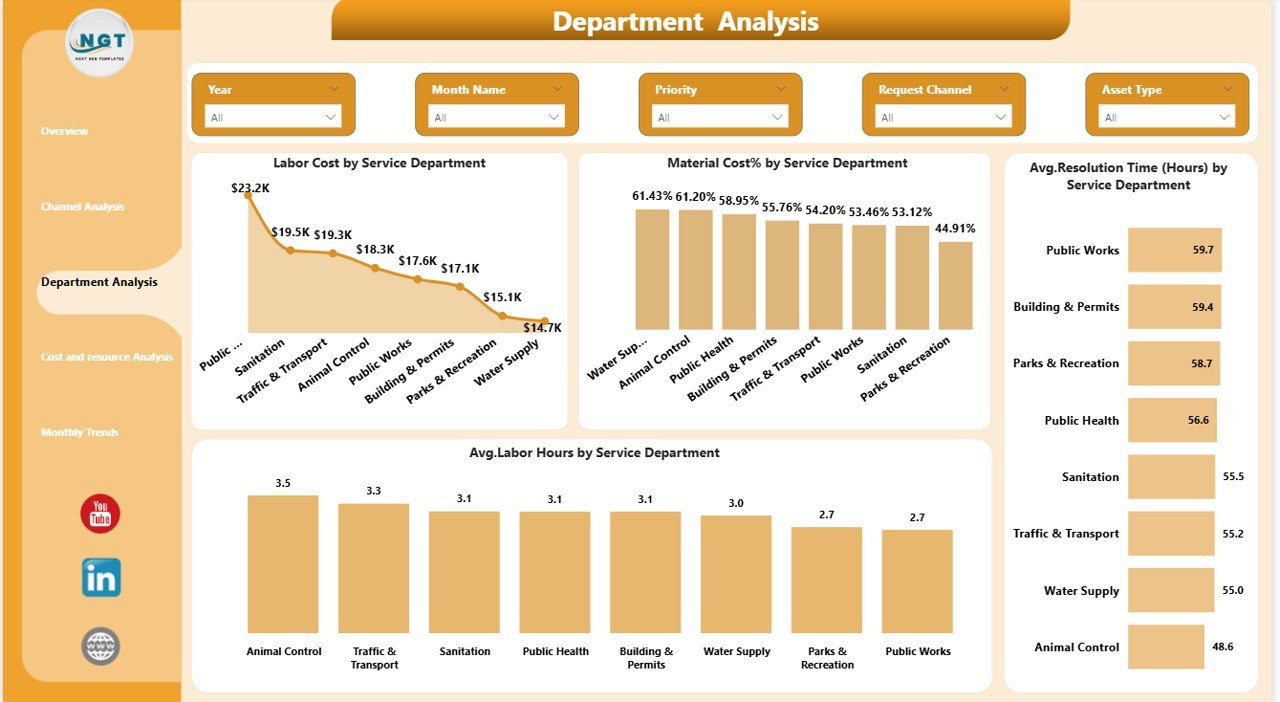
Department Analysis – Compare operational efficiency across municipal departments.
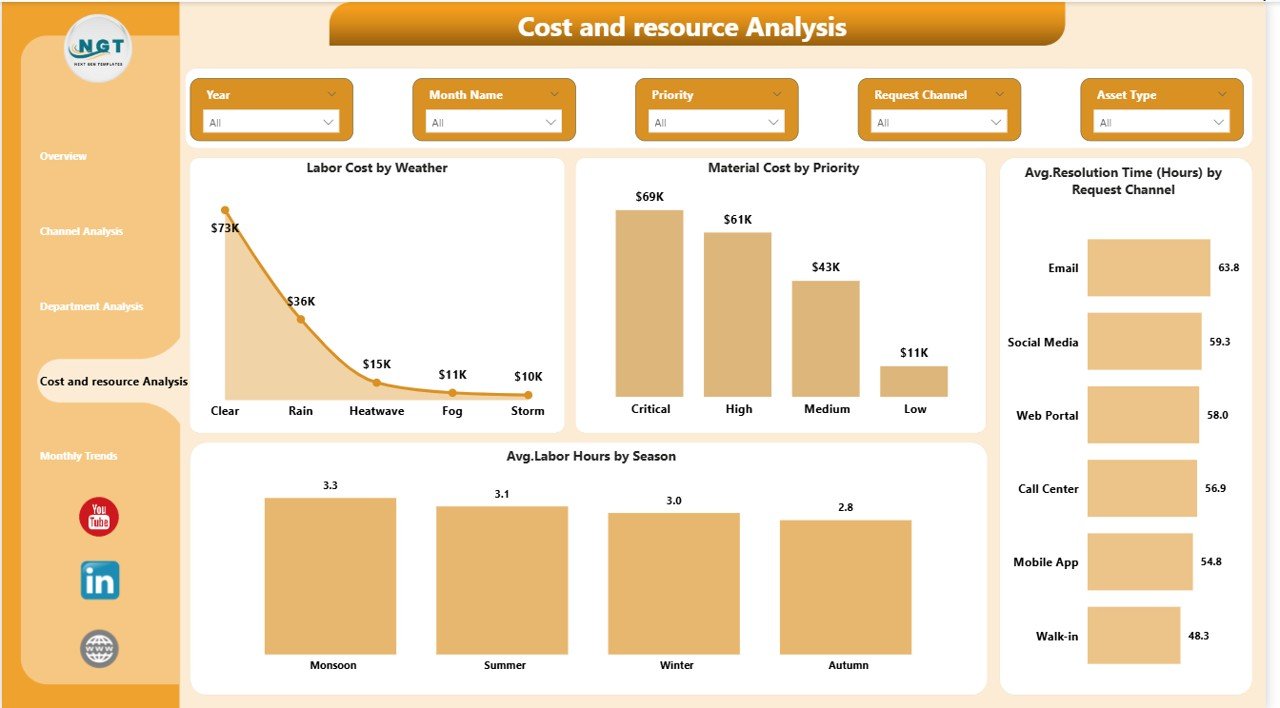
Cost & Resource Analysis – Identify cost drivers and optimize labor allocation.
Monthly Trends Page – Track long-term service performance and cost patterns.
The dashboard works with structured datasets containing service requests, costs, labor hours, resolution time, satisfaction scores, and seasonal indicators.
## ⚙️ How to Use the Municipal Services Dashboard in Power BI
Using the dashboard is simple and user-friendly:
1️⃣ Enter or update municipal service data in Excel.
2️⃣ Connect the dataset to Power BI.
3️⃣ Refresh the dashboard to update visuals automatically.
4️⃣ Use slicers to filter by department, channel, or period.
5️⃣ Analyze KPIs and trends to identify improvement areas.
6️⃣ Make faster, data-backed operational decisions.
No advanced technical expertise is required — users mainly interact using filters and visuals.
## 👥 Who Can Benefit from This Municipal Services Dashboard in Power BI
🏙️ City Administrators & Municipal Commissioners
📊 Government Data Analysts
🛠️ Public Works & Infrastructure Departments
📞 Citizen Service Management Teams
💰 Budget & Financial Planning Departments
🌐 Smart City Project Teams
📈 Policy Makers & Urban Planners
Any organization responsible for managing public services can use this dashboard to improve efficiency, transparency, and accountability.
By adopting this dashboard, municipalities gain complete visibility into operations, reduce inefficiencies, optimize resource allocation, and improve citizen experiences. Instead of waiting for monthly reports, leaders receive instant performance insights that support proactive governance.
As cities evolve toward smart governance models, analytics dashboards like this become essential decision-making tools rather than optional reporting systems.
Click here to read the Detailed blog post
Watch the step-by-step video tutorial: