The pharmaceutical industry never slows down. Pricing pressure rises. Regulations evolve. Competition intensifies. Meanwhile, companies must balance innovation, compliance, profitability, and safety — all at once.If you still rely on scattered spreadsheets and delayed reports, you are already behind.The Pharmaceuticals Dashboard in Power BI gives you complete control over sales, cost, therapy performance, regional trends, and profit margins — all in one powerful, interactive reporting system.
Instead of juggling multiple Excel files, you can monitor KPIs in seconds and make confident, data-driven decisions faster than ever.
This ready-to-use dashboard is built for pharma leaders who want clarity, speed, and profitability.
🚀 Key Feature of Pharmaceuticals Dashboard in Power BI
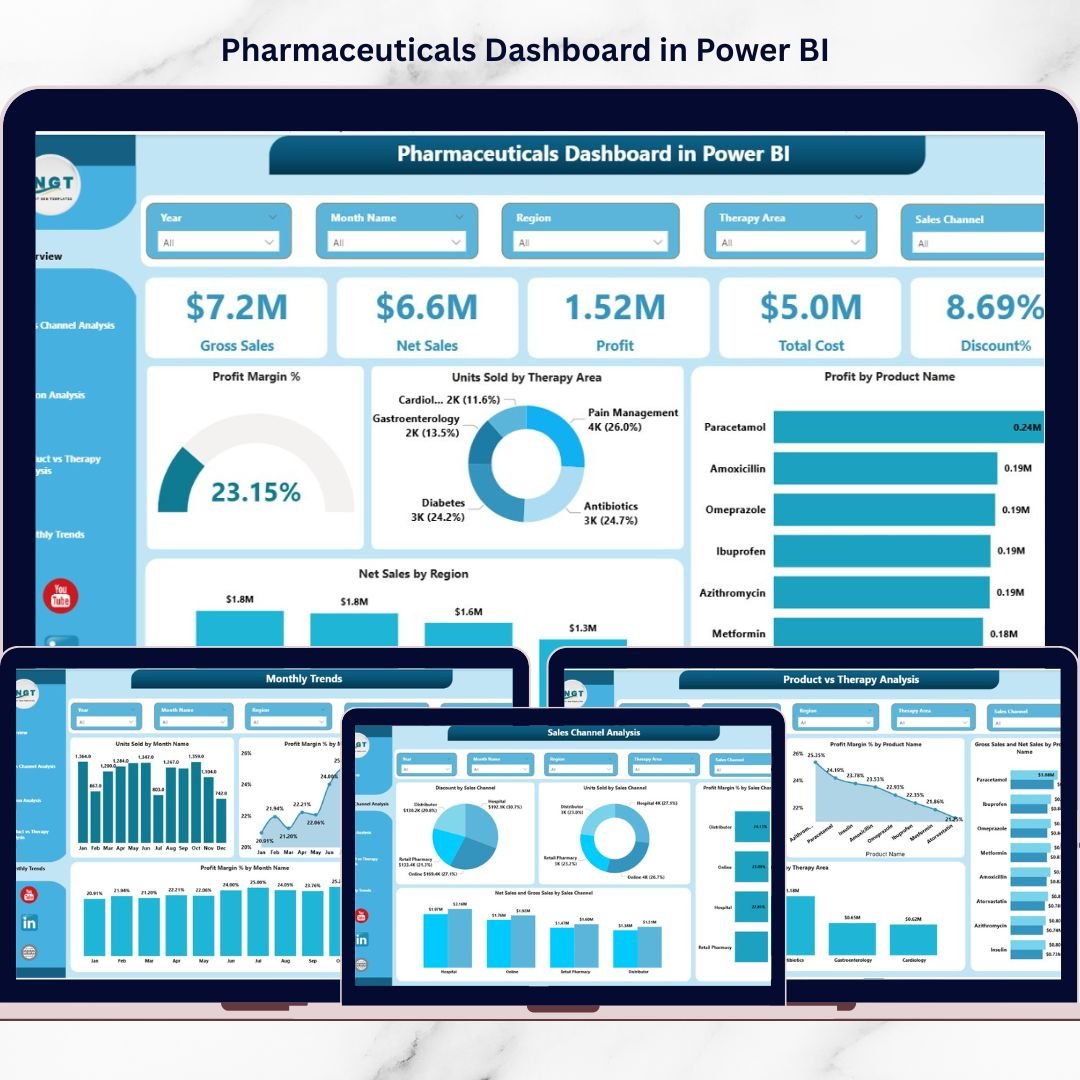
✨ 5 Interactive Dashboard Pages – Structured insights covering sales, channels, regions, therapy performance, and ESG trends.
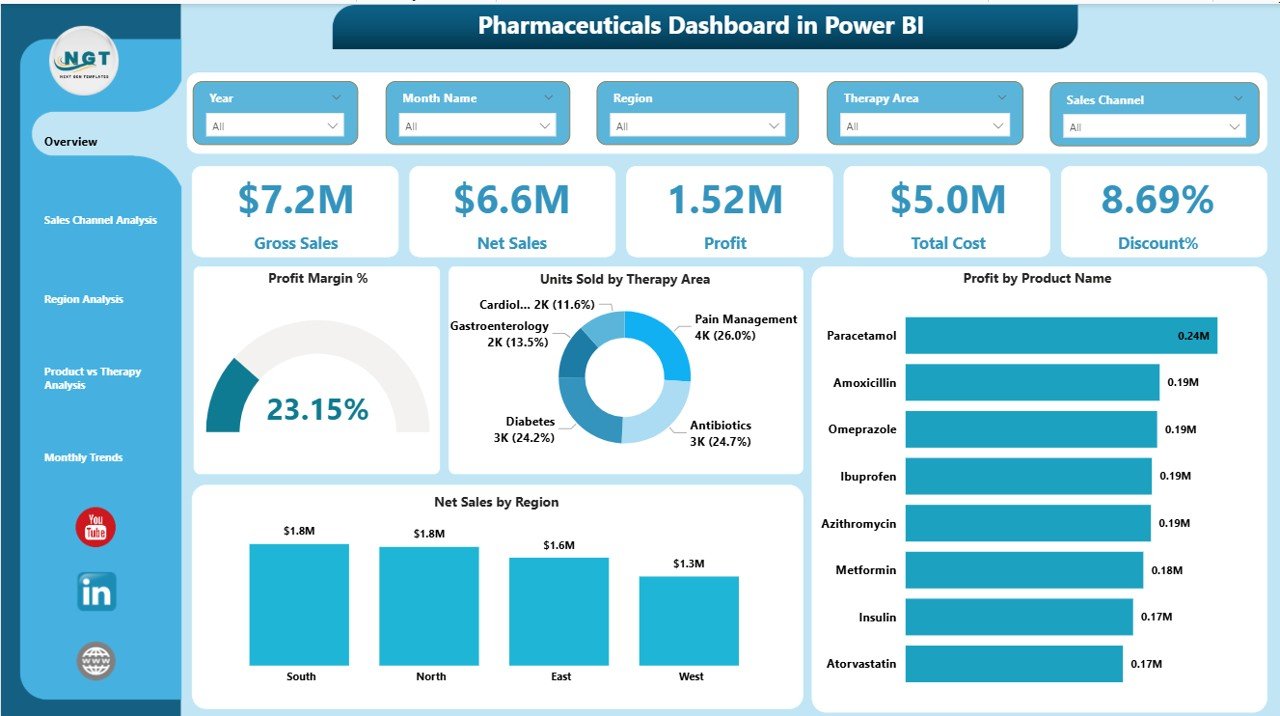
📊 Executive Overview Page – Instantly view Gross Sales, Net Sales, Profit, Total Cost, and Discount %.
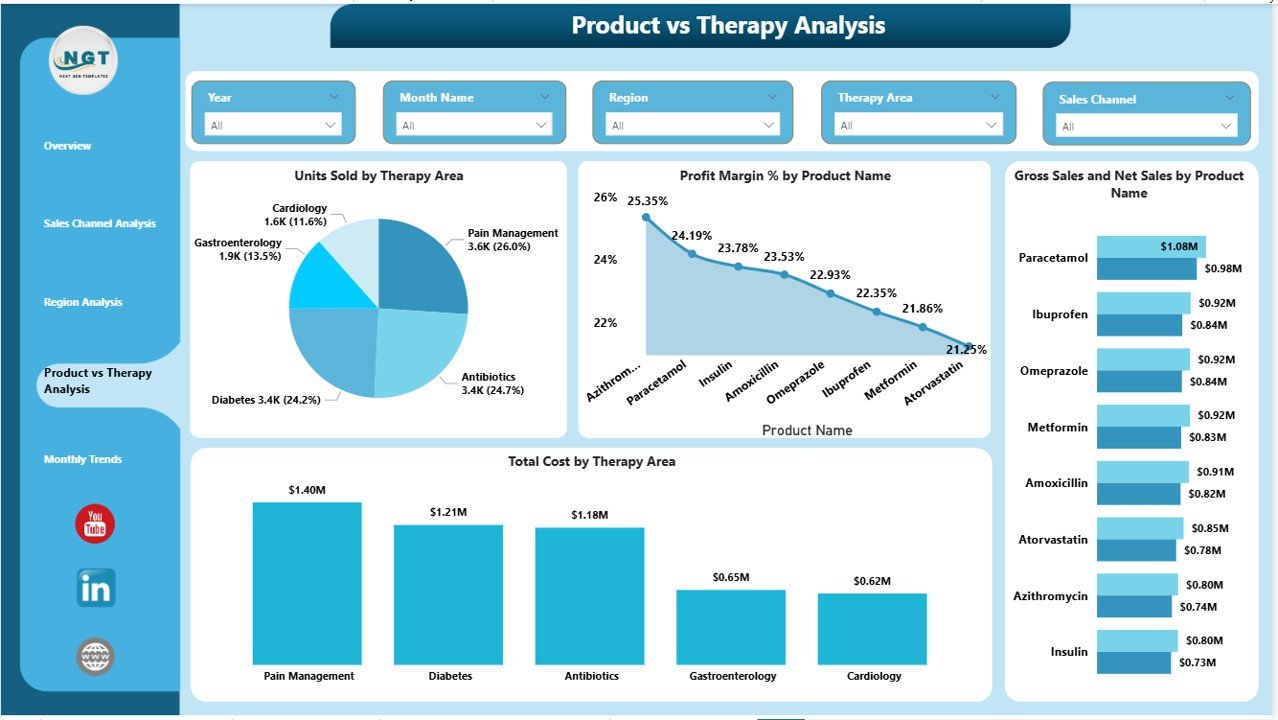
💊 Therapy & Product Analysis – Compare performance across Cardiology, Oncology, Neurology, Diabetes, Vaccines, and more.
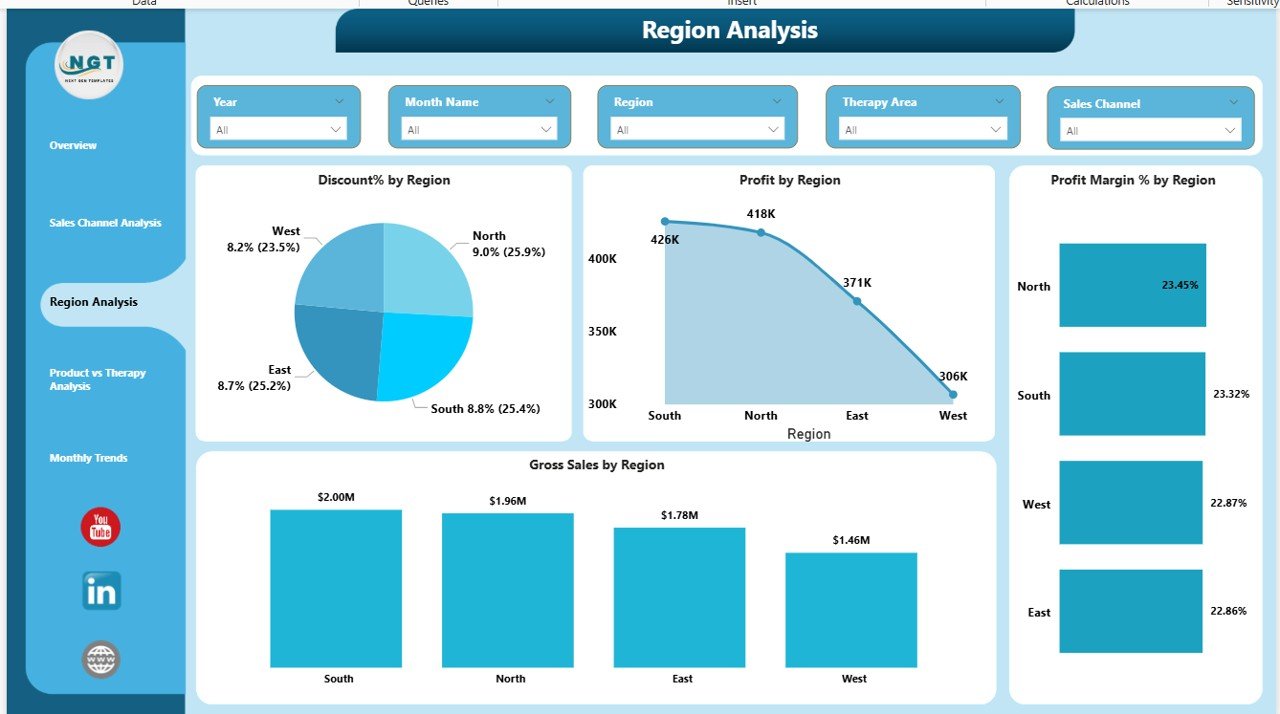
🌍 Regional Performance Insights – Track Profit Margin % and Sales by region to identify high-growth markets.
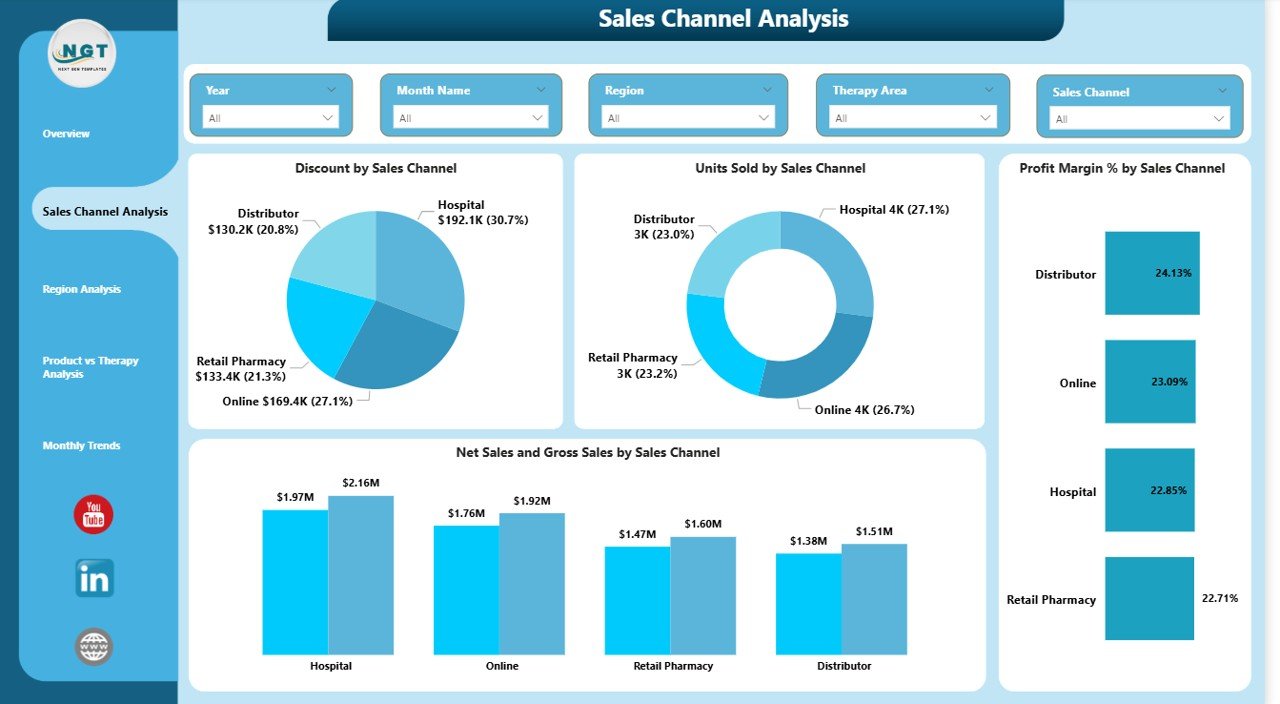
🏪 Sales Channel Optimization – Analyze hospital, retail, distributor, and online channel profitability.
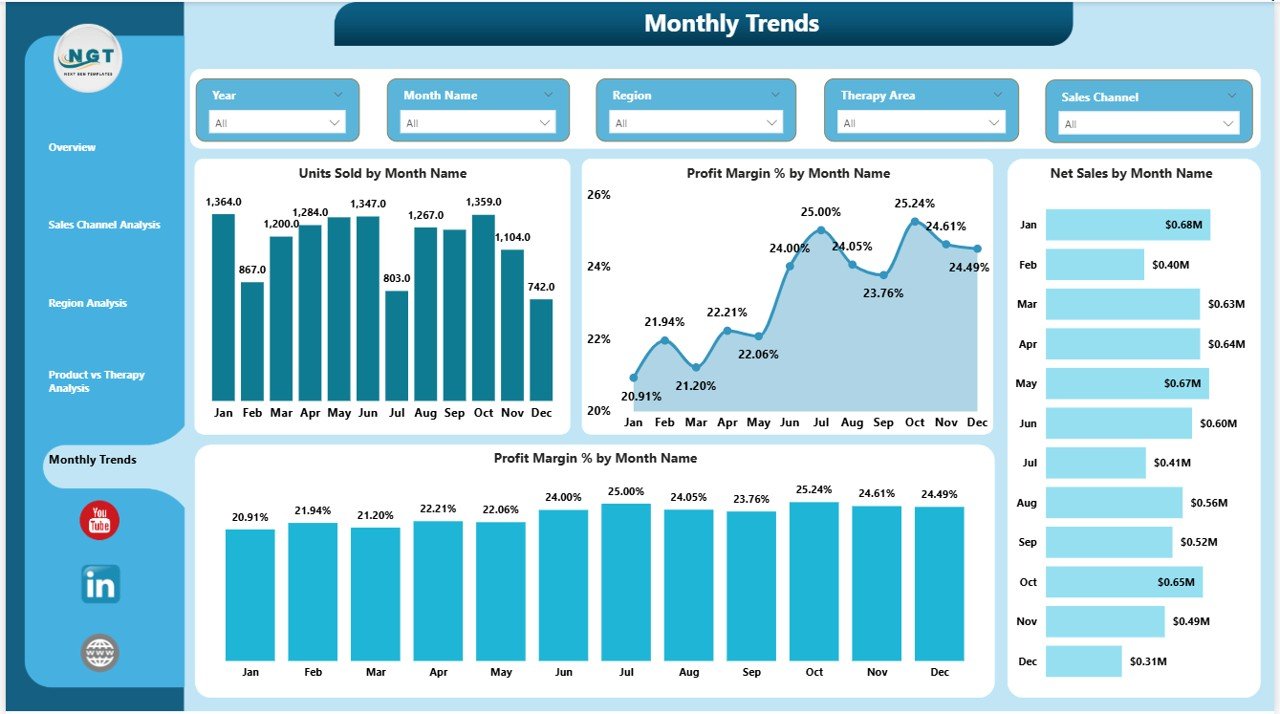
📈 Monthly Trend Tracking – Monitor seasonal demand shifts and margin fluctuations instantly.
🎯 Interactive Slicers – Filter by Month, Region, Therapy Area, or Sales Channel with one click.
💰 Profit Margin Analysis – Identify discount impact and margin leakage quickly.
🔐 ESG & Performance Transparency – Review monthly operational trends to support compliance and sustainability goals.
📦 What’s Inside the Pharmaceuticals Dashboard in Power BI
When you download this dashboard, you get:
✔ A fully designed Power BI Desktop file
✔ 5 pre-built interactive pages
✔ Professionally structured KPIs
✔ Dynamic charts and slicers
✔ Ready-to-use visuals for executive reporting
✔ Clean layout optimized for decision-making
The dashboard includes essential KPIs such as:
-
Gross Sales
-
Net Sales
-
Total Cost
-
Profit
-
Profit Margin %
-
Discount %
-
Units Sold
-
Therapy Area Performance
-
Regional Revenue
-
Channel Margin
Each KPI follows a clear structure. For example:
Profit Margin % = (Profit ÷ Net Sales) × 100
Everything is built to save time and eliminate manual calculations.
🛠 How to Use the Pharmaceuticals Dashboard in Power BI
Using this dashboard is simple and powerful.
1️⃣ Import your structured sales and cost data.
2️⃣ Refresh the data model.
3️⃣ Use slicers to filter by Month, Region, or Therapy Area.
4️⃣ Review channel performance and discount trends.
5️⃣ Identify profit gaps and growth opportunities.
Instead of exporting 10 separate reports, you can analyze performance in under 2 minutes.
The interactive visuals make trend tracking effortless. Whether you want to compare Oncology vs Diabetes margins or Retail vs Hospital sales, the dashboard delivers instant clarity.
👥 Who Can Benefit from This Pharmaceuticals Dashboard in Power BI
This dashboard is designed for:
👨💼 Executives & CFOs – Monitor overall financial health and profitability.
📊 Finance Teams – Analyze Gross vs Net Sales and track margin performance.
🏥 Sales Managers – Optimize channels and reduce excessive discounting.
🌍 Regional Managers – Evaluate territory performance and growth potential.
🔬 Strategy & R&D Teams – Identify high-margin therapy segments.
If your organization manages multiple SKUs, therapy areas, and regions, this dashboard becomes an essential control panel.
This Pharmaceuticals Dashboard in Power BI is not just a reporting tool — it is a performance accelerator.
It centralizes your data, improves decision-making speed, highlights margin leakage, and strengthens strategic planning.
If you want full visibility, stronger profitability control, and faster executive reporting, this dashboard is your competitive advantage.
Click here to read the Detailed blog post
Watch the step-by-step video tutorial:


