
Are you still preparing manual reports for advocacy campaigns and donor meetings? Stop wasting hours on scattered spreadsheets. It’s time to bring clarity, accountability, and measurable impact into one powerful system.
The Civil Rights Organizations KPI Dashboard in Power BI is a ready-to-use, fully interactive performance management solution designed specifically for advocacy groups, nonprofit organizations, and human rights foundations.
Instead of juggling disconnected Excel sheets, you get one centralized dashboard that tracks advocacy performance, legal case progress, outreach impact, donor metrics, and operational efficiency — all in real time.
This dashboard connects seamlessly with an Excel data source. You only update the numbers. Power BI handles the calculations, comparisons, and visuals automatically. With just one click, you can view MTD, YTD, Target vs Actual, and Year-over-Year comparisons instantly.
If your organization wants stronger reporting, improved transparency, and data-driven leadership decisions — this dashboard is your competitive advantage.
🚀 Key Features of Civil Rights Organizations KPI Dashboard in Power BI
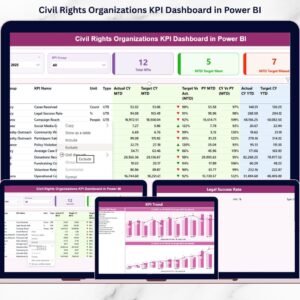
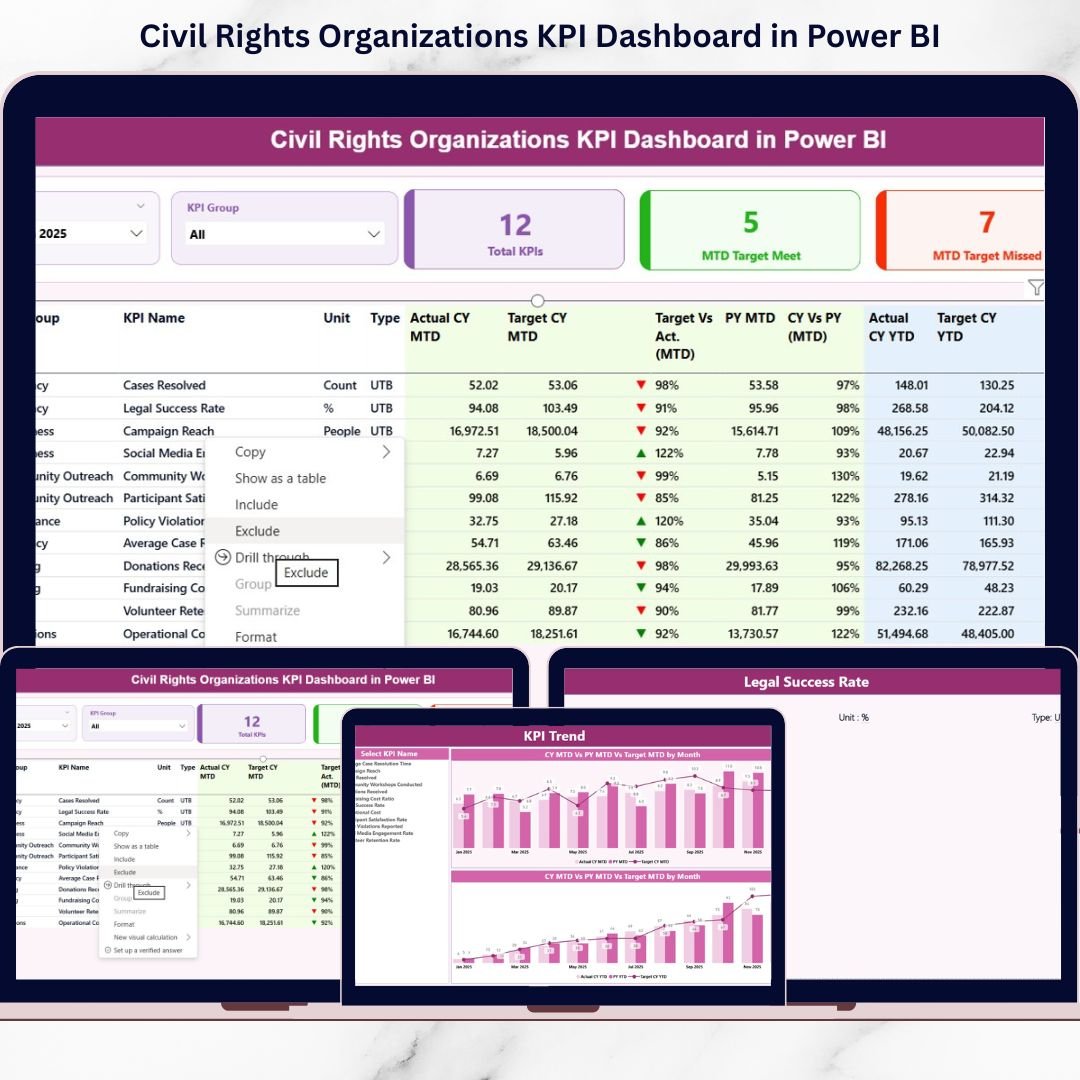
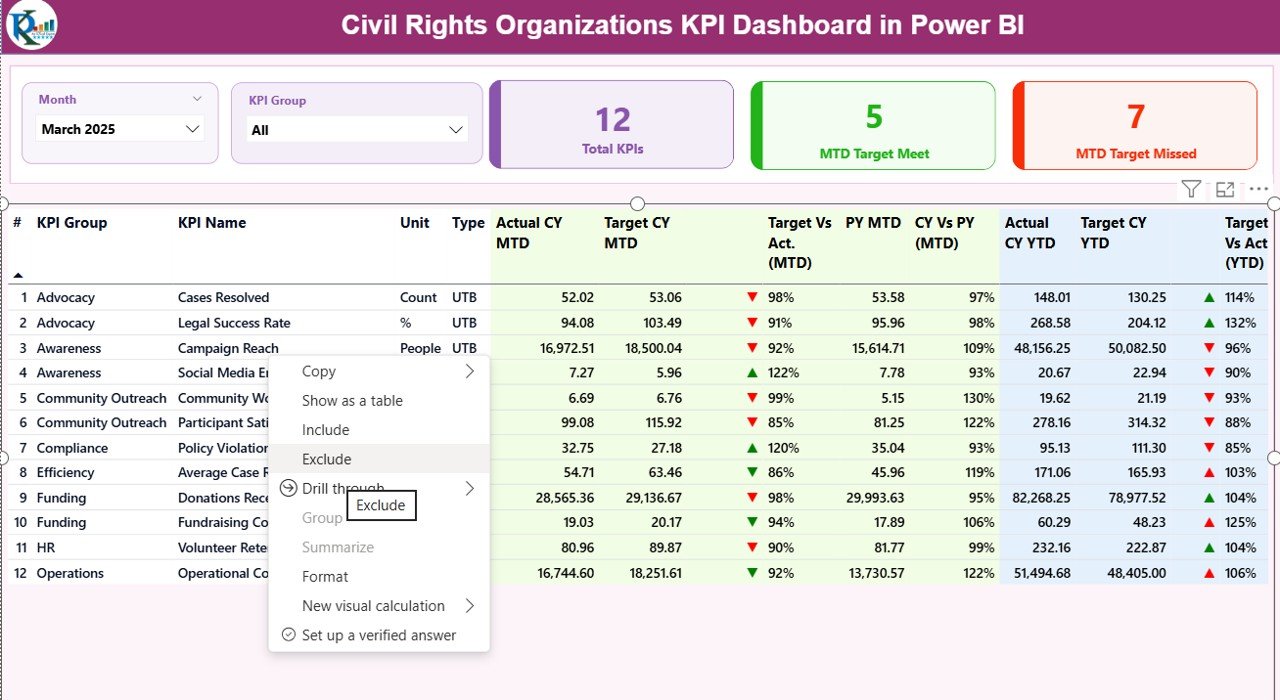
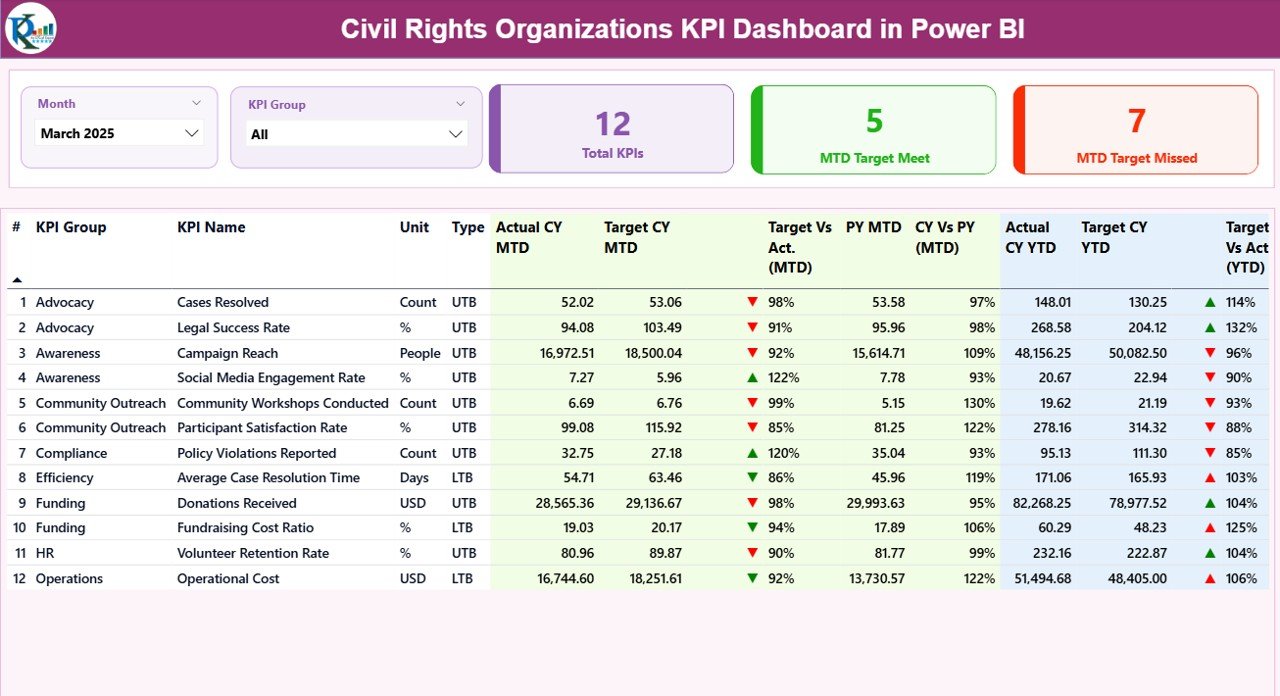
✔️ Interactive Summary Page – Instantly monitor total KPIs, targets achieved, targets missed, and performance ratios.
✔️ MTD & YTD Performance Tracking – Compare Month-to-Date and Year-to-Date values with dynamic visual indicators.
✔️ Target vs Actual Analysis – Automatically calculate achievement percentages with clear green ▲ and red ▼ icons.
✔️ Year-over-Year Comparison – Track Current Year vs Previous Year for both MTD and YTD performance.
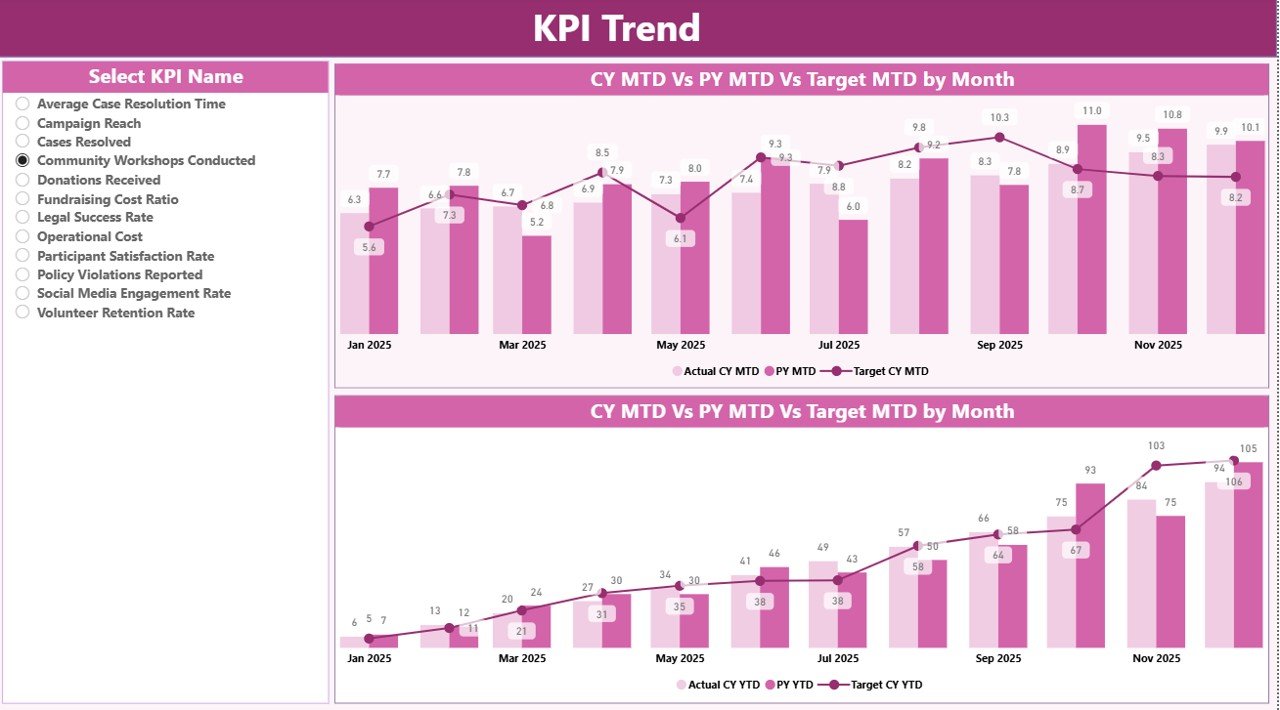
✔️ KPI Trend Analysis Page – Analyze performance growth using combo charts for deeper strategic planning.
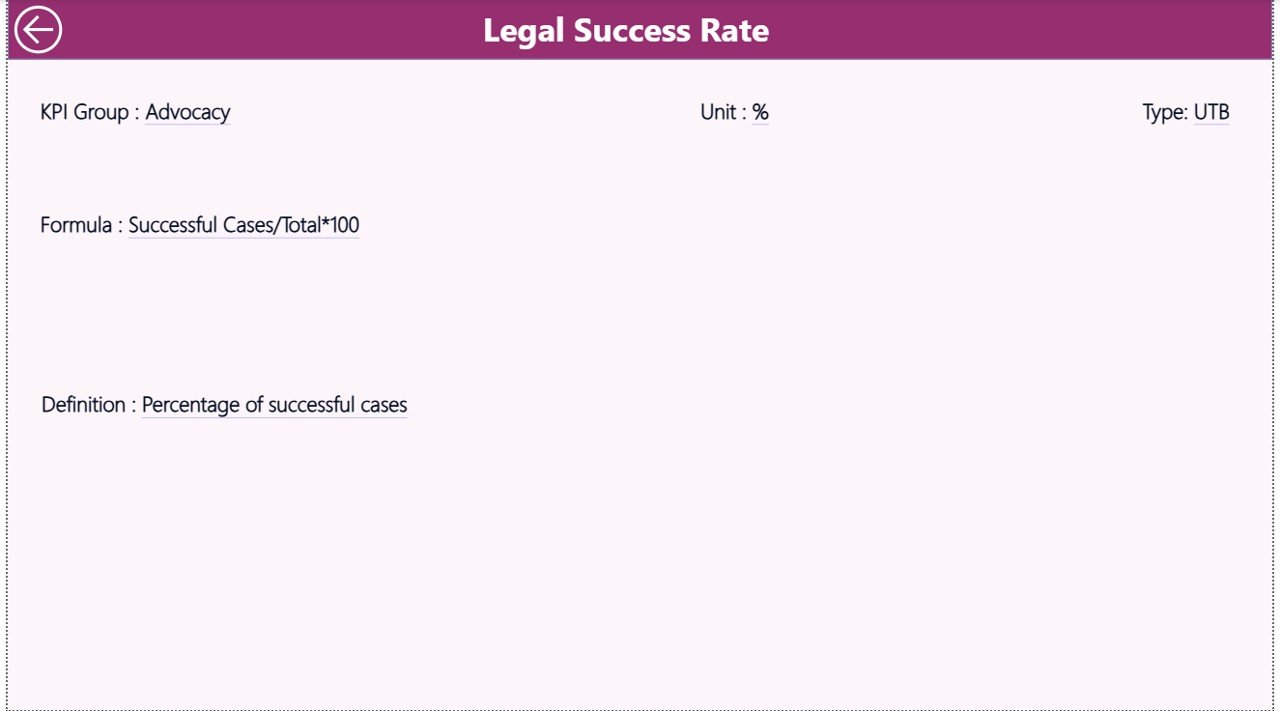
✔️ Drill-Through KPI Definition Page – Right-click any KPI to view formula, definition, unit, and type (LTB/UTB).
✔️ Excel-Based Data Entry – Update data easily in Excel without needing advanced Power BI skills.
✔️ Unlimited KPI Customization – Add new KPIs, groups, and categories based on your organization’s needs.
✔️ Professional Donor Reporting – Export clean reports for board meetings and funding presentations.
📊 What’s Inside the Civil Rights Organizations KPI Dashboard in Power BI
When you purchase this product, you receive:
📌 Power BI Desktop File (.pbix)
Includes 3 interactive pages:
Summary Dashboard
KPI Trend Analysis
KPI Definition Drill-Through Page
📌 Excel Data Source File
Contains 3 structured worksheets:
Input_Actual (MTD & YTD performance data)
Input_Target (Target values)
KPI Definition (Formula, Unit, Type, Grouping)
📌 Pre-built KPI Structure
Organized across categories such as:
Advocacy & Campaign KPIs
Legal & Case KPIs
Community Outreach KPIs
Financial & Donor KPIs
Operational KPIs
Everything is professionally structured and business-ready.
🛠️ How to Use the Civil Rights Organizations KPI Dashboard in Power BI
Using this dashboard is simple and practical:
1️⃣ Open the Excel file and enter monthly Actual and Target data.
2️⃣ Update KPI definitions or add new KPIs if needed.
3️⃣ Open the Power BI file and click Refresh.
4️⃣ Use Month and KPI Group slicers to filter results.
5️⃣ Analyze MTD, YTD, and Year-over-Year performance instantly.
6️⃣ Drill through to KPI Definition for deeper clarity.
You do not need advanced Power BI skills. The structure is pre-built. You only maintain the data.
🎯 Who Can Benefit from This Civil Rights Organizations KPI Dashboard in Power BI?
This dashboard is ideal for:
✔️ Civil Rights Organizations
✔️ Advocacy Groups
✔️ Nonprofit Foundations
✔️ Human Rights NGOs
✔️ Community Justice Programs
✔️ Policy Reform Initiatives
✔️ Donor-Funded Projects
✔️ Grant Management Teams
✔️ Board & Leadership Committees
Whether you manage a small nonprofit or a large advocacy network, this dashboard helps you measure impact professionally.
This solution improves transparency, strengthens governance, saves reporting time, and enhances donor confidence. Instead of reacting to problems, leadership can proactively monitor performance and adjust strategy.
If you want to move from passion-driven work to performance-driven impact, this Power BI dashboard is your essential tool.
Click here to read the Detailed blog post
Watch the step-by-step video tutorial:
Visit our YouTube channel to learn step-by-step video tutorials
Compatibility and Requirements
- Works in Power BI Desktop, which is free. Power BI Desktop is available for Windows.
- The data lives in an Excel file with three worksheets: Input_Actual, Input_Target and KPI Definition. Microsoft explains how to get the app in Get Power BI Desktop.
Frequently Asked Questions
What pages does the Power BI file have?
Three pages: Summary Dashboard, KPI Trend Analysis and a KPI Definition drill-through page.
Where do I enter my data?
In the Excel data source file. Enter actual MTD and YTD values in Input_Actual and your goals in Input_Target, then click Refresh in Power BI.
Can I add my own KPIs?
Yes. Add new KPIs, groups and categories in the KPI Definition sheet and the data sheets, then refresh the report.
Can I compare this year with last year?
Yes. The dashboard shows Current Year against Previous Year for both MTD and YTD, plus Target vs Actual with green and red indicators.
How do I see how a KPI is defined?
Right-click any KPI and drill through to the KPI Definition page. It shows the formula, definition, unit and type (LTB or UTB).
Is there an Excel version?
Yes. See the Civil Rights Organizations KPI Dashboard in Excel.
Related Civil Rights and Nonprofit Templates
- Civil Rights Organizations KPI Dashboard in Excel: the same KPIs in Excel
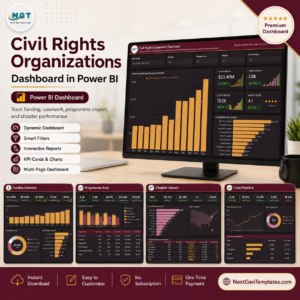
- Civil Rights Organizations Dashboard in Power BI: a wider dashboard for the same sector
- Civil Rights Organizations Dashboard in Excel: the dashboard edition in Excel
- Nonprofit Organizations KPI Dashboard in Power BI: a general nonprofit KPI view
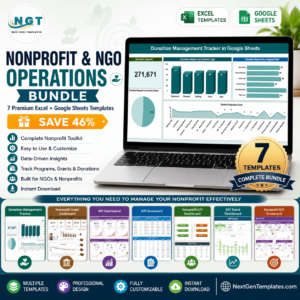
- Nonprofit & NGO Operations Bundle: several nonprofit templates in one download
Browse all Power BI KPI dashboards.