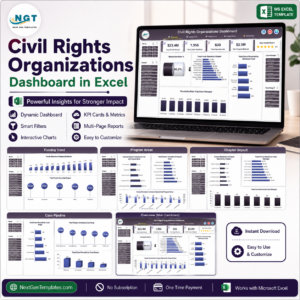
Civil rights organizations work tirelessly to defend justice, equality, and human dignity. But passion alone does not prove impact. Data proves impact. Measurement builds clarity. Accountability builds trust.
That is why you need the Civil Rights Organizations KPI Dashboard in Excel — a powerful, ready-to-use performance tracking system designed specifically for advocacy groups, nonprofits, human rights foundations, and justice initiatives.
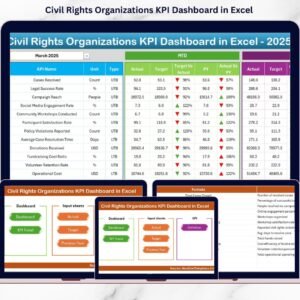
Instead of juggling scattered spreadsheets, manual reports, and last-minute board presentations, this structured Excel dashboard centralizes all your key metrics in one intelligent system. With automatic calculations, performance arrows, trend charts, and target comparisons, you gain instant visibility into what truly matters.
Whether you are tracking legal cases, outreach programs, policy wins, or donor growth, this dashboard transforms raw numbers into strategic insights.
🔷 Key Features of Civil Rights Organizations KPI Dashboard in Excel
📌 7 Structured Worksheets – Summary, Dashboard, Trend Analysis, Actual Input, Target, Previous Year, and KPI Definition sheets for complete performance management.
📌 Dynamic Month Selection (Cell D3) – Select any month from the drop-down, and the dashboard updates automatically.
📌 MTD & YTD Tracking – Monitor Month-To-Date and Year-To-Date performance side by side.
📌 Previous Year Comparison – Instantly compare current performance with last year’s numbers.
📌 Conditional Formatting Arrows – Upward and downward arrows show performance trends at a glance.
📌 Centralized Data Entry – Clean input sheets reduce errors and improve reporting accuracy.
📌 Custom KPI Definitions – Fully editable KPI list to match your organization’s mission.
Because the dashboard is built in Excel, it works offline and online, making it accessible to organizations of all sizes.

🔷 What’s Inside the Civil Rights Organizations KPI Dashboard in Excel
When you download this template, you get a complete performance management system:
✔ A Summary Page with 6 navigation buttons for easy movement between sheets.
✔ A fully automated Dashboard Sheet displaying Actual, Target, and Previous Year comparisons.
✔ A Trend Analysis Sheet with MTD and YTD charts for board meetings.
✔ An Actual Numbers Input Sheet for centralized monthly data entry.
✔ A Target Sheet to store planned performance goals.
✔ A Previous Year Sheet to measure year-over-year growth.
✔ A structured KPI Definition Sheet to define formulas, units, and KPI groups.
Every sheet is logically organized to save time and eliminate confusion.
🔷 How to Use the Civil Rights Organizations KPI Dashboard in Excel
Getting started is simple:
1️⃣ Define your KPIs clearly in the KPI Definition sheet.
2️⃣ Enter previous year performance numbers.
3️⃣ Input monthly target values.
4️⃣ Enter actual MTD and YTD values.
5️⃣ Select the month from cell D3 in the dashboard.
6️⃣ Review automated comparisons and trend charts.
That’s it.
No complex formulas. No advanced Excel skills required. The dashboard handles calculations automatically so you can focus on insights, not spreadsheets.
🔷 Who Can Benefit from This Civil Rights Organizations KPI Dashboard?
This dashboard is ideal for:
✅ Civil rights advocacy groups
✅ Nonprofit organizations
✅ Human rights foundations
✅ Community justice programs
✅ Legal aid organizations
✅ Social justice initiatives
✅ Grant-funded NGOs
✅ Board members and leadership teams
Whether you are a small grassroots organization or a large foundation, structured KPI tracking improves transparency, strengthens donor communication, and enhances strategic planning.
Why This Dashboard Changes Everything
Without structured KPI tracking, organizations rely on assumptions. Reports take hours to prepare. Donors question accountability. Leadership reacts instead of planning ahead.
With this dashboard:
✔ You monitor progress monthly
✔ You compare target vs actual performance
✔ You track year-over-year growth
✔ You identify gaps early
✔ You present clean, visual reports to boards
Most importantly, you protect your mission with measurable impact.
When donors see clear case resolution rates, outreach growth, and funding efficiency metrics, trust increases. When boards see performance arrows and trend charts, meetings become productive. When teams see defined targets, accountability improves.
This is not just an Excel file. It is a mission management system.
If your organization wants to improve transparency, strengthen reporting, and make data-driven decisions, this dashboard provides the structured foundation you need.
Click here to read the Detailed blog post
Watch the step-by-step video tutorial:
Visit our YouTube channel to learn step-by-step video tutorials:
👉 https://www.youtube.com/@PKAnExcelExpert
Compatibility and Requirements
- Works in Microsoft Excel desktop (Excel 2016 or later, or Microsoft 365).
- You pick the month from a dropdown in cell D3 of the Dashboard sheet. Microsoft explains dropdowns in Create a drop-down list.
Frequently Asked Questions
Which worksheets are included?
Seven worksheets: Summary, Dashboard, Trend Analysis, Actual Input, Target, Previous Year and KPI Definition. The Summary sheet has 6 navigation buttons to move between them.
How do I change the month shown on the dashboard?
Select the month from the dropdown in cell D3. The Dashboard sheet updates automatically.
Can I compare this year with last year?
Yes. Enter last year’s figures in the Previous Year sheet. The Dashboard shows them next to your actual and target numbers, with arrows that show whether performance went up or down.
Can I change the KPIs?
Yes. The KPI Definition sheet is fully editable, so you can set your own KPI names, groups, units and formulas to match your organization’s mission.
Is there a Power BI version?
Yes. See the Civil Rights Organizations KPI Dashboard in Power BI.
Related Civil Rights and Nonprofit Templates
- Civil Rights Organizations KPI Dashboard in Power BI: the same KPIs as a Power BI report
- Civil Rights Organizations Dashboard in Excel: a broader dashboard for civil rights groups
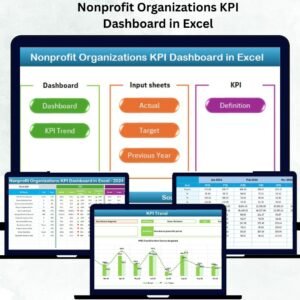
- Nonprofit Organizations KPI Dashboard in Excel: KPI tracking for general nonprofits
- Nonprofit Organizations Dashboard in Google Sheets: a nonprofit dashboard for Google Sheets users
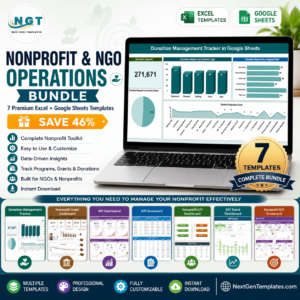
- Nonprofit & NGO Operations Bundle: 7 Excel and Google Sheets templates for nonprofits in one download
Browse all Excel KPI dashboards.