Employee leave directly impacts productivity, workforce availability, and operational costs. Yet many organizations still track leave using manual registers or disconnected spreadsheets. This makes it difficult to identify unplanned leaves, control costs, or plan resources effectively.
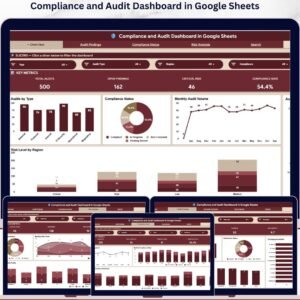
The Leave Performance Analytics Dashboard in Google Sheets is a ready-to-use, cloud-based analytics solution designed to help HR teams and managers monitor, analyze, and optimize employee leave data in real time. Instead of spending hours compiling reports, you instantly gain clear insights into leave trends, costs, durations, and employee behavior — all from one interactive dashboard.
Built entirely in Google Sheets, this dashboard combines simplicity, collaboration, and powerful analytics, making leave management smarter and faster.
🚀 Key Features of Leave Performance Analytics Dashboard in Google Sheets
✅ Interactive KPI Cards to track total leaves, unplanned leaves, leave cost, balances, and average duration
✅ Dynamic Slicers to filter by month, department, leave type, approval status, and reason
✅ Leave Type Analysis to understand which leave categories impact operations most
✅ Department-Wise Insights to compare leave behavior across teams
✅ Reason-Based Analysis to uncover root causes behind employee absences
✅ Monthly Trend Tracking to detect seasonal and recurring leave patterns
✅ Cloud-Based & Collaborative access with real-time updates
✅ Ready-to-Use Design with zero technical complexity
📂 What’s Inside the Leave Performance Analytics Dashboard
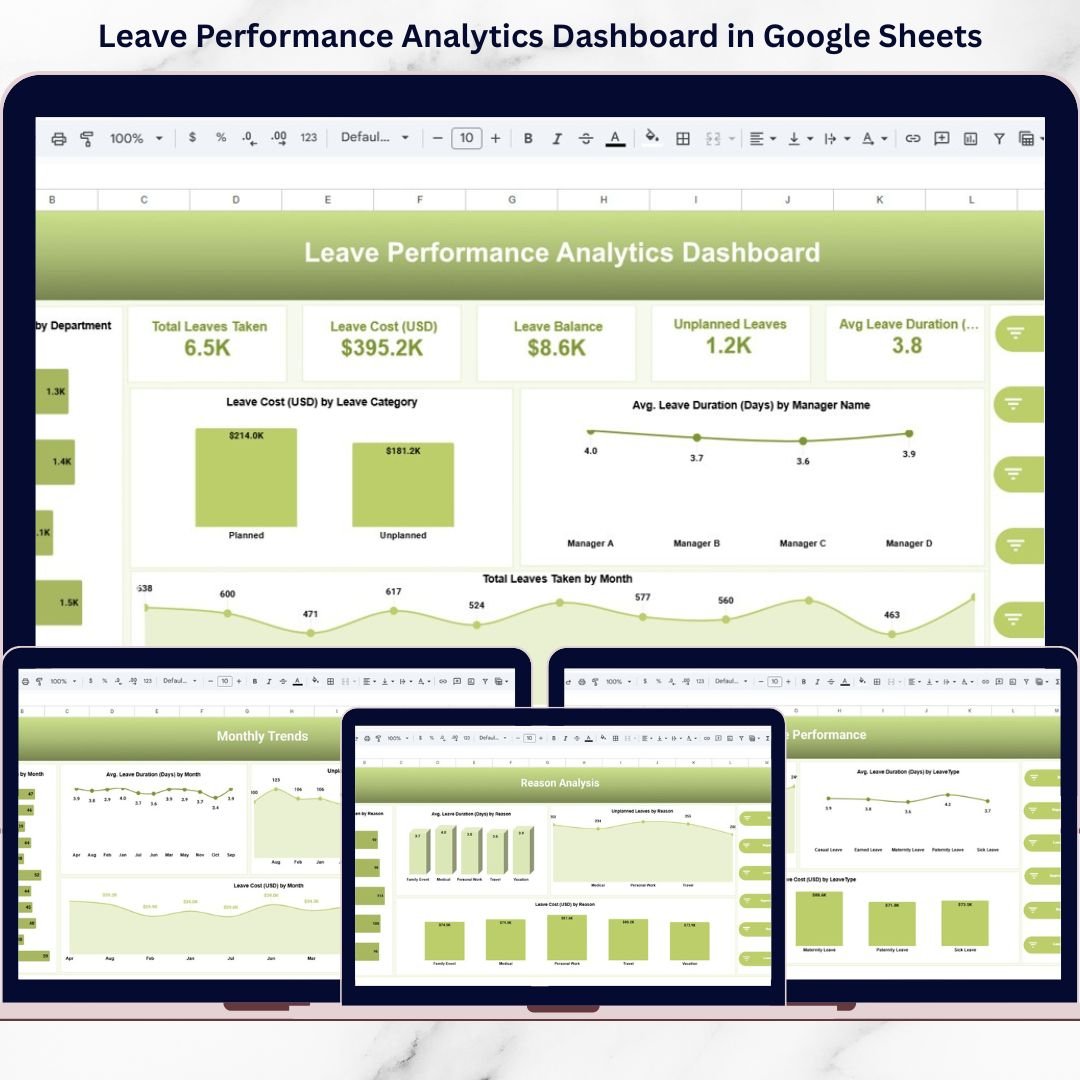
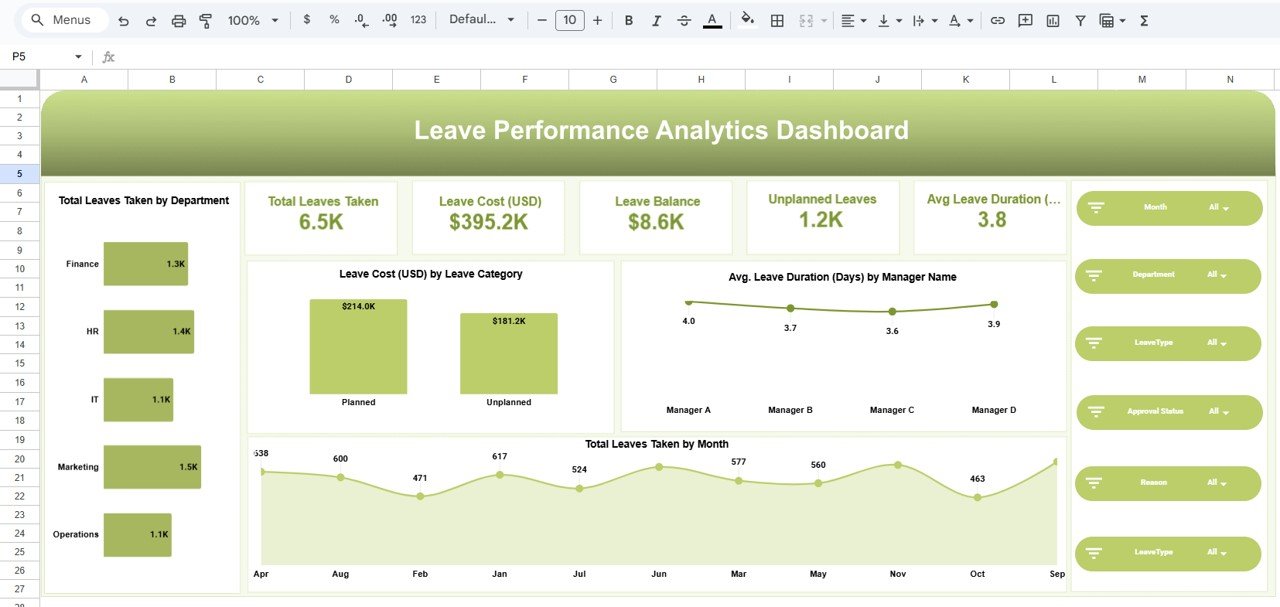
📌 Summary Dashboard
A high-level snapshot showing total leaves taken, leave cost, leave balance, unplanned leaves, and average leave duration.
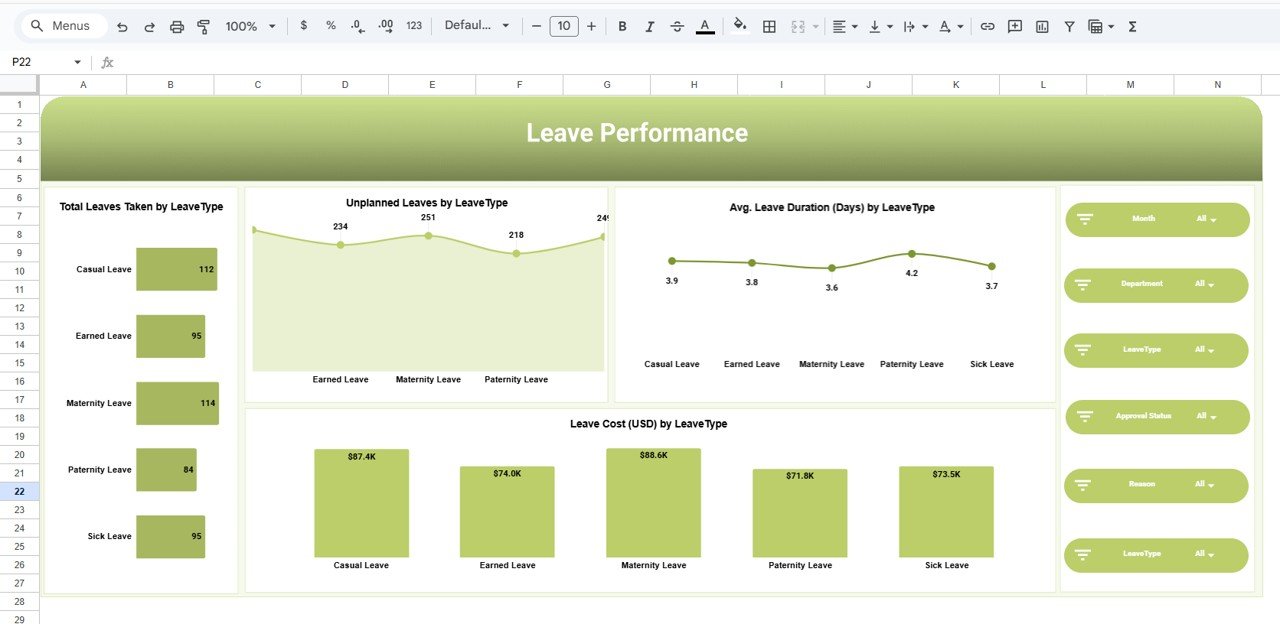
📌 Leave Type Analysis Page
Analyze total leaves, unplanned leaves, duration, and cost across casual, sick, earned, maternity, and paternity leaves.
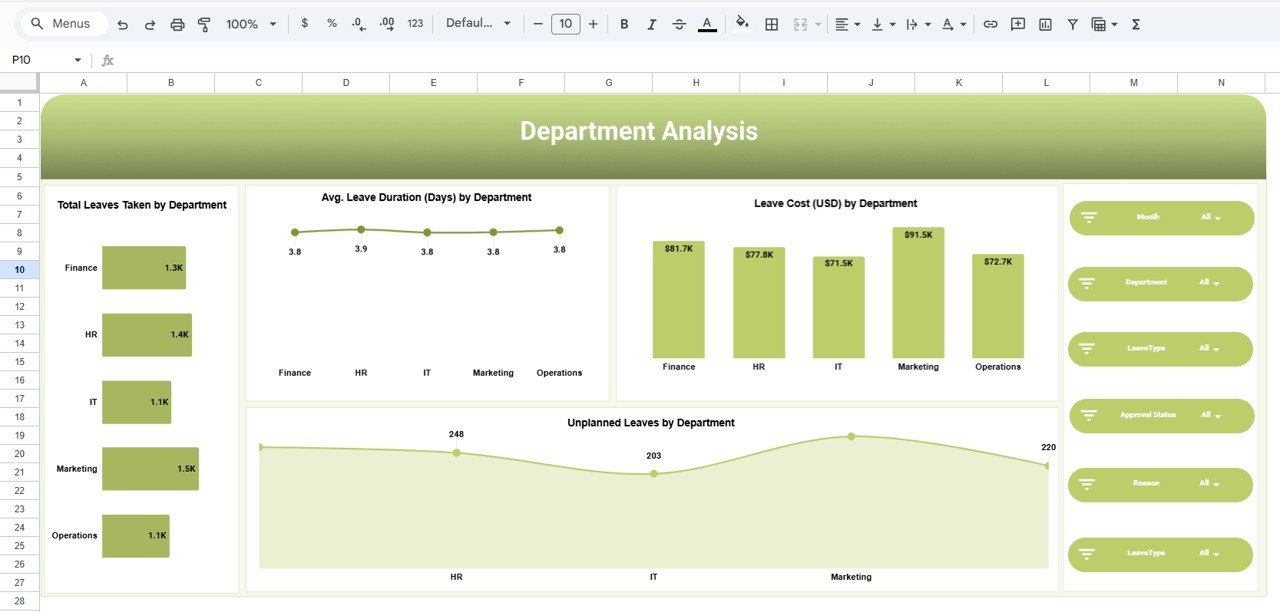
📌 Department Analysis Page
Compare departments based on leave volume, duration, cost, and unplanned leave behavior.
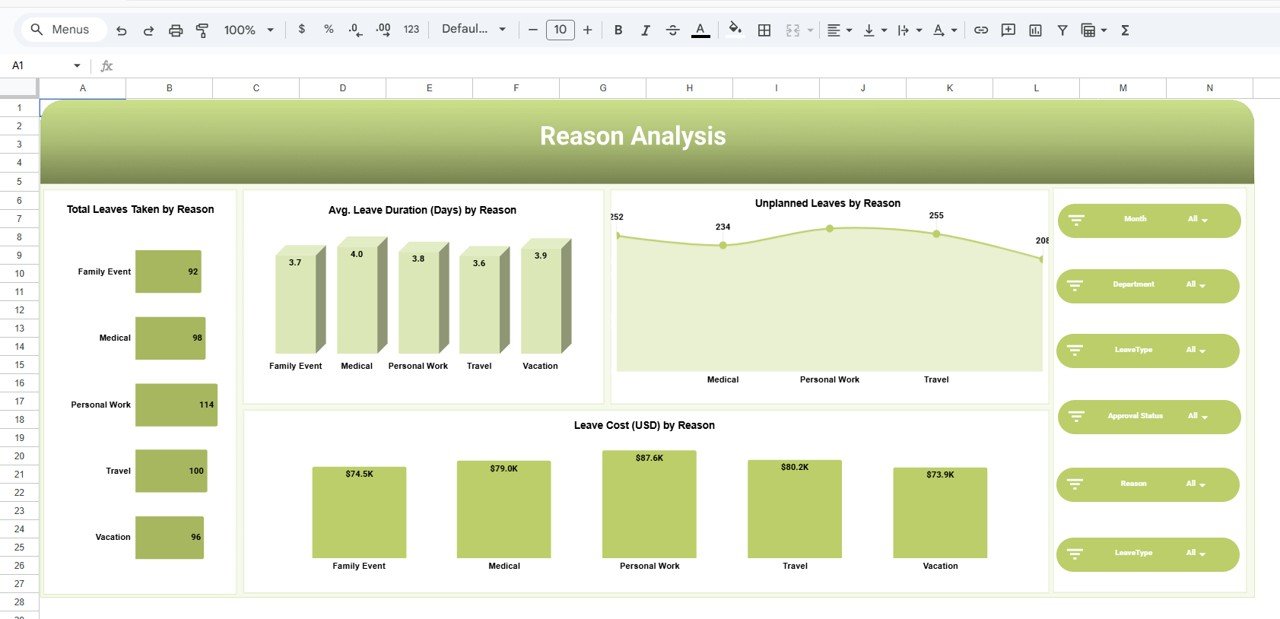
📌 Reason Analysis Page
Understand why employees take leaves — medical, personal work, family events, travel, or vacation.
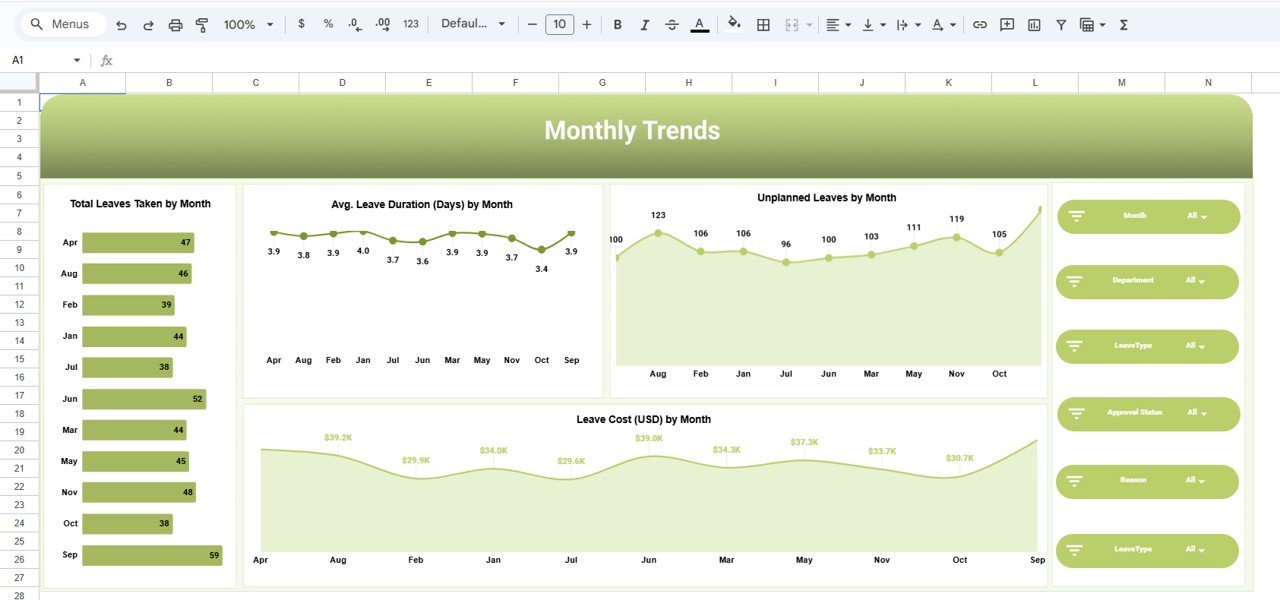
📌 Monthly Trends Page
Visualize leave patterns over time to support proactive workforce planning.
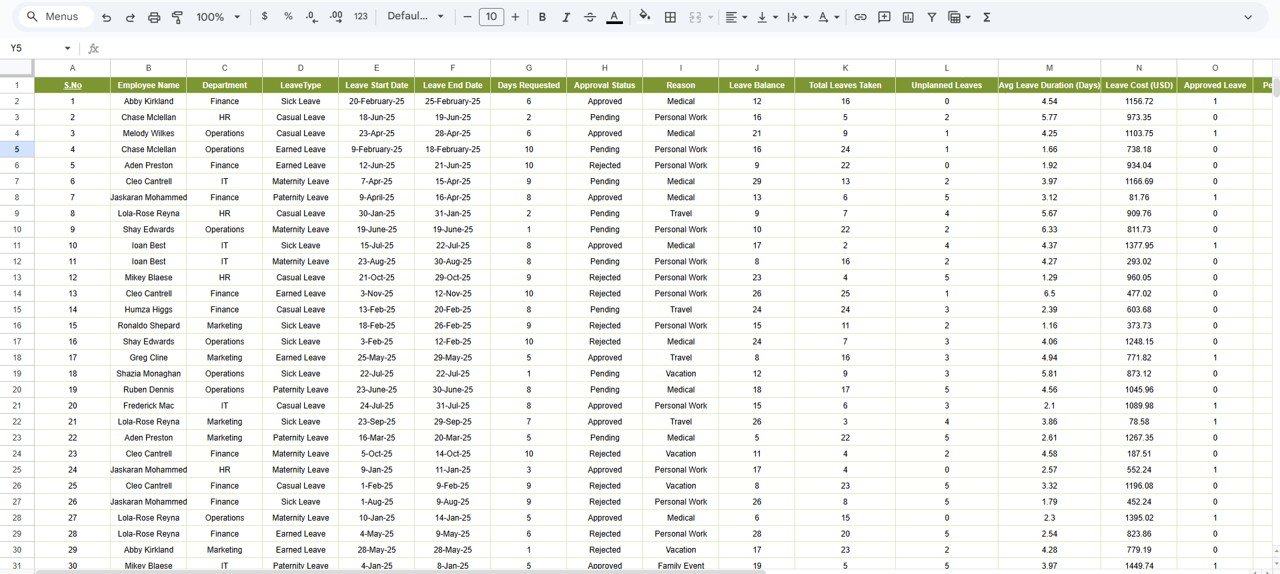
📌 Detailed Leave Data Table
A structured backend table containing employee, department, leave dates, approval status, cost, and indicators.
Each section is designed to answer real HR and management questions, not just display numbers.
🛠️ How to Use the Leave Performance Analytics Dashboard
1️⃣ Enter or paste employee leave data into the data table
2️⃣ The dashboard updates automatically
3️⃣ Use slicers to filter by department, leave type, or month
4️⃣ Monitor KPIs and trends instantly
5️⃣ Identify unplanned leave risks and cost drivers
6️⃣ Take informed actions for workforce planning
No formulas to fix. No manual reporting. Just instant insights.
🎯 Who Can Benefit from This Leave Performance Analytics Dashboard
👩💼 HR Managers – Monitor leave trends and reduce unplanned absences
📊 HR Analysts – Analyze workforce behavior with structured insights
🏢 Operations Managers – Plan staffing and avoid productivity gaps
👔 Department Heads – Compare team-wise leave impact
💼 Business Owners – Control leave-related costs
📈 Workforce Planning Teams – Support data-driven planning
Whether you manage a small team or a growing organization, this dashboard scales effortlessly.
🔗 Click here to read the Detailed blog post
Watch the step-by-step video tutorial: