Managing hedge fund performance without real-time visibility often leads to delayed decisions, hidden risks, and missed growth opportunities. When teams depend on static reports or disconnected spreadsheets, understanding AUM, NAV, returns, and fund activity becomes slow and reactive.
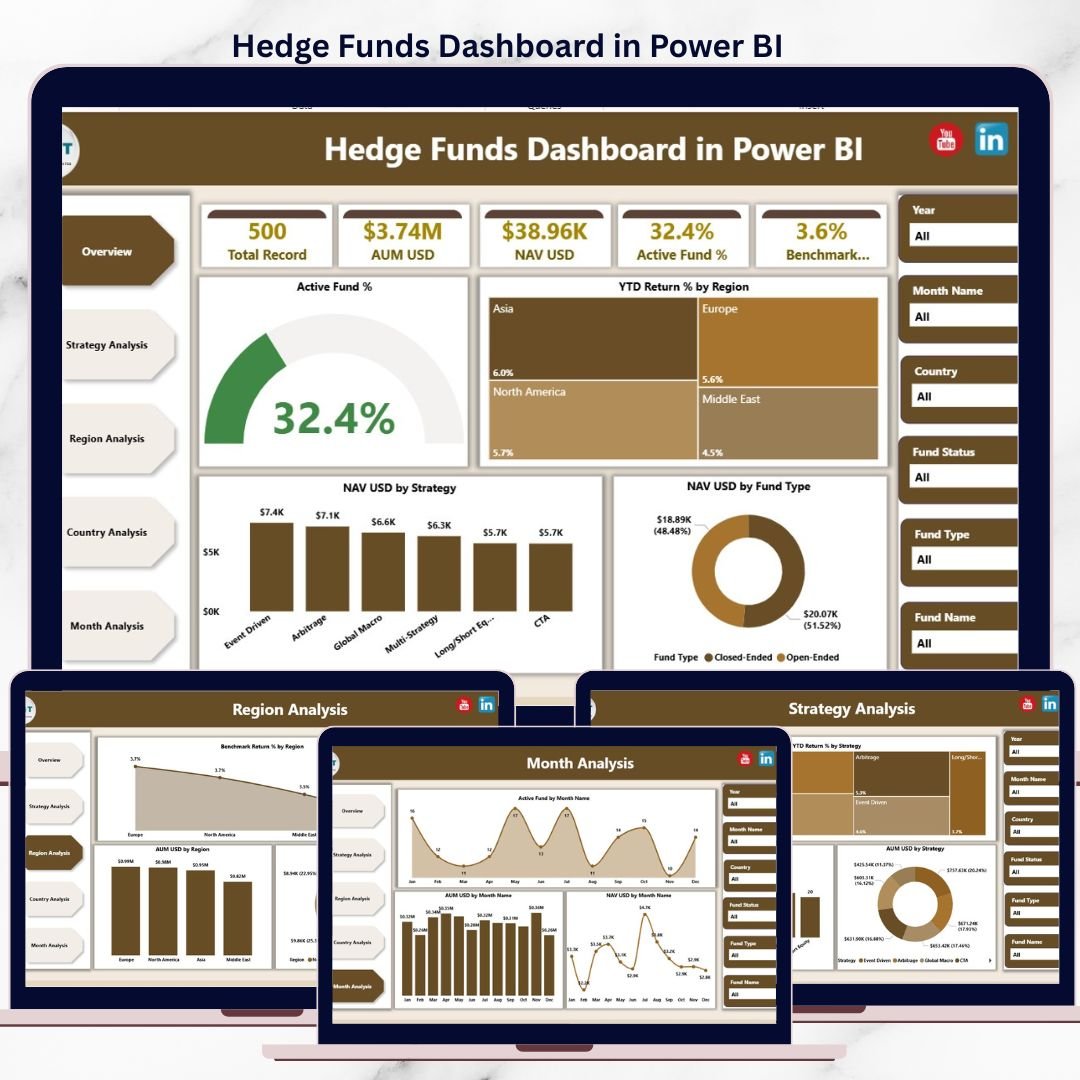
The Hedge Funds Dashboard in Power BI is a ready-to-use, professional analytics solution designed to give hedge fund managers, analysts, and leadership teams instant clarity across strategies, regions, countries, and time periods.
This Power BI dashboard transforms raw hedge fund data into interactive KPIs, dynamic visuals, and actionable insights—all in one centralized platform. With built-in slicers, trend analysis, and automated refresh, it enables faster, more confident, and data-driven investment decisions.
🚀 Key Features of Hedge Funds Dashboard in Power BI
📊 Centralized Hedge Fund Performance View
Track AUM, NAV, active funds, benchmark returns, and YTD returns in one dashboard.
🎯 Interactive Power BI Slicers
Analyze performance by strategy, region, country, and month instantly.
📈 Five Dedicated Analysis Pages
Overview, Strategy Analysis, Region Analysis, Country Analysis, and Month Analysis.
⚡ Real-Time & Automated Refresh
Always work with the latest hedge fund data.
🔍 Multi-Dimensional Performance Insights
Compare strategies, geographies, and time-based trends with ease.
🔐 Enterprise-Ready Power BI Design
Clean, professional layout suitable for leadership and investor reviews.
🎨 Decision-Focused Visuals
KPI cards, charts, and trends designed for clarity and speed.
📦 What’s Inside the Hedge Funds Dashboard in Power BI
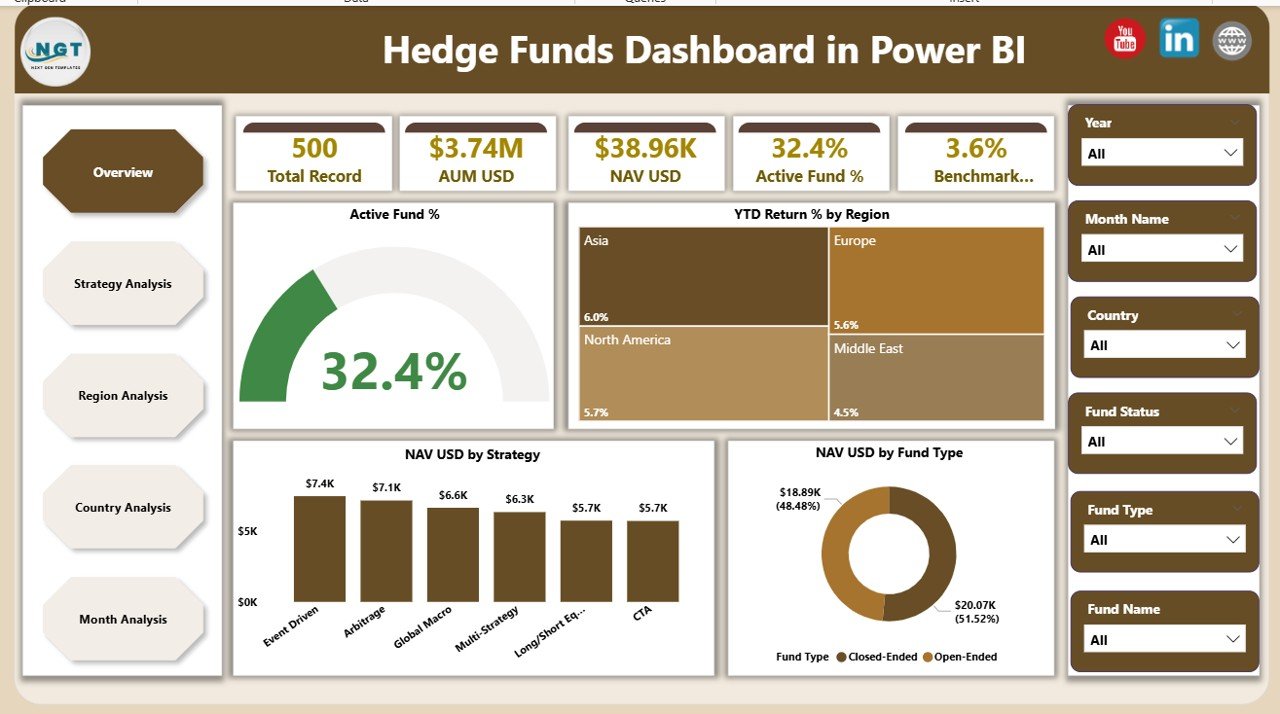
📁 Overview Page
High-level snapshot of overall hedge fund performance, including:
-
Active Fund %
-
YTD Return % by Region
-
NAV USD by Strategy
-
NAV USD by Fund Type
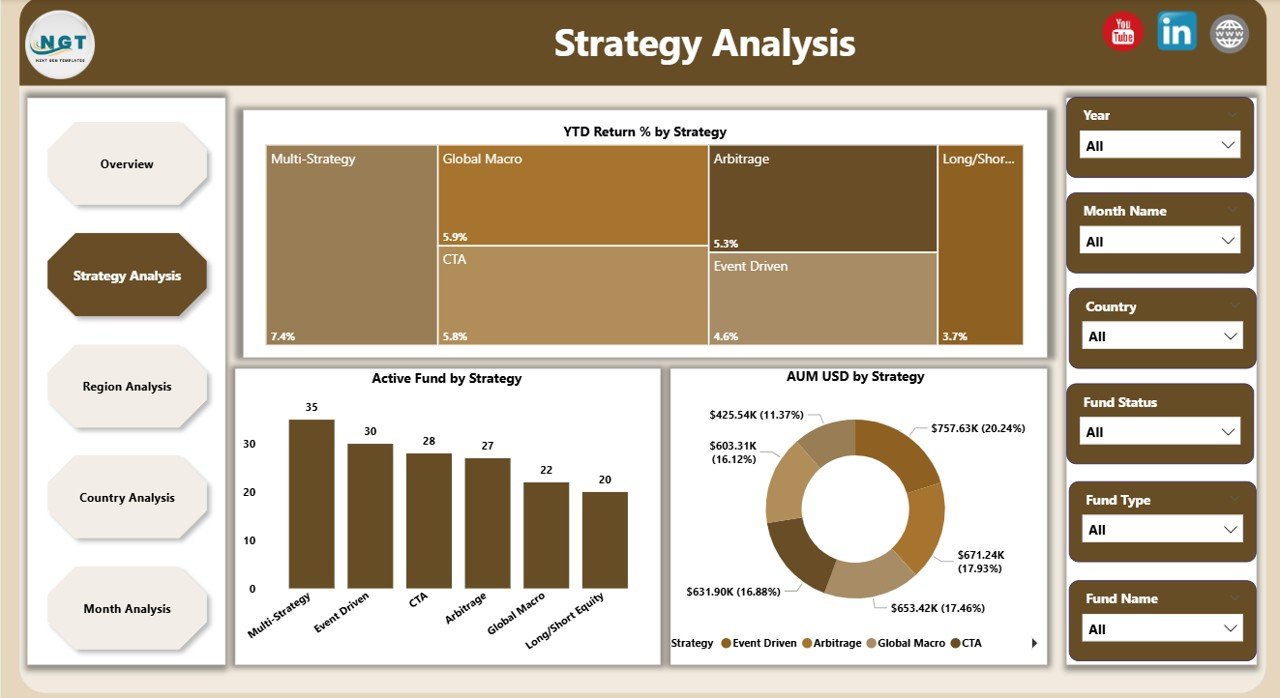
📁 Strategy Analysis Page
Evaluate hedge fund strategies using:
-
YTD Return % by Strategy
-
AUM USD by Strategy
-
Active Fund by Strategy
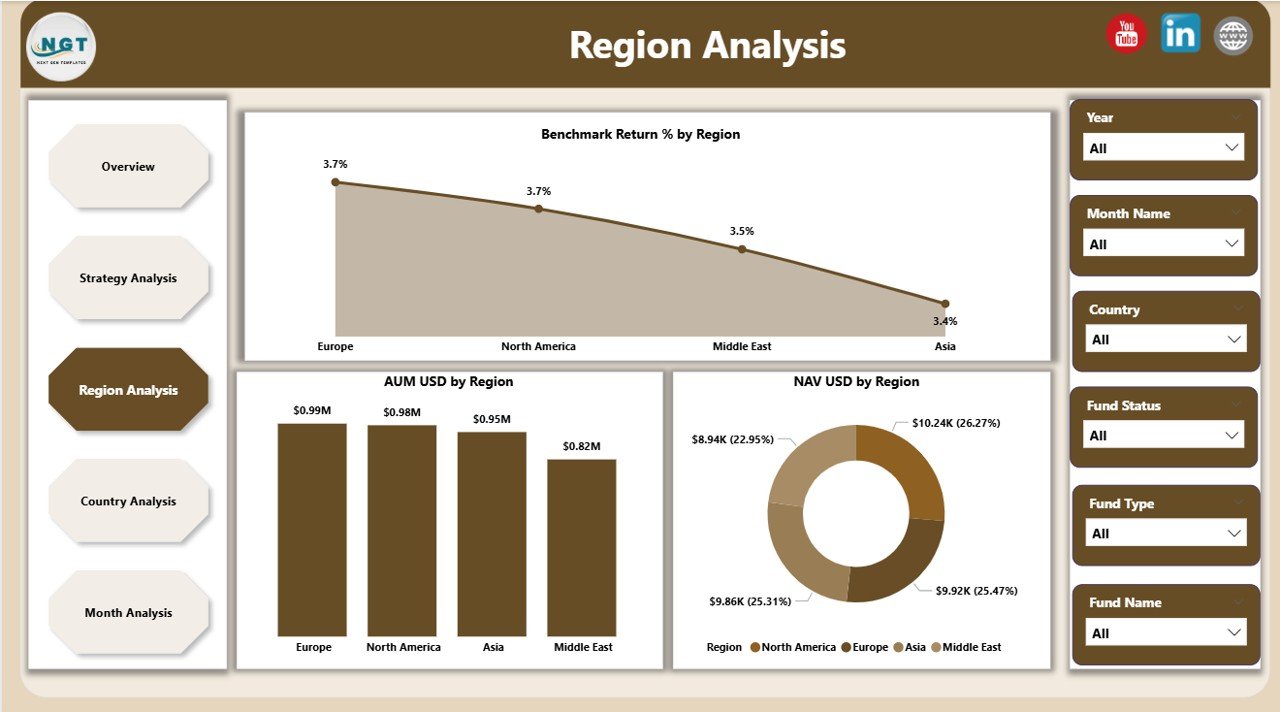
📁 Region Analysis Page
Compare geographic performance with:
-
Benchmark Return % by Region
-
AUM USD by Region
-
NAV USD by Region
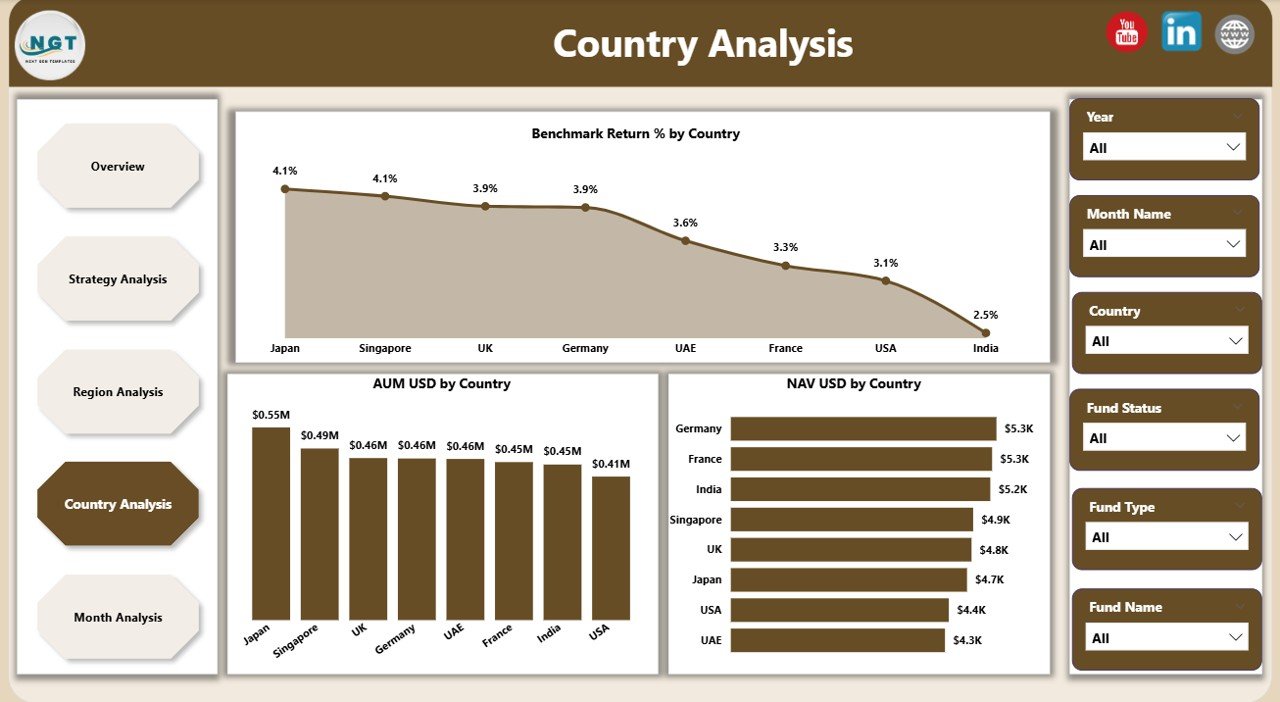
📁 Country Analysis Page
Drill down into country-level insights:
-
Benchmark Return % by Country
-
AUM USD by Country
-
NAV USD by Country
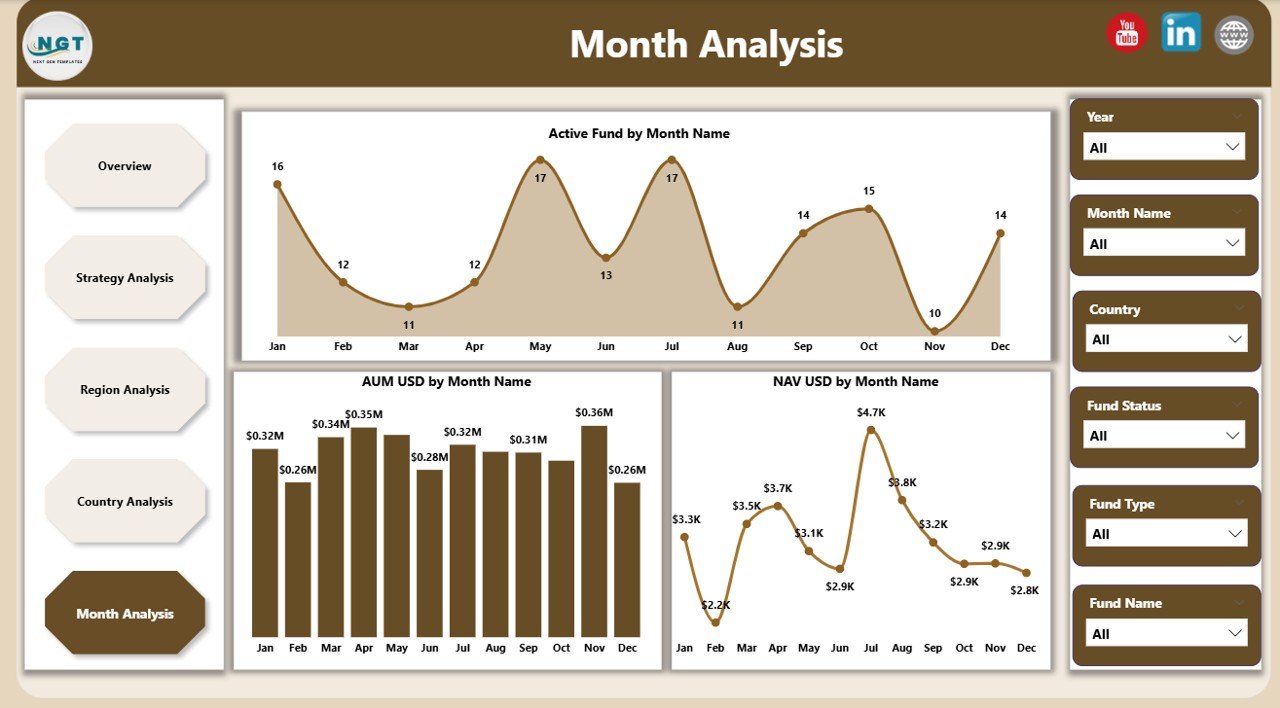
📁 Month Analysis Page
Track trends over time using:
-
Active Fund by Month
-
AUM USD by Month
-
NAV USD by Month
📁 Interactive Filters & KPI Cards
Instant insights with no manual calculations.
🛠️ How to Use the Hedge Funds Dashboard in Power BI
1️⃣ Load hedge fund data from Excel or a database
2️⃣ Refresh the Power BI dataset
3️⃣ Use slicers to filter by strategy, region, country, or month
4️⃣ Review KPIs and performance trends instantly
5️⃣ Drill down into underperforming areas
6️⃣ Export insights for reports or presentations
No coding required—Power BI handles modeling, calculations, and visuals.
👥 Who Can Benefit from This Hedge Funds Dashboard
💼 Hedge Fund Managers – Monitor fund performance and exposure
📈 Portfolio Managers – Compare strategies and returns
📊 Investment Analysts – Analyze trends faster
⚠️ Risk Management Teams – Track regional and country exposure
🏦 Finance & Reporting Teams – Reduce manual reporting effort
👔 Executive Leadership & Investors – Gain high-level clarity
If your role involves hedge fund analytics, this dashboard is built for you.
📘 Click here to read the Detailed blog post
🎥 Visit our YouTube channel to learn step-by-step video tutorials
👉 Youtube.com/@PKAnExcelExpert


Reviews
There are no reviews yet.