
Special Education Dashboard programs require precision, visibility, and timely action. Schools, educators, therapists, and administrators must track attendance, assessments, therapy sessions, progress levels, and support program effectiveness—all at the same time. However, when this data is scattered across multiple Excel files or manual registers, it becomes difficult to see the full picture.
That is exactly why the Special Education Dashboard in Excel is a must-have solution 🎯.
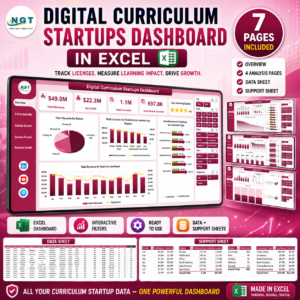
This ready-to-use Excel dashboard transforms raw special education data into clear, interactive, and easy-to-understand visual insights. Instead of spending hours preparing reports, users can instantly monitor student progress, identify gaps, and take informed decisions using dynamic charts, KPI cards, and slicers.
Built entirely in Microsoft Excel, this dashboard is cost-effective, flexible, and easy to use—even for non-technical users. Whether you manage one school or multiple institutions, this dashboard helps you move from reactive reporting to proactive support planning.
🔑 Key Features of Special Education Dashboard in Excel
📊 Centralized special education performance tracking
🧭 Page Navigator on the left for easy navigation
🎛️ Right-side slicers for dynamic filtering
📈 Visual tracking of attendance, assessments, and progress
🧩 Disability-wise and program-wise analysis
📅 Month-wise trend analysis
🧮 Pivot-based charts for flexibility and scalability
🧠 User-friendly design for educators and administrators
📂 What’s Inside the Special Education Dashboard in Excel
This dashboard is thoughtfully designed with multiple analytical pages, each focusing on a key aspect of special education management.
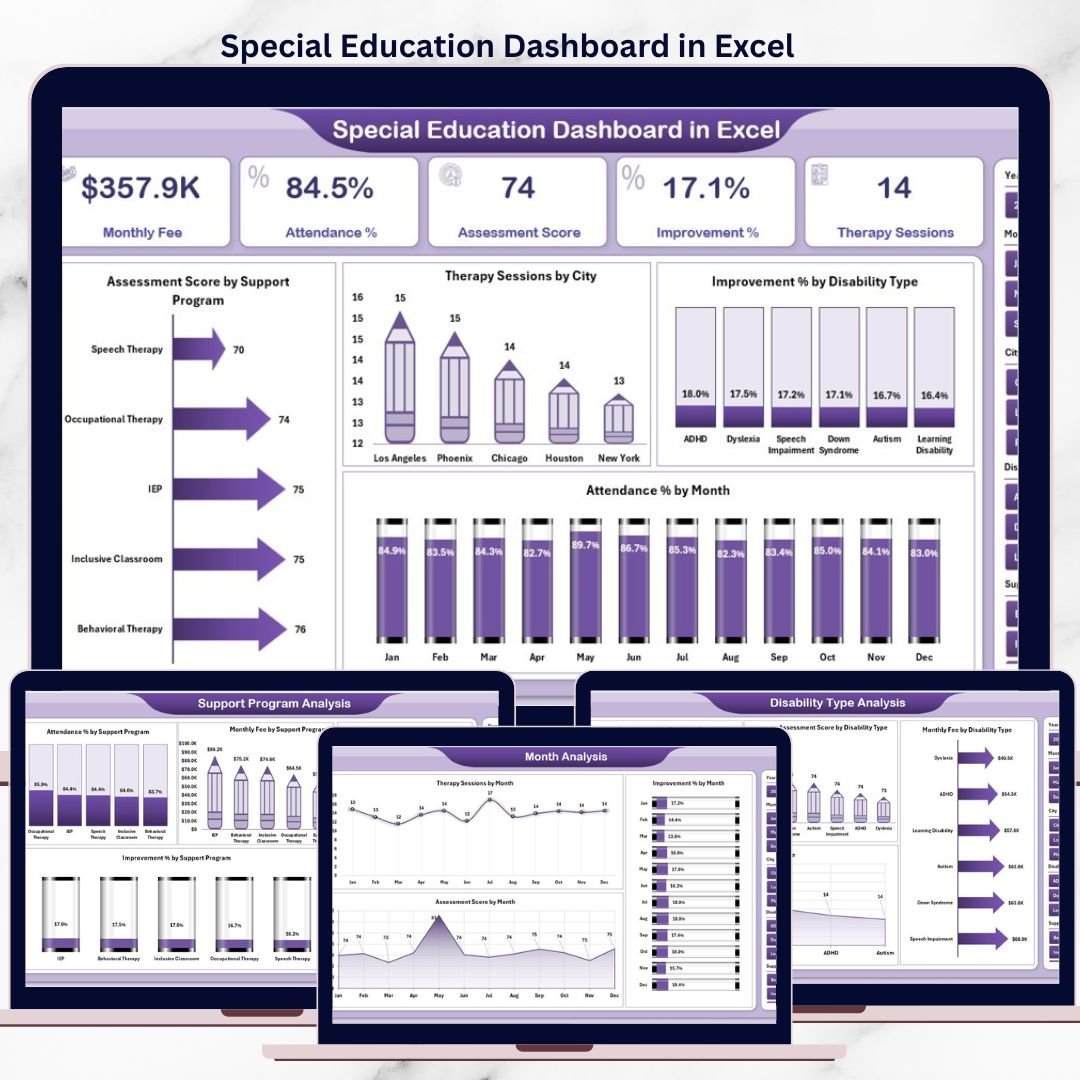
📌 Overview Page – Complete Performance Snapshot

Special Education Dashboard
The Overview Page acts as the command center of the dashboard.
What you see here:
-
🎛️ Right-side slicers for instant filtering
-
📌 4 KPI cards showing high-level performance
-
📊 Clear, visual charts for quick understanding
Key charts included:
-
📈 Assessment Score by Support Program
-
🏙️ Therapy Sessions by City
-
♿ Improvement % by Disability Type
-
📅 Attendance % by Month
This page allows decision-makers to understand overall performance at a glance.
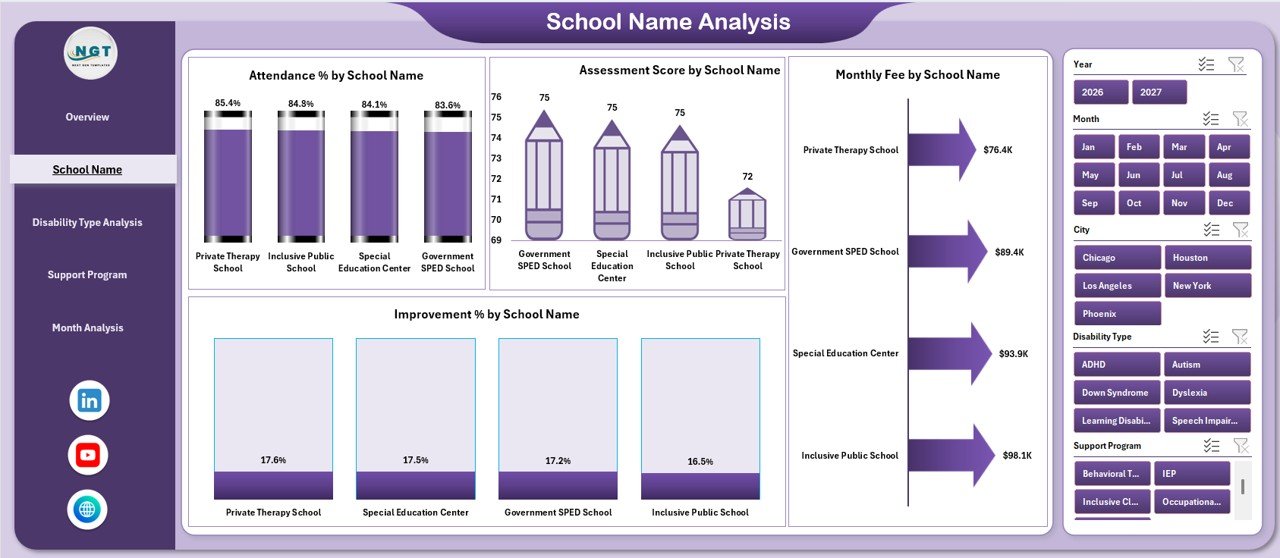
🏫 School Name Analysis – Compare School Performance
This page helps administrators compare performance across schools.
Insights provided:
-
📊 Attendance % by School Name
-
🎯 Assessment Score by School Name
-
💰 Monthly Fee by School Name
-
📈 Improvement % by School Name
With slicers on the right side, schools can instantly identify top performers and improvement areas.
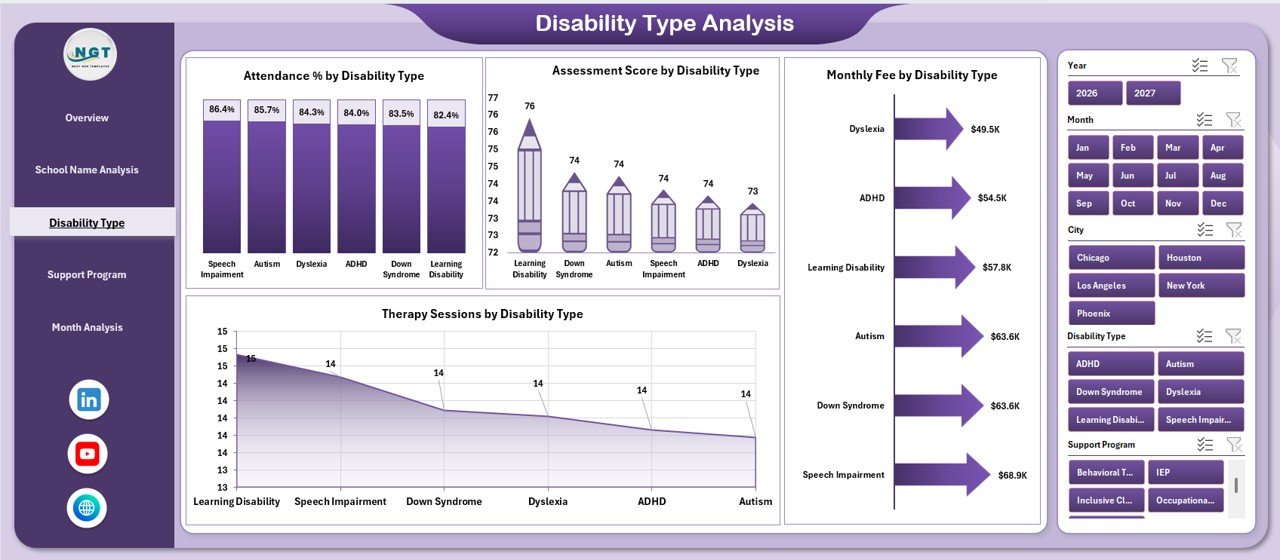
♿ Disability Type Analysis – Inclusive Performance Tracking
Inclusive education requires disability-wise visibility.
This page shows:
-
📊 Attendance % by Disability Type
-
🧠 Assessment Score by Disability Type
-
💰 Monthly Fee by Disability Type
-
🩺 Therapy Sessions by Disability Type
As a result, institutions allocate resources where they are needed most.
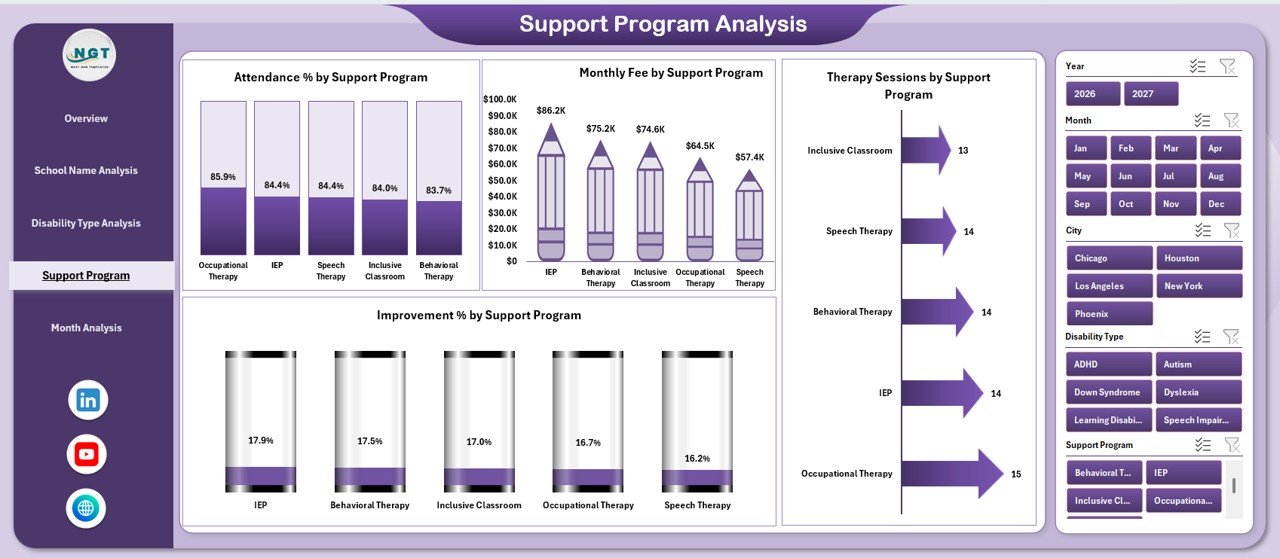
🧩 Support Program Analysis – Measure Program Effectiveness
Not all support programs deliver the same results. This page evaluates each program clearly.
Key insights include:
-
📈 Improvement % by Support Program
-
🩺 Therapy Session distribution
-
📊 Attendance trends
-
💰 Monthly fee comparison
This helps leadership focus on high-impact programs.
📅 Month Analysis – Track Trends Over Time
Education performance changes over time. Therefore, trend analysis is essential.
This page includes:
-
📈 Improvement % by Month
-
🩺 Therapy Sessions by Month
-
🎯 Assessment Score by Month
With these insights, schools can spot seasonal patterns and plan interventions early.
📂 How the Data Structure Works
📋 Data Sheet
Stores all raw student, school, disability, program, and time-based data.
⚙️ Support Sheet
Manages helper tables, calculations, and consistency for pivot charts.
Together, these sheets ensure accuracy, automation, and reliability.
👥 Who Can Benefit from This Dashboard?
🏫 Special education schools
👩🏫 Teachers & therapists
📊 School administrators
📚 Education consultants
🏛️ Policy planners & coordinators
📖 Click here to read the Detailed blog post
▶️ Visit our YouTube channel to learn step-by-step video tutorials
https://youtube.com/@PKAnExcelExpert


Reviews
There are no reviews yet.