
Running a landscaping business today is no longer just about mowing lawns or designing gardens. It is about managing labor costs, tracking profitability, controlling discounts, monitoring unpaid invoices, and understanding which services and customers truly drive growth. Doing all this manually or through disconnected spreadsheets leads to missed opportunities and costly mistakes.
That is exactly why the Landscaping Services Dashboard in Power BI is a must-have solution for modern landscaping businesses.
This ready-to-use Power BI dashboard transforms your raw landscaping data into clear, interactive, and actionable insights. Instead of guessing performance or spending hours building reports, you get a professionally designed dashboard that shows the complete picture of your business in one place.
🌟 Key Features of Landscaping Services Dashboard in Power BI
🚀 All-in-One Business View
Track invoices, profit, labor costs, taxes, discounts, and balances from a single Power BI dashboard.
📊 Multi-Page Business Analysis
Analyze performance across Overview, Service Types, Customers, Lead Sources, and Finance with dedicated pages.
💰 Profit & Cost Visibility
Instantly understand which services, customers, and regions generate the highest profit.
📍 Region & Service-Level Insights
Monitor tax, overhead, and profitability by service type and geographic region.
🔎 Interactive Filters & Slicers
Slice data by service type, customer category, lead source, and region for deeper analysis.
⚡ Fast, Scalable & Reliable
Built on Power BI best practices, making it suitable for both small teams and growing enterprises.
📦 What’s Inside the Landscaping Services Dashboard in Power BI
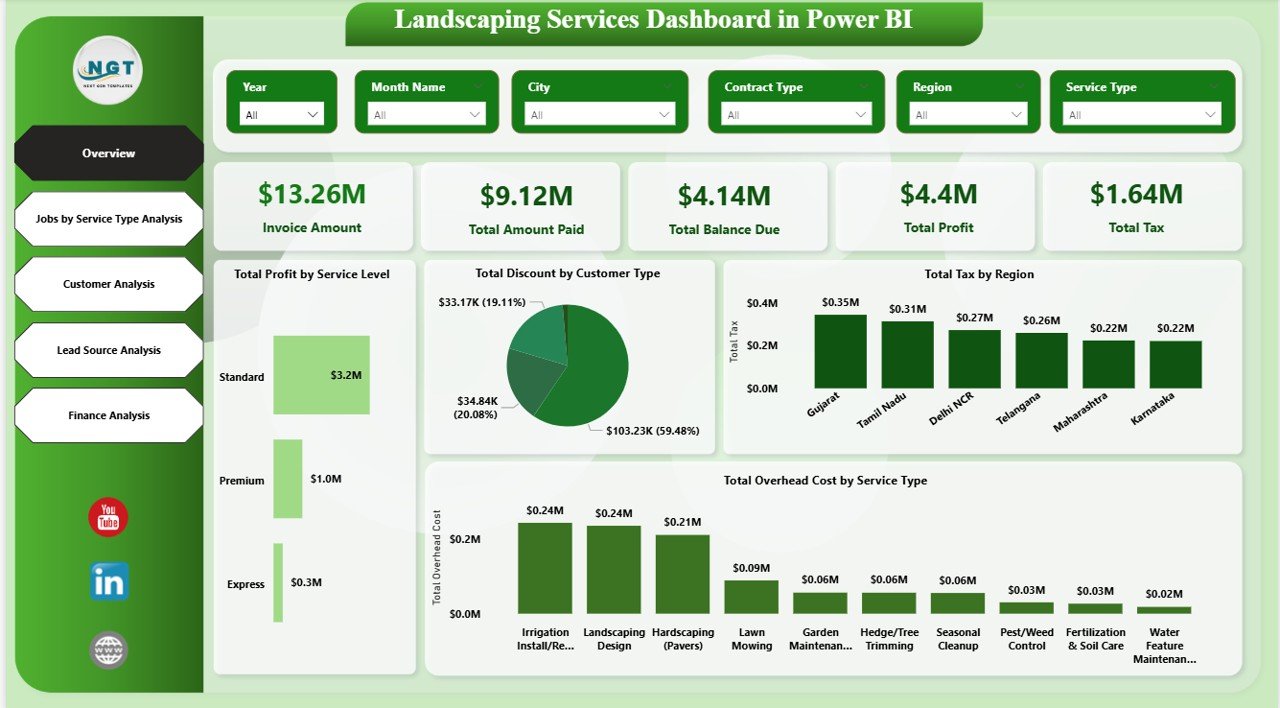
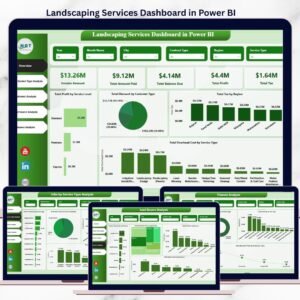
📈 Overview Page
A high-level snapshot showing invoice amount, amount paid, balance due, profit, total tax, and key visual comparisons.
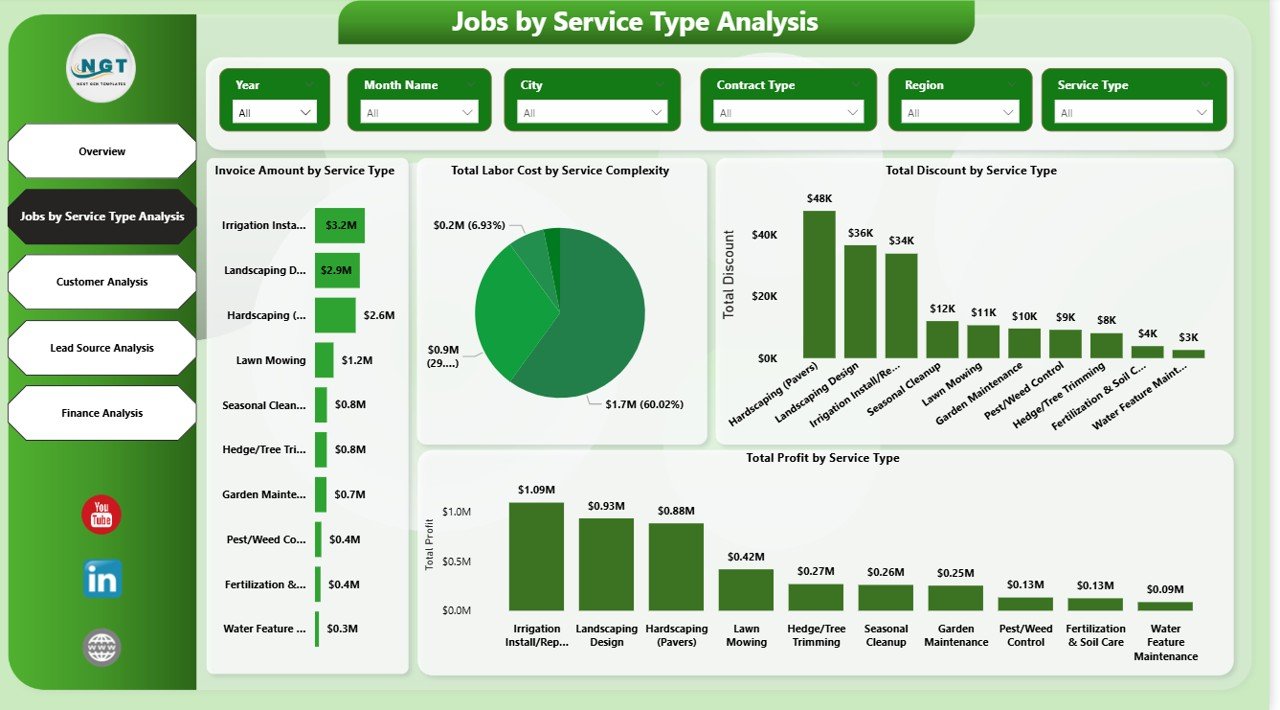
🧱 Jobs by Service Type Analysis
Understand invoice value, labor cost, profit, and discounts across different landscaping services.
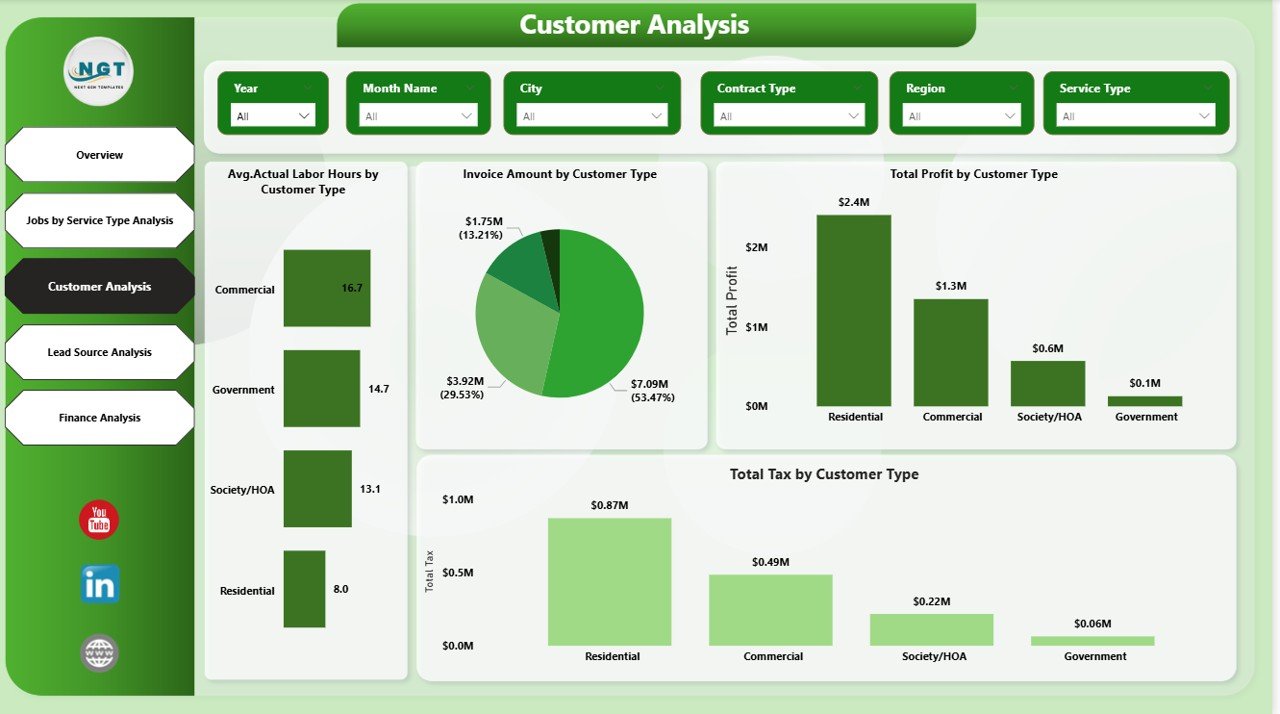
👥 Customer Analysis Page
Identify high-value customers, labor-intensive segments, tax behavior, and customer profitability.
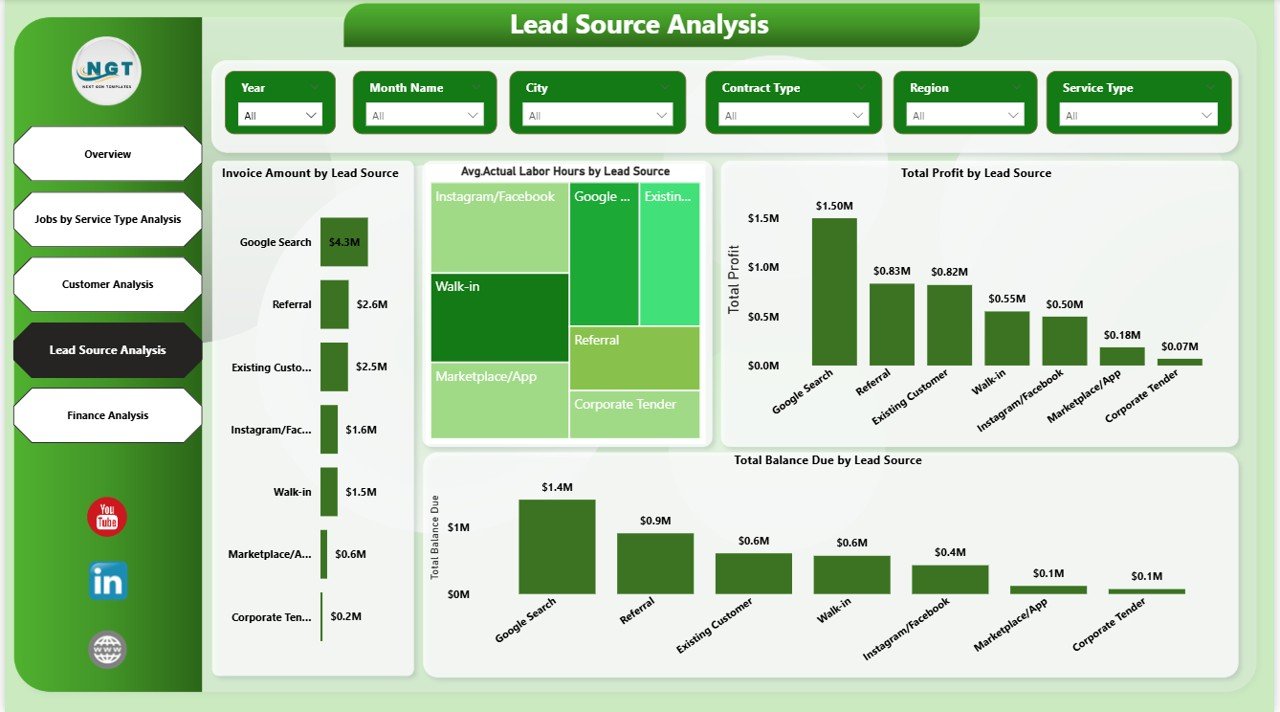
📢 Lead Source Analysis Page
Measure revenue, profit, balance due, and labor effort by marketing channel.
💼 Finance Analysis Page
Focus on cash flow, overhead costs, service profitability, and financial efficiency.
📂 Structured Data Model
Clean and logical data model designed for easy refresh and future scalability.
🛠️ How to Use the Landscaping Services Dashboard in Power BI
1️⃣ Load your landscaping data from Excel, accounting tools, or job management systems
2️⃣ Refresh the Power BI dataset
3️⃣ Use slicers to filter by service, region, customer type, or lead source
4️⃣ Analyze trends, identify issues, and uncover growth opportunities
5️⃣ Take confident, data-driven business decisions
No advanced Power BI knowledge is required. The dashboard is designed for business owners, managers, and analysts.
🎯 Who Can Benefit from This Landscaping Services Dashboard in Power BI
🌱 Residential Landscaping Companies
🏢 Commercial Landscaping Service Providers
🌾 Lawn Care & Garden Maintenance Firms
🧱 Hardscaping & Irrigation Contractors
📍 Multi-Location Landscaping Businesses
📊 Operations Managers & Business Owners
💼 Finance & Strategy Teams
If you want clarity instead of confusion and data instead of guesswork, this dashboard is built for you.
Click here to read the Detailed blog post
Watch the step-by-step video tutorial:


Reviews
There are no reviews yet.