
The oil and gas industry operates on massive data, tight margins, and constant operational pressure. Every day, organizations track production, operating cost, revenue, profit margins, and capacity utilization across multiple countries and regions. Oil and Gas Dashboard in Power BI However, when this data stays scattered across Excel files, static reports, and legacy systems, decision-making slows down and risks increase.
Oil and Gas Dashboard in Power BI That is exactly why the Oil and Gas Dashboard in Power BI becomes a powerful, modern, and business-critical solution 🚀.
Oil and Gas Dashboard in Power BI This ready-to-use Power BI dashboard transforms complex oil and gas data into clear, interactive, and actionable insights. Instead of spending hours preparing reports, leaders can instantly monitor performance, identify inefficiencies, and respond quickly to operational or market changes. Moreover, Power BI’s advanced visuals, slicers, and drill-down features make analysis faster and more reliable.
Designed for upstream, midstream, and downstream operations, this dashboard helps organizations control costs, improve utilization, maximize profits, and plan strategically—all from one centralized platform.
⭐ Key Features of Oil and Gas Dashboard in Power BI
🛢️ Centralized Performance Monitoring
Track operational and financial KPIs in a single interactive dashboard.
💰 Real-Time Financial Insights
Monitor operating cost, revenue, total profit, and profit margin % instantly.
⚙️ Operational Efficiency Tracking
Analyze capacity utilization and production performance with ease.
🌍 Country & Region-Wise Analysis
Compare performance across regions and countries for better planning.
📈 Trend-Based Performance Monitoring
Track monthly cost, revenue, and profit trends.
🎛️ Interactive Power BI Experience
Use slicers, filters, and visuals for fast, self-service analysis.
📦 What’s Inside the Oil and Gas Dashboard in Power BI
This professionally designed Power BI file contains 5 interactive analytical pages, each answering a critical business question.
📊 Overview Page
The executive summary of oil and gas performance.
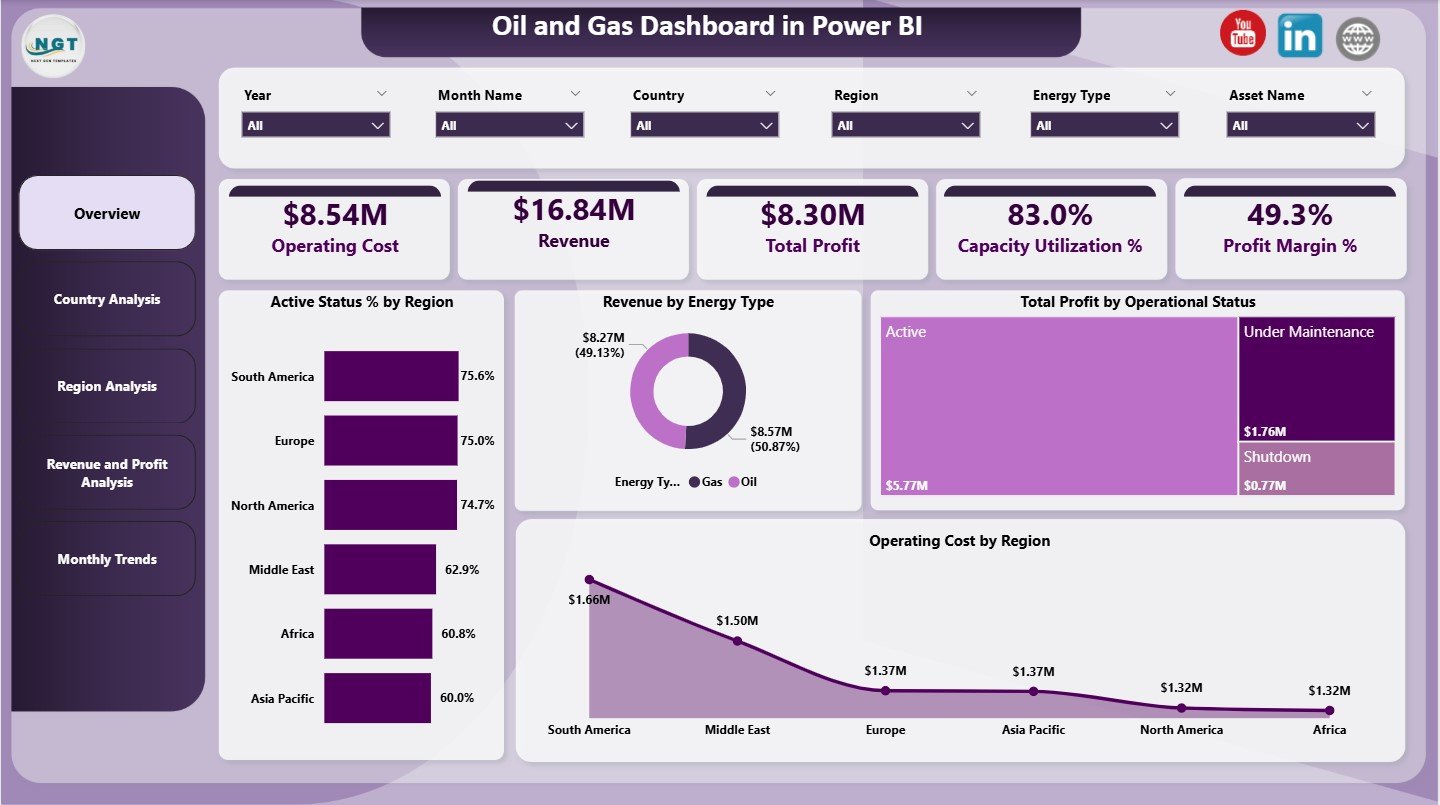
KPI Cards
-
Operating Cost
-
Revenue
-
Total Profit
-
Capacity Utilization %
-
Profit Margin %
Charts
-
Active Status % by Region
-
Revenue by Energy Type
-
Total Profit by Operational Status
-
Operating Cost by Region
This page gives leadership an instant snapshot of business health.
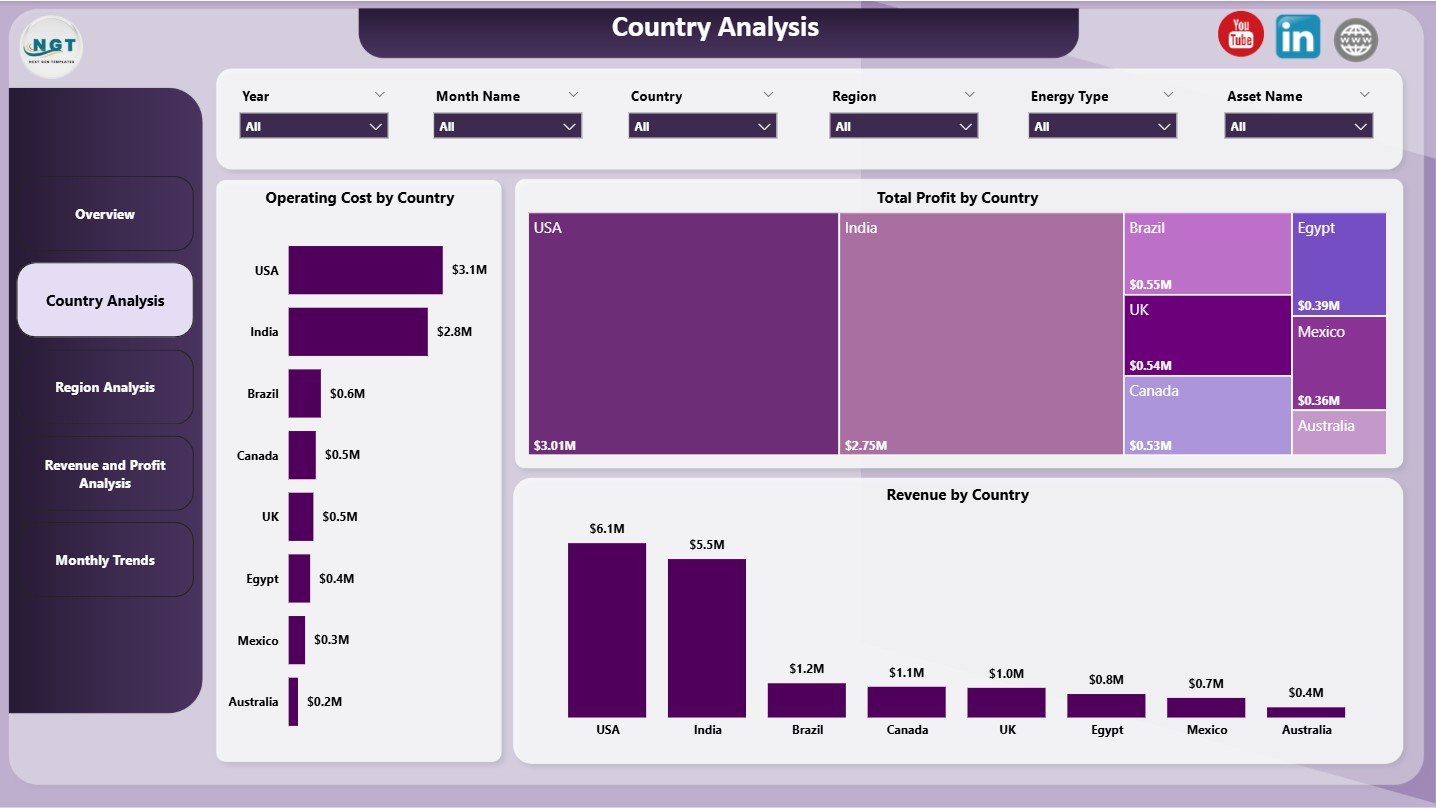
🌍 Country Analysis Page
Focuses on country-level performance comparison.
Charts
-
Operating Cost by Country
-
Total Profit by Country
-
Revenue by Country
Helps identify high-cost and high-profit countries quickly.
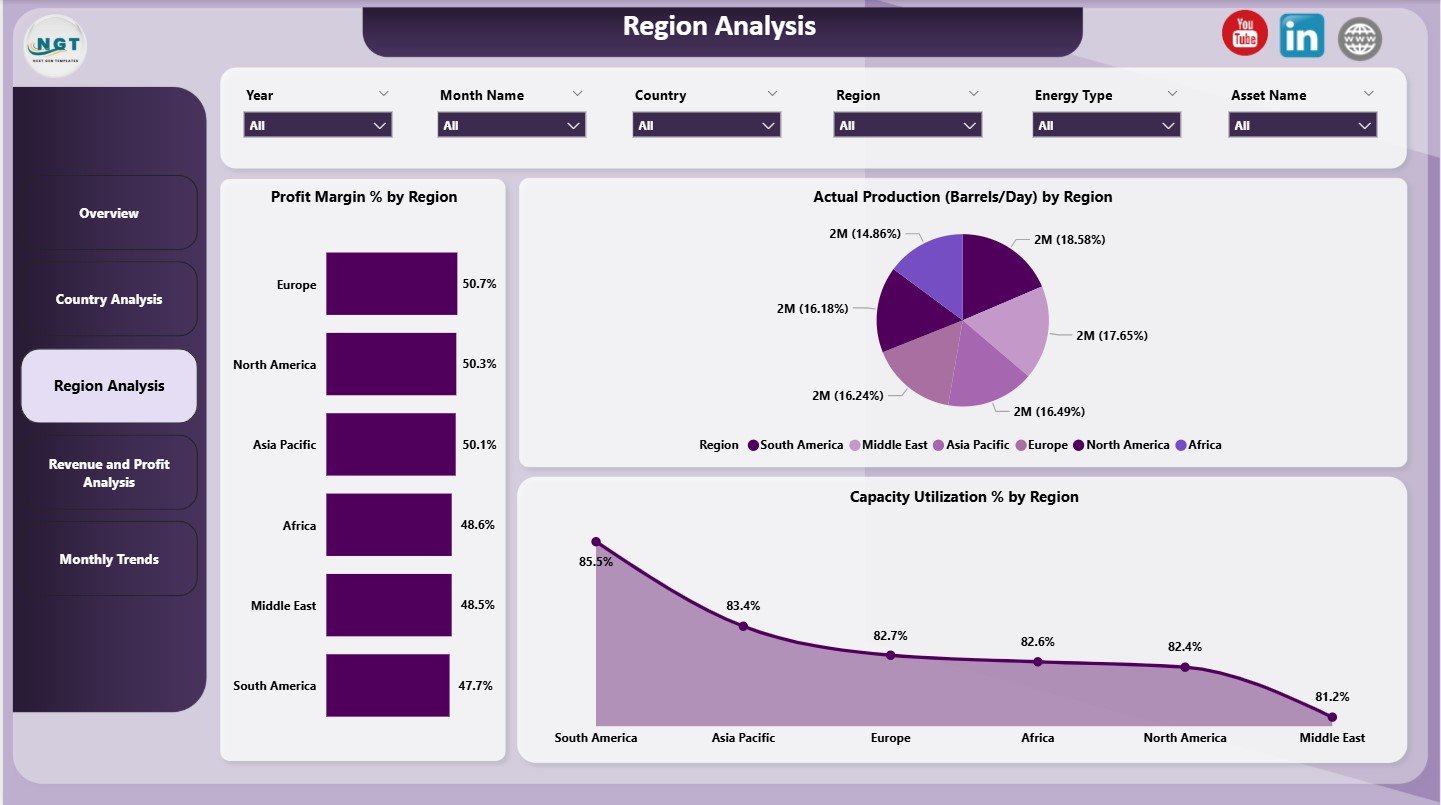
🗺️ Region Analysis Page
Provides regional-level operational insights.
Charts
-
Profit Margin % by region
-
Actual Production (Barrels/Day) by region
-
Capacity Utilization % by region
Supports operational planning and resource allocation.
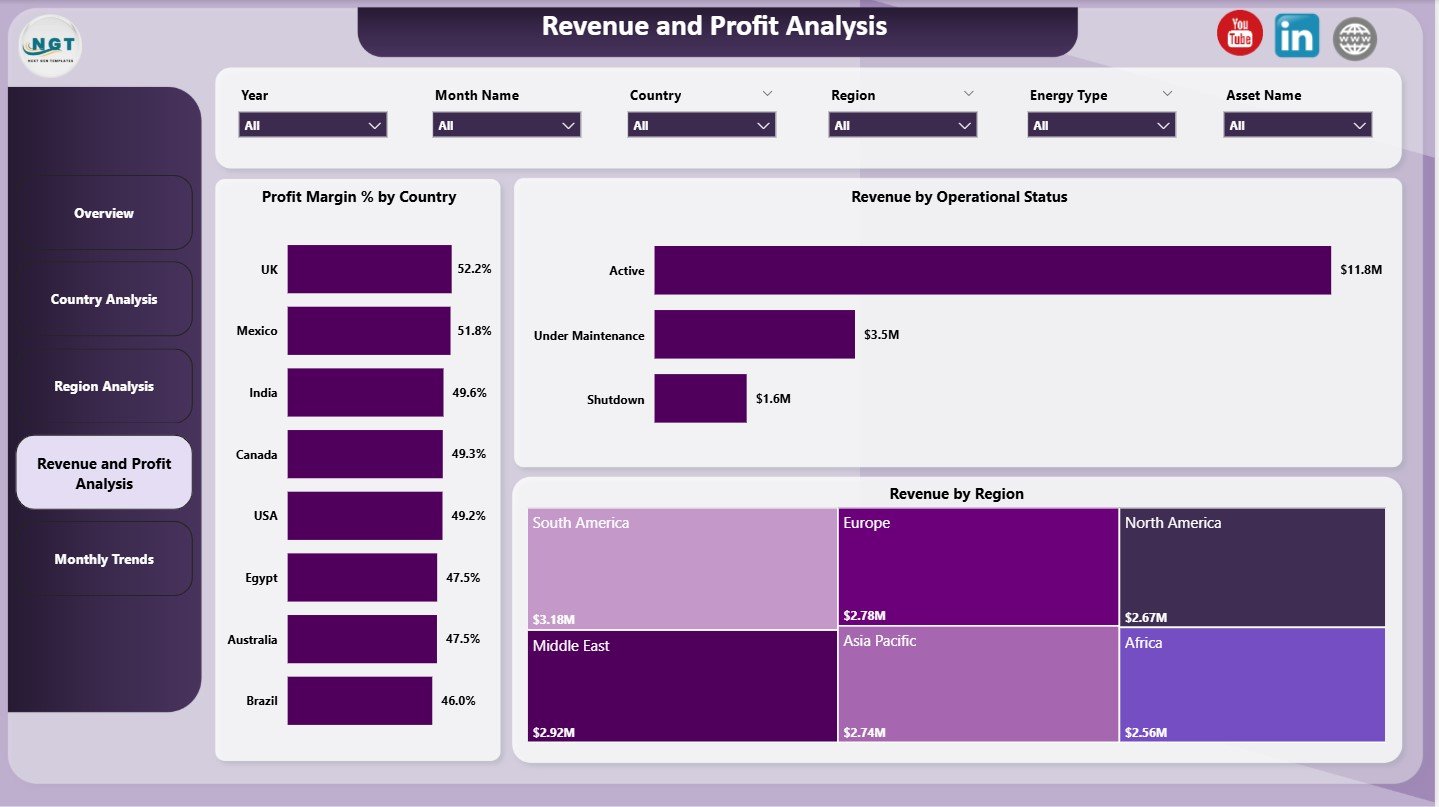
💵 Revenue & Profit Analysis Page
Explains financial performance drivers.
Charts
-
Profit Margin % by Country
-
Revenue by Operational Status
-
Revenue by Region
Helps finance and strategy teams understand where profits come from.
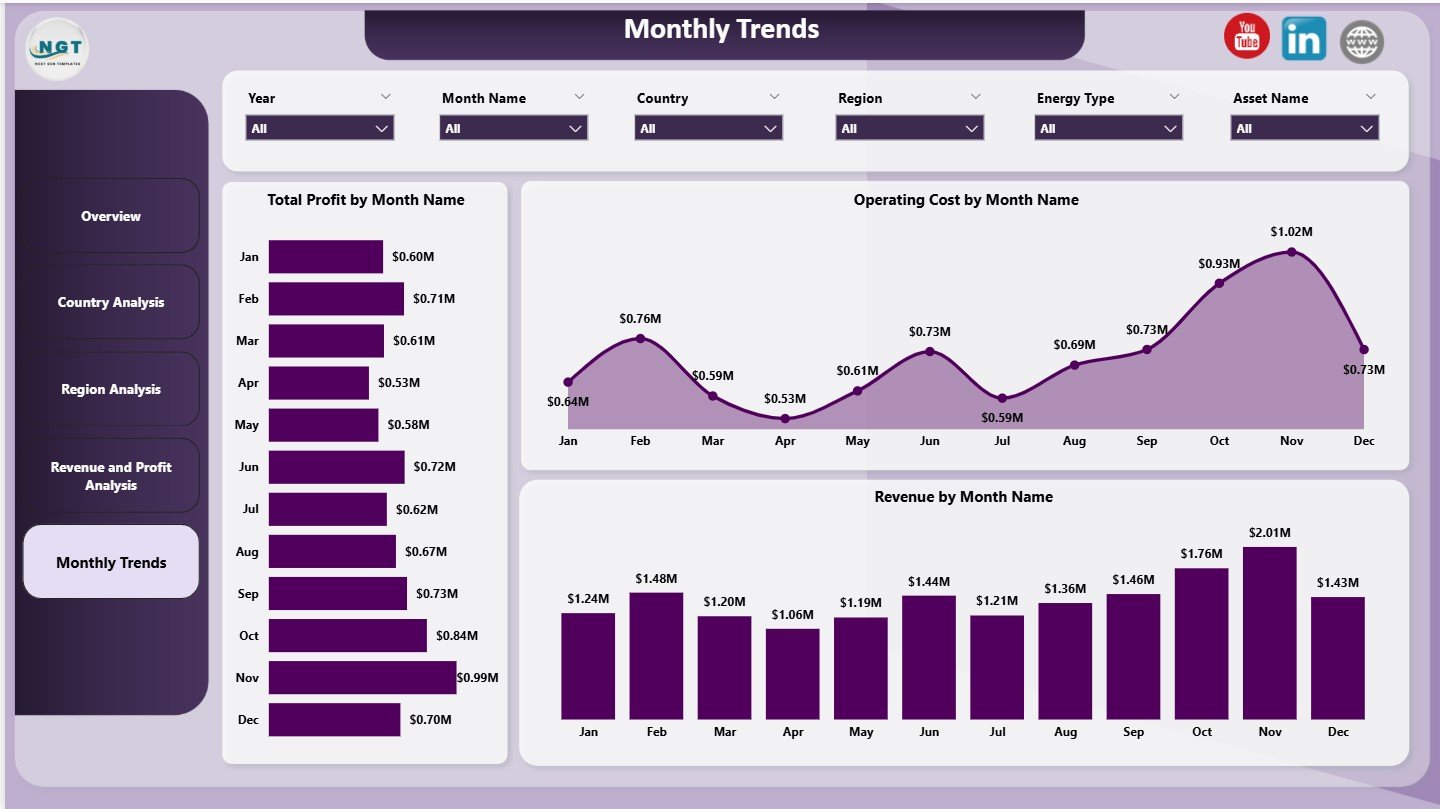
📅 Monthly Trends Page
Tracks performance changes over time.
Charts
-
Total Profit by Month
-
Operating Cost by Month
-
Revenue by Month
Supports forecasting, budgeting, and long-term planning.
🛠️ How to Use the Oil and Gas Dashboard in Power BI
Using this dashboard is simple and efficient:
1️⃣ Load oil and gas data into Power BI
2️⃣ Refresh the dataset
3️⃣ Use slicers to filter by country, region, or energy type
4️⃣ Review KPI cards and visuals
5️⃣ Analyze trends and operational gaps
6️⃣ Make faster, data-driven decisions
Because Power BI automates calculations and visuals, reporting becomes accurate and scalable.
👥 Who Can Benefit from This Oil and Gas Dashboard
This dashboard is ideal for:
🛢️ Oil and Gas Executives
⚙️ Operations & Production Managers
💰 Finance & Cost Controllers
📊 Strategy & Planning Teams
🌍 Regional & Country Heads
👔 Senior Leadership
Anyone involved in oil and gas performance management will gain immediate value.


Reviews
There are no reviews yet.