Managing municipal services efficiently is no longer optional—it is essential. City governments and local authorities handle thousands of service requests related to sanitation, water supply, road maintenance, public utilities, and citizen complaints. However, when operational data remains scattered across multiple spreadsheets or manual registers, monitoring performance becomes slow, inaccurate, and stressful.
That is exactly where the Municipal Services Dashboard in Excel delivers massive value.
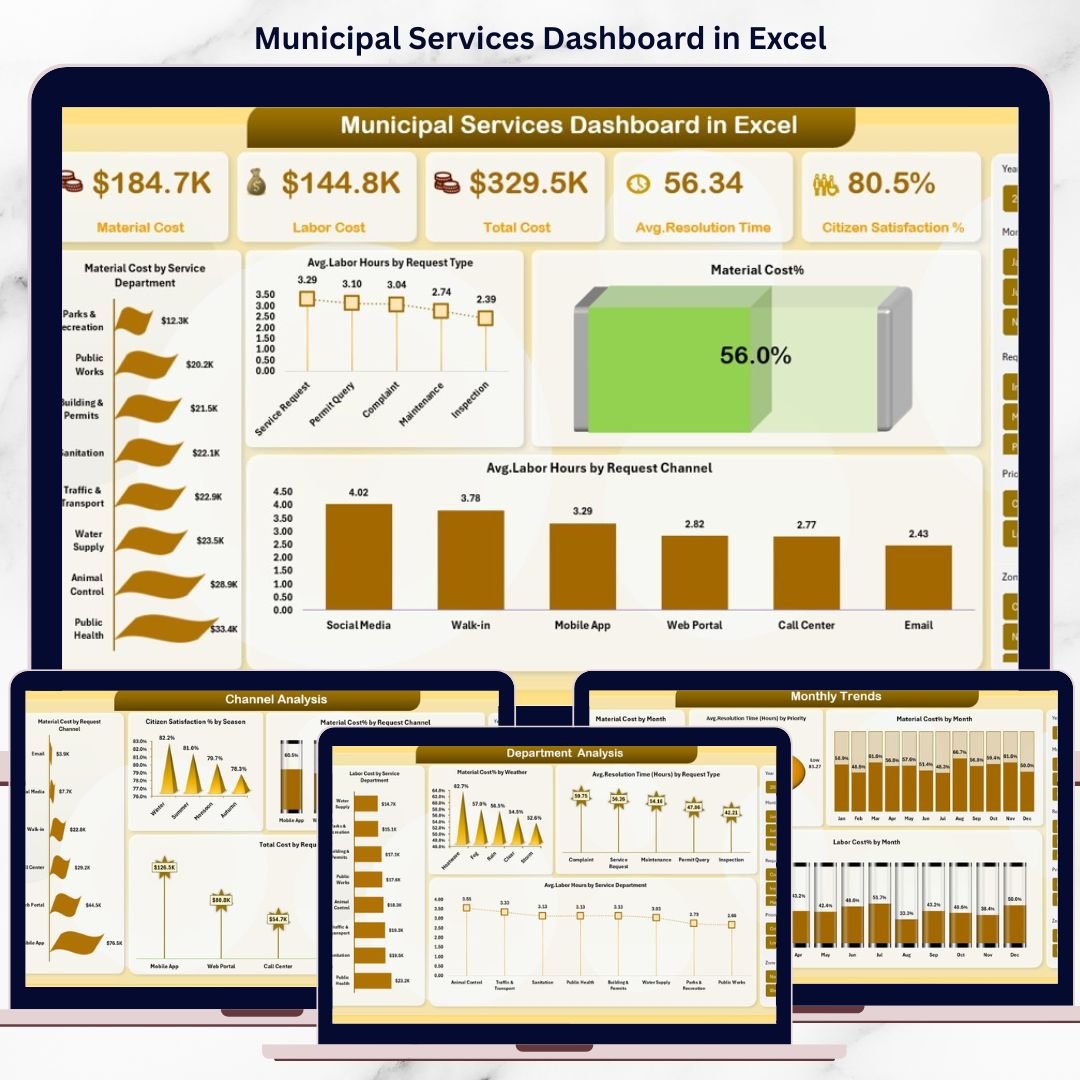
This ready-to-use Excel dashboard transforms raw municipal service data into powerful visual insights. Instead of reviewing endless rows of numbers, decision-makers can instantly understand costs, resolution efficiency, labor utilization, and citizen satisfaction from a single interactive dashboard. Best of all, it works completely inside Microsoft Excel—no complex software, no additional licenses, and no steep learning curve.
This dashboard is designed to help municipalities improve transparency, reduce operational costs, and deliver better public services using data-driven decision-making.
🚀 Key Features of Municipal Services Dashboard in Excel
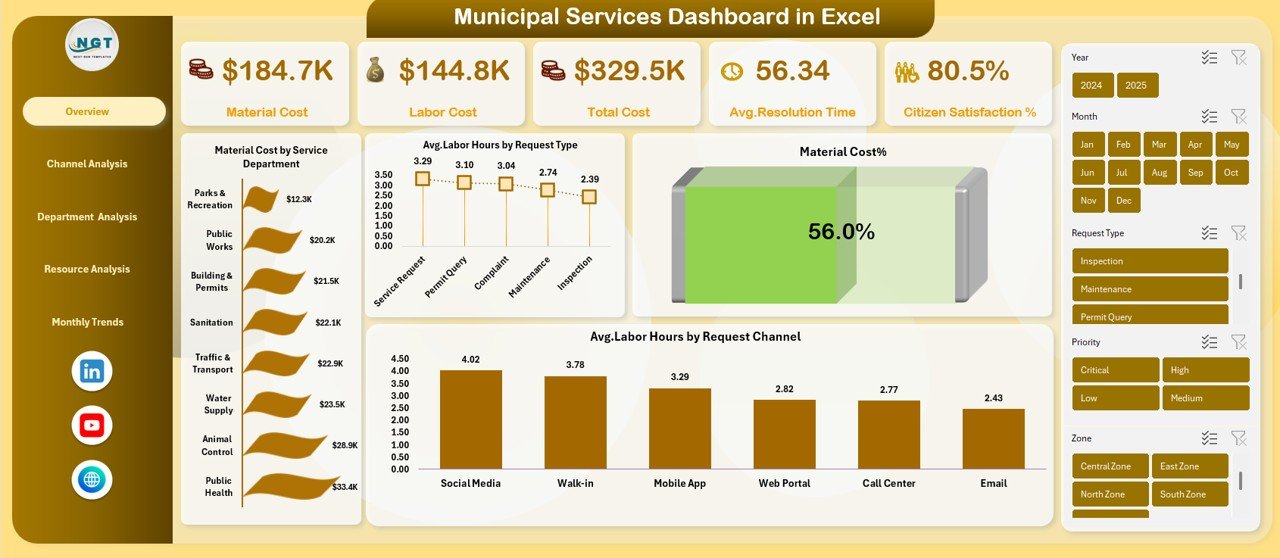
📊 Comprehensive KPI Tracking – Monitor Material Cost, Labor Cost, Total Cost, Average Resolution Time (Hours), and Citizen Satisfaction % in real time.
🧭 Interactive Page Navigation – Seamlessly move between Overview, Channel Analysis, Department Analysis, Resource Analysis, and Monthly Trends.
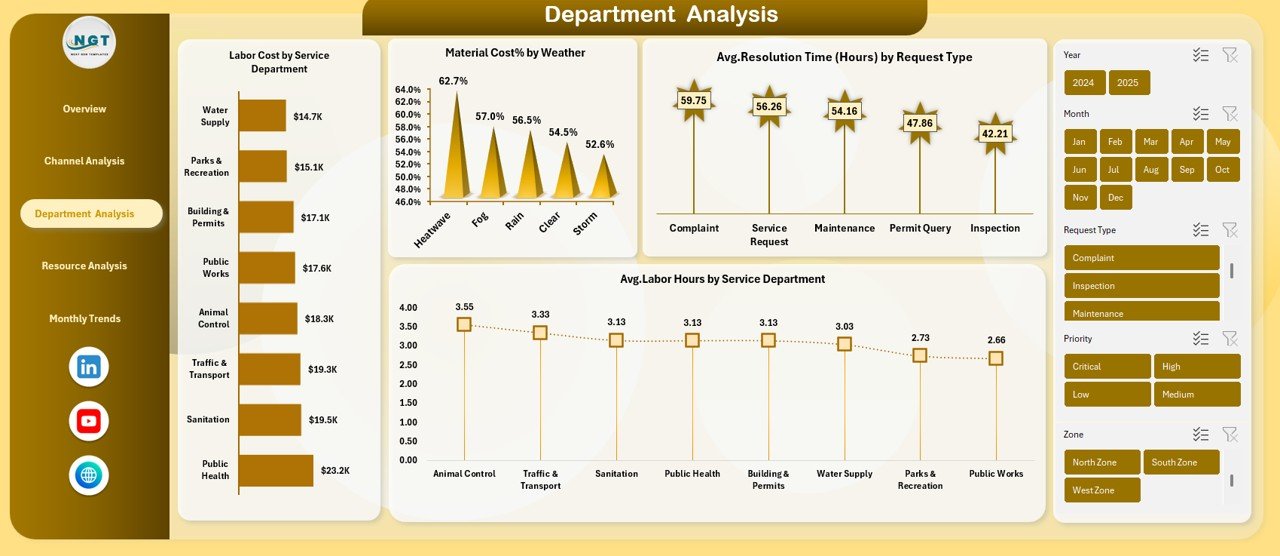
🎯 Department-Level Insights – Compare performance across service departments to identify inefficiencies and budget gaps.
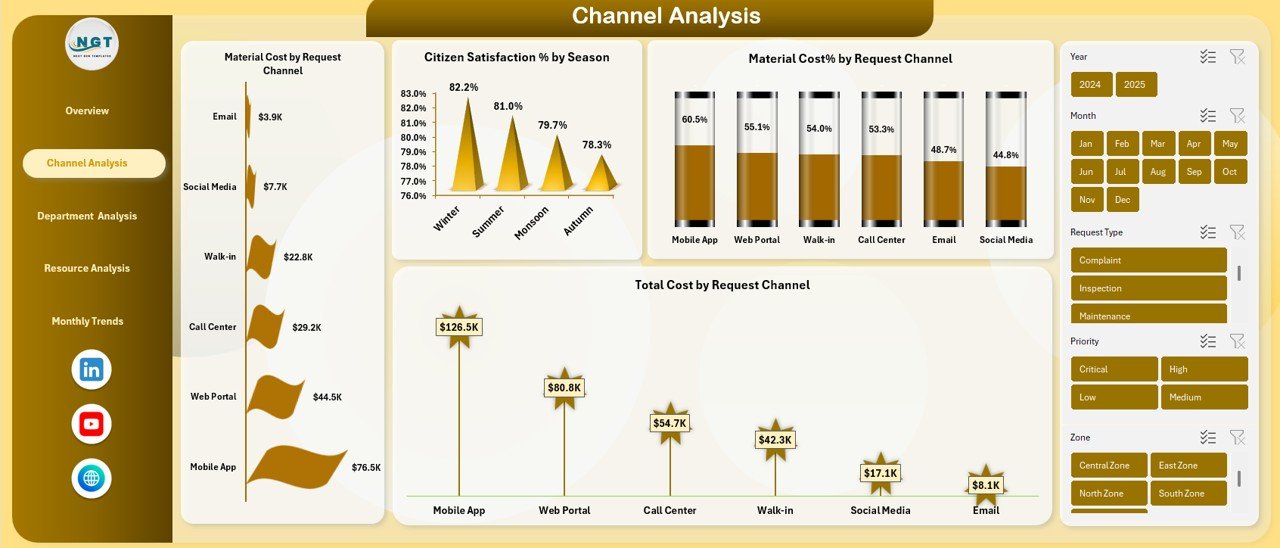
📞 Channel-Wise Analysis – Evaluate service requests by phone, app, email, or walk-in channels to improve citizen experience.
📅 Seasonal & Monthly Trends – Identify cost spikes, labor demand patterns, and resolution delays across months and seasons.
🛠️ Ready-to-Use Design – Pre-built charts, KPIs, and filters allow immediate usage without advanced Excel skills.
🔒 Offline & Secure – Use it offline with Excel’s built-in security options for sensitive municipal data.
📂 What’s Inside the Municipal Services Dashboard in Excel
📌 Overview Sheet
High-level KPI cards and summary charts for instant performance visibility.
📌 Channel Analysis Sheet
Analyze material cost, total cost, and citizen satisfaction by request channel and season.
📌 Department Analysis Sheet
Track labor cost, material cost %, resolution time, and labor hours by department.
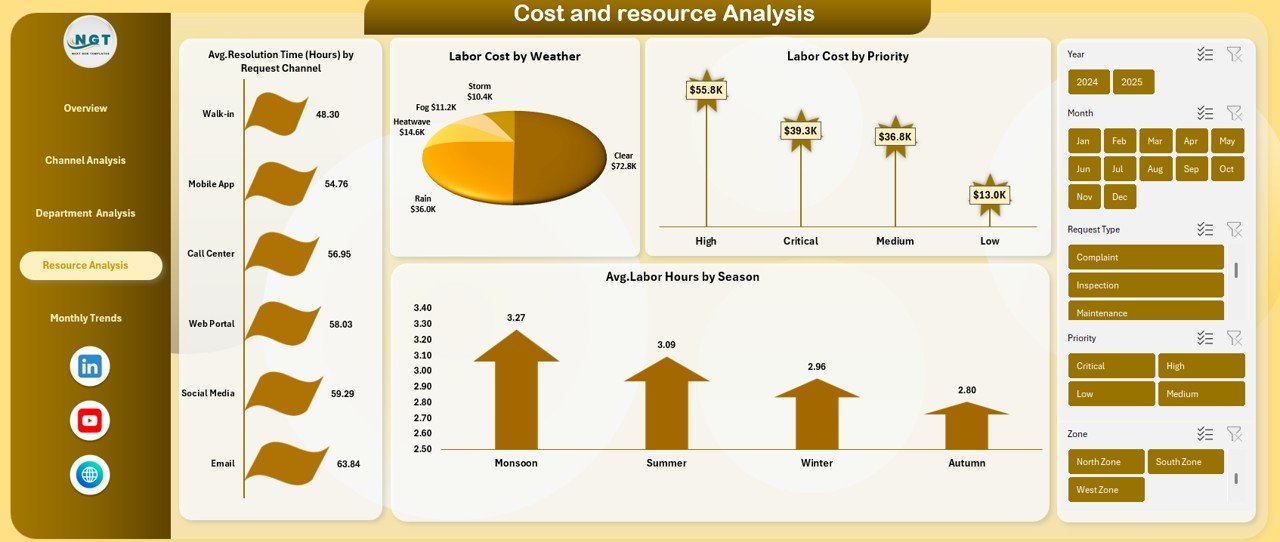
📌 Resource Analysis Sheet
Evaluate labor cost by priority and weather, resolution time by channel, and seasonal labor demand.
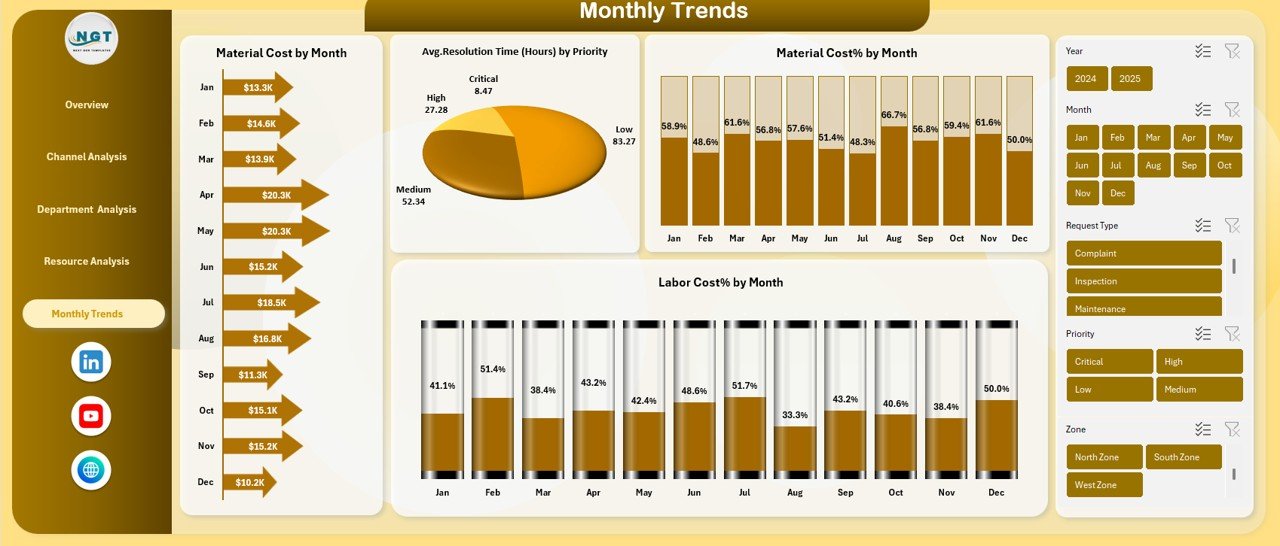
📌 Monthly Trends Sheet
Monitor monthly patterns for labor cost %, material cost %, and resolution efficiency.
Each sheet is thoughtfully designed to answer real operational questions faced by municipal leaders.
🧑💻 How to Use the Municipal Services Dashboard in Excel
🟢 Enter or paste your municipal service data into the structured data table.
🟢 Use slicers to filter results by department, channel, season, priority, or month.
🟢 Review KPI cards for instant performance summaries.
🟢 Analyze charts to identify cost drivers and inefficiencies.
🟢 Export or share reports directly from Excel with stakeholders.
No macros. No coding. Just plug in your data and start analyzing.
👥 Who Can Benefit from This Municipal Services Dashboard
🏛️ Municipal Commissioners & City Administrators
📋 Public Works & Utility Departments
📊 Finance & Budgeting Teams
🛠️ Operations & Maintenance Managers
🌆 Urban Planning & Smart City Teams
📞 Citizen Service & Complaint Handling Units
Whether you manage a small town or a large city, this dashboard scales effortlessly to your needs.


Reviews
There are no reviews yet.