Agri-biotechnology operates at the intersection of science, regulation, and commercial impact. From R&D investments and trial phases to regulatory approvals, vendors, crops, and profitability—every decision depends on accurate and timely data. However, when this information is scattered across multiple Excel files, emails, and reports, visibility disappears and strategic decisions slow down.
That is exactly why the Agri-Biotech Dashboard in Excel is a powerful and practical solution 🚀.
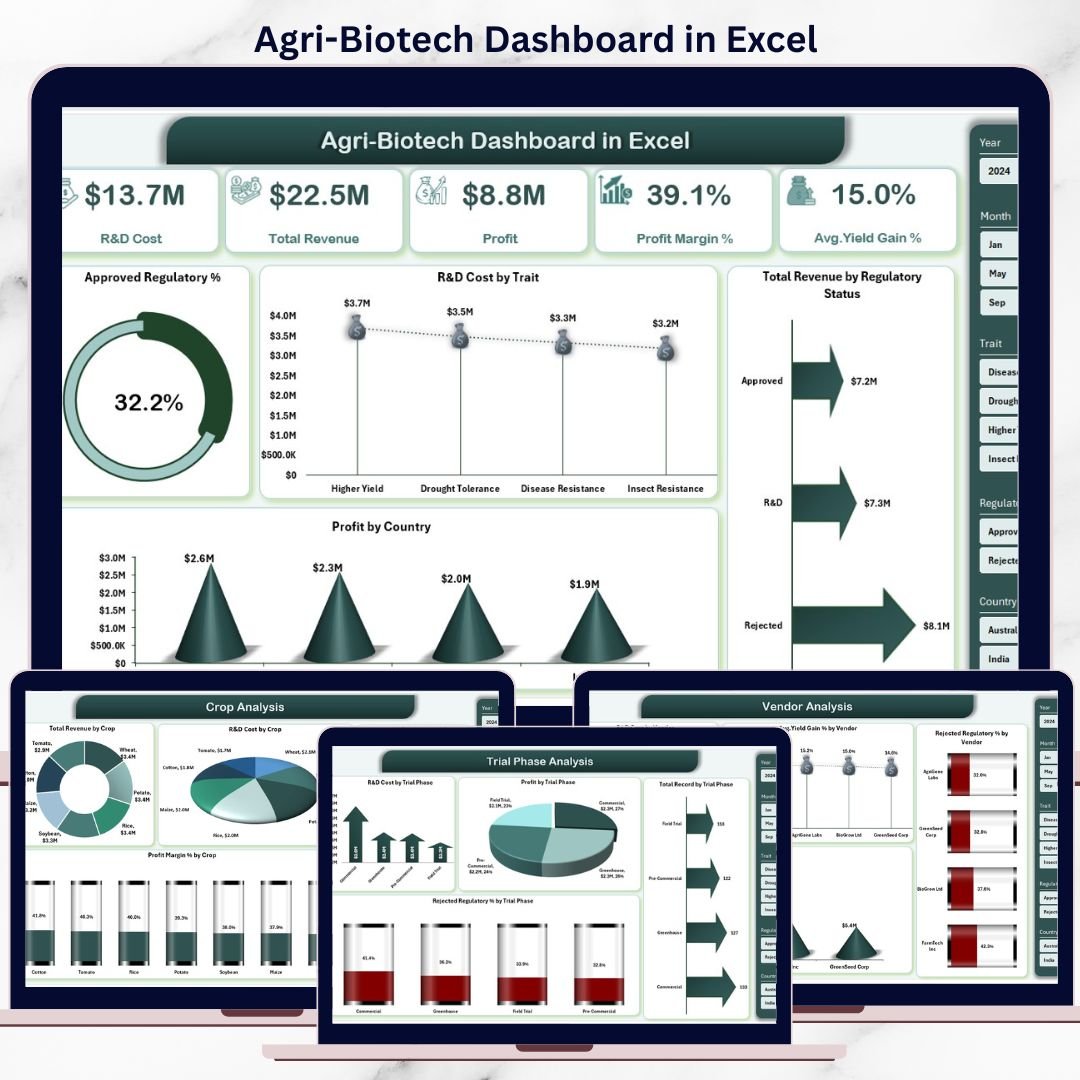
This ready-to-use Excel dashboard transforms complex agri-biotech data into clear KPIs, interactive charts, and actionable insights, enabling teams to monitor performance, control costs, and accelerate smarter decisions.
Designed for agri-biotech companies, seed and genetics firms, R&D leaders, and regulatory teams, this dashboard provides centralized visibility across research, trials, compliance, vendors, crops, and financial performance—all inside Excel, without expensive BI tools.
🔑 Key Features of Agri-Biotech Dashboard in Excel
📊 Centralized Biotech Performance Monitoring
Track R&D, regulatory, crop, vendor, and financial KPIs in one structured dashboard.
🧭 Page Navigator for Easy Access
Move between dashboard pages instantly using a built-in page navigator.
🎯 KPI Cards for Instant Insights
View critical KPIs like R&D Cost, Revenue, Profit, Profit Margin %, and Yield Gain % at a glance.
📅 Interactive Slicers
Filter analysis dynamically by crop, trial phase, vendor, country, month, and regulatory status.
📈 Trend-Based Analysis
Monitor monthly trends in cost, profit margin, and activity levels.
🧪 Trial & Regulatory Visibility
Track approval rates, rejection percentages, and phase-wise performance clearly.
⚡ 100% Excel-Based & Flexible
Built using pivot tables and charts—easy to customize and maintain.
📂 What’s Inside the Agri-Biotech Dashboard in Excel
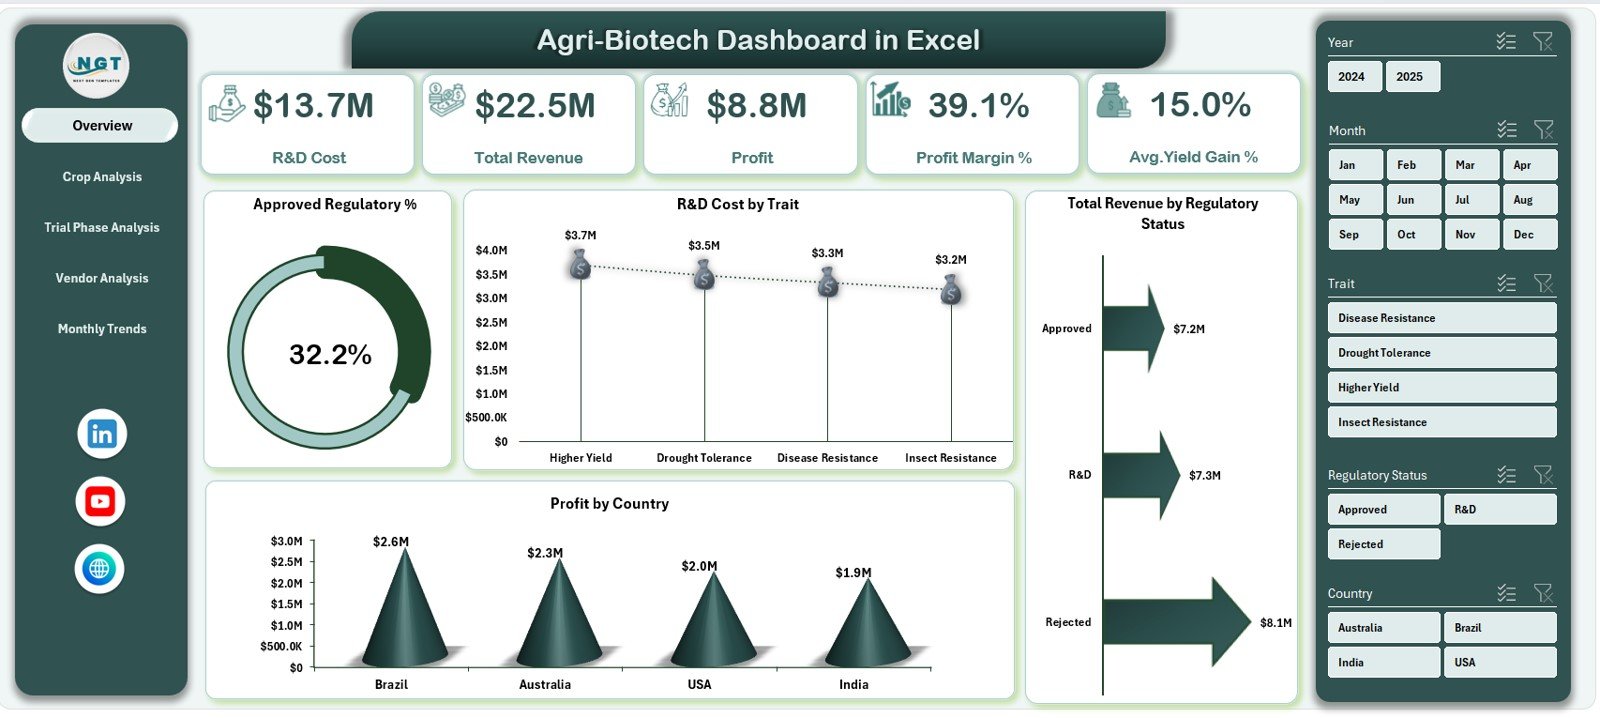
📌 Overview Page
The control center of the dashboard, summarizing financial and operational performance.
KPI Cards Display:
-
R&D Cost
-
Total Revenue
-
Profit
-
Profit Margin %
-
Average Yield Gain %
Charts Included:
-
Approved Regulatory %
-
R&D Cost by Trait
-
Total Revenue by Regulatory Status
-
Profit by Country
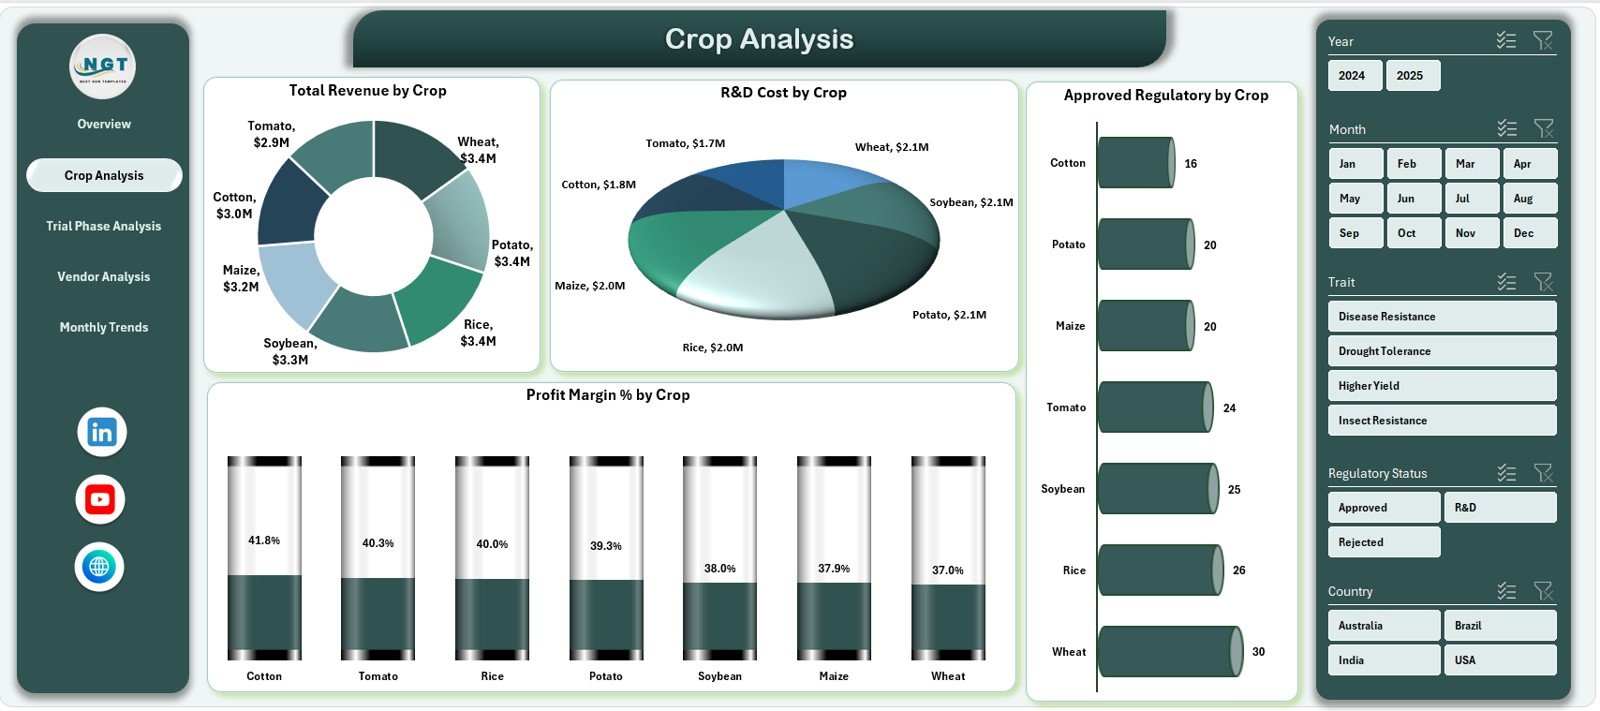
📊 Crop Analysis Page
Analyze crop-wise performance across revenue, cost, compliance, and profitability.
Charts Included:
-
Total Revenue by Crop
-
R&D Cost by Crop
-
Approved Regulatory % by Crop
-
Profit Margin % by Crop
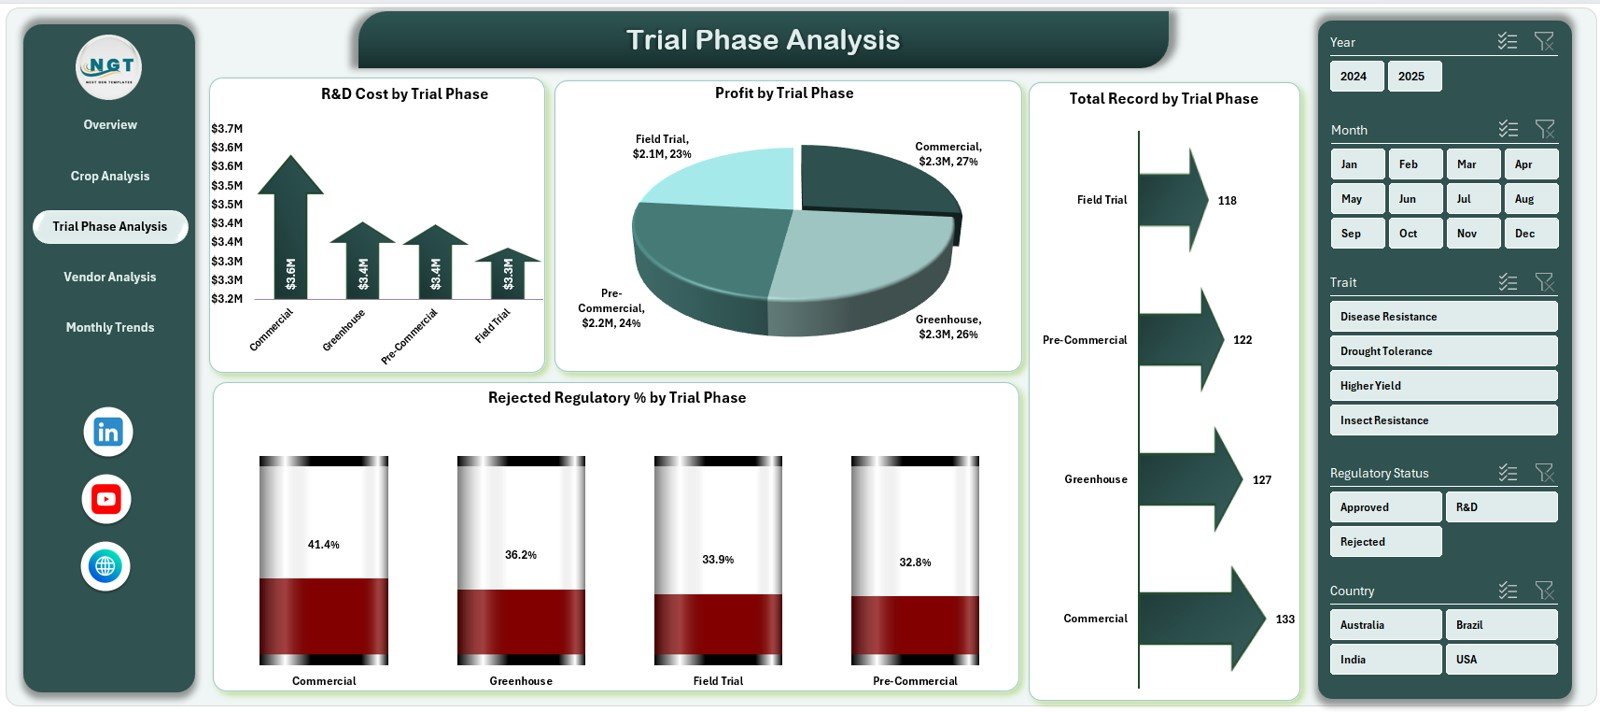
📊 Trial Phase Analysis Page
Evaluate performance across different trial stages.
Charts Included:
-
R&D Cost by Trial Phase
-
Profit by Trial Phase
-
Total Records by Trial Phase
-
Rejected Regulatory % by Trial Phase
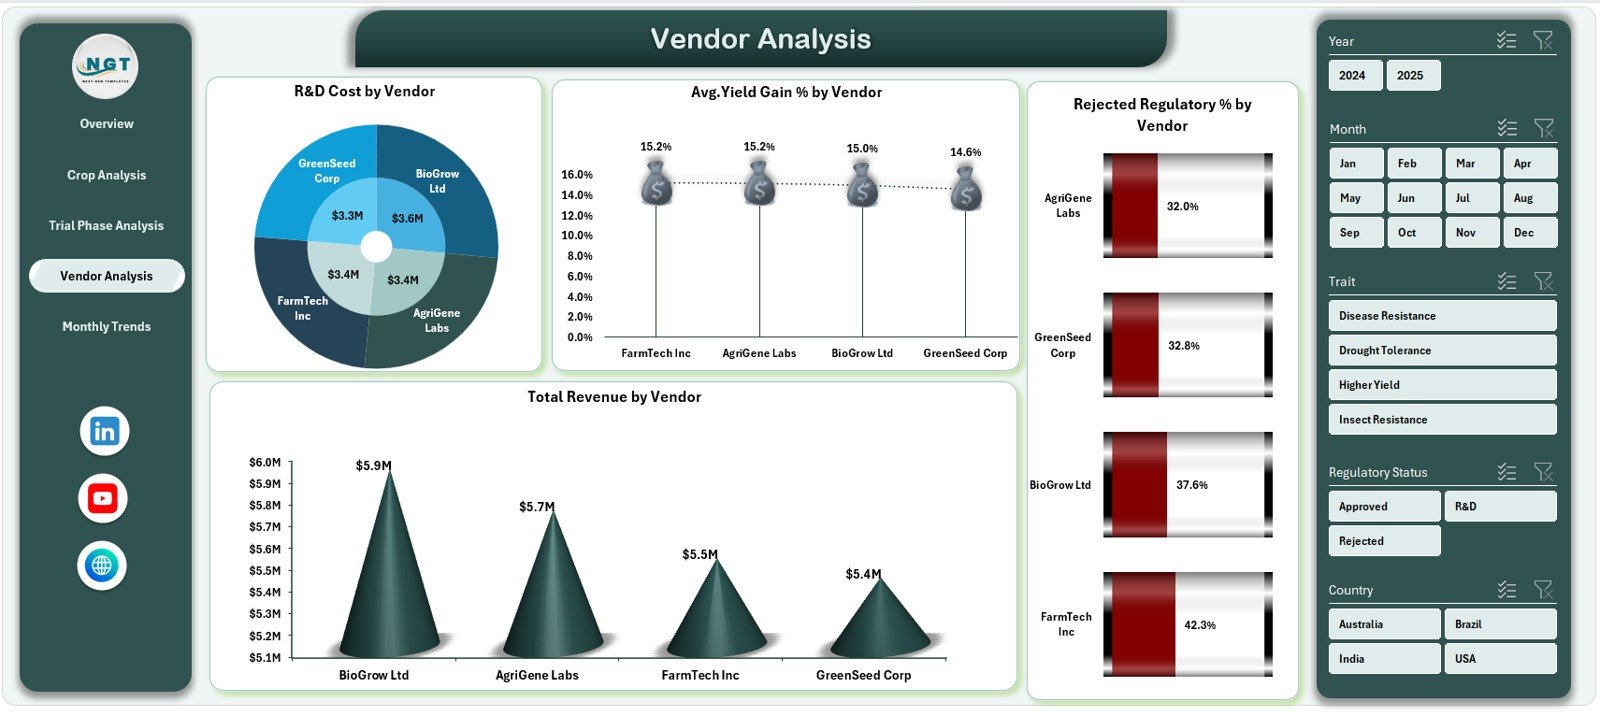
📊 Vendor Analysis Page
Measure vendor contribution and risk objectively.
Charts Included:
-
R&D Cost by Vendor
-
Average Yield Gain % by Vendor
-
Rejected Regulatory % by Vendor
-
Total Revenue by Vendor
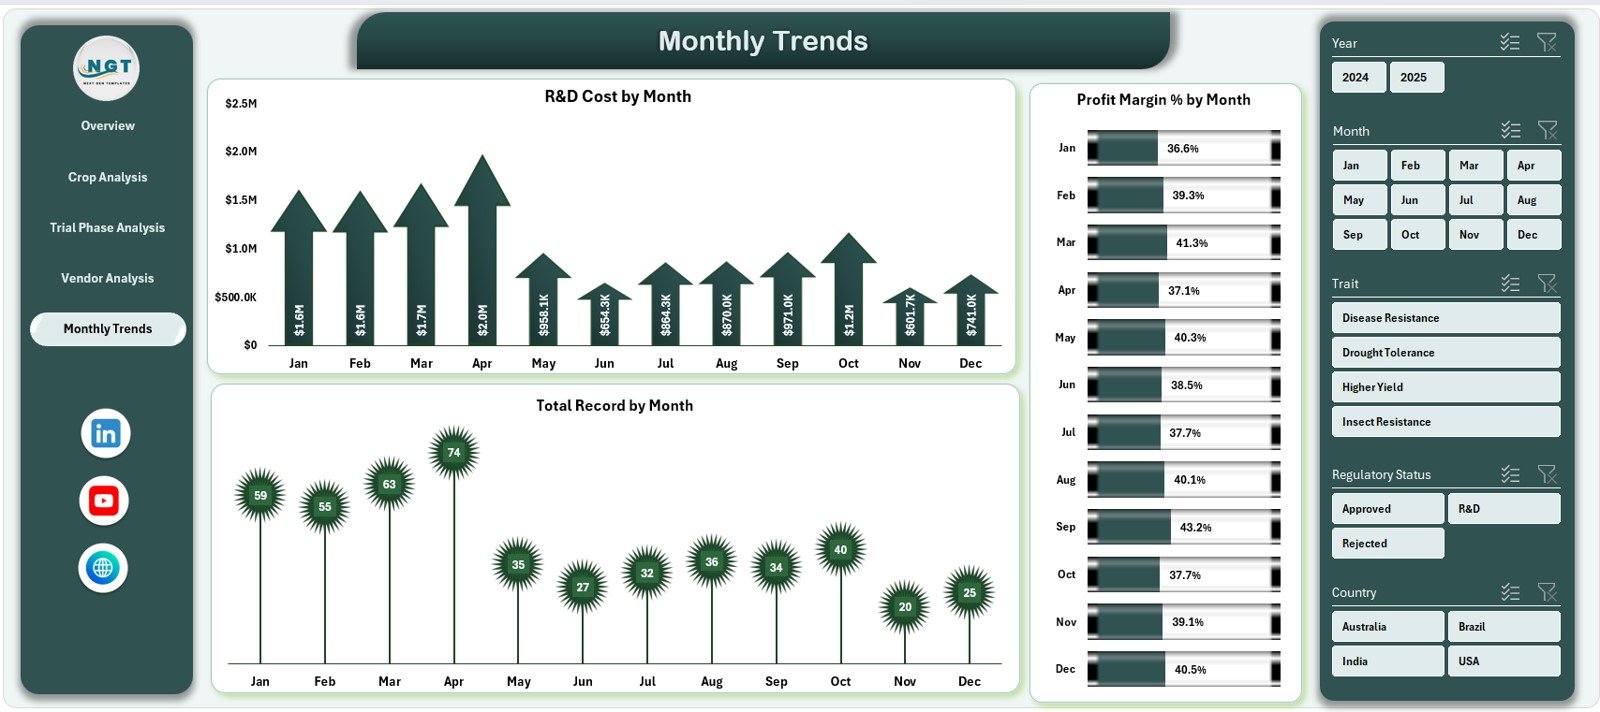
📊 Monthly Trends Page
Understand performance changes over time.
Charts Included:
-
R&D Cost by Month
-
Profit Margin % by Month
-
Total Records by Month
📄 Data Sheet & Support Sheet
Structured transactional data, lookup tables, and KPI logic to power smooth pivot analysis.
⚙️ How to Use the Agri-Biotech Dashboard in Excel
📝 Step 1: Enter or Update Data
Add new records in the Data Sheet for crops, trials, vendors, costs, and outcomes.
🔄 Step 2: Refresh Pivot Tables
Refresh pivots to update all KPIs and charts instantly.
📊 Step 3: Use Slicers & Navigator
Filter insights by crop, phase, vendor, or month and switch pages effortlessly.
📈 Step 4: Analyze Trends & KPIs
Identify high-cost areas, profitable crops, and regulatory risks.
🎯 Step 5: Make Strategic Decisions
Optimize R&D spend, vendor selection, and trial planning with confidence.
👥 Who Can Benefit from This Agri-Biotech Dashboard in Excel
🌱 Agri-Biotech Companies – Gain full visibility into biotech operations
🧪 R&D Managers – Optimize trials, costs, and phase efficiency
📜 Regulatory & Compliance Teams – Track approvals and rejection trends
💰 Finance & Controllers – Monitor cost, revenue, and profitability
📊 Strategy & Leadership Teams – Drive data-backed planning and growth
🔍 Click here to read the Detailed blog post
📺 Visit our YouTube channel to learn step-by-step video tutorials
👉 Youtube.com/@PKAnExcelExpert


Reviews
There are no reviews yet.