Smart city initiatives involve large public budgets, multiple stakeholders, strict compliance rules, and high public accountability. Every infrastructure upgrade, IT implementation, transportation project, or utility expansion begins with a tender. Therefore, monitoring tender performance accurately is not optional—it is essential.
Smart Cities Tender Dashboard in Power BI However, when tender data stays scattered across Excel files, PDFs, emails, and departmental systems, decision-makers lose visibility. As a result, budget overruns increase, vendor performance becomes unclear, and governance risks grow.
Smart Cities Tender Dashboard in Power BI That is exactly where the Smart Cities Tender Dashboard in Power BI becomes a powerful, modern, and decision-ready solution.
This professionally designed Power BI dashboard converts raw tender data into interactive KPIs, visuals, and trends. Instead of reacting late, smart city authorities gain real-time insights, transparency, and confidence across the complete tender lifecycle.
🚀 Key Features of Smart Cities Tender Dashboard in Power BI
✨ Centralized Tender Monitoring
Track all smart city tenders in one Power BI dashboard instead of managing multiple disconnected reports.
📊 Executive KPI Cards
Instantly view total budget, contract value, average project progress, tender count, and published percentage.
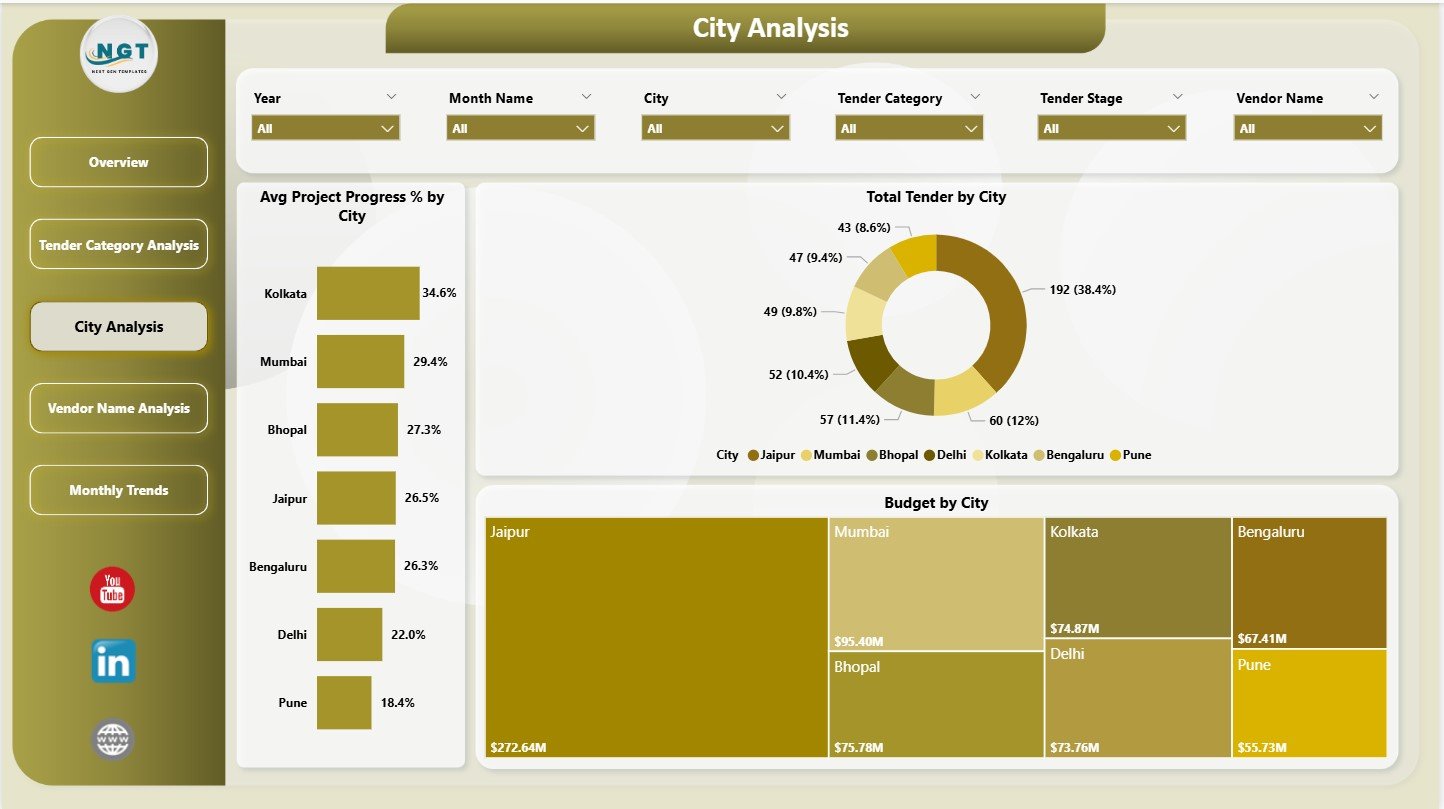
🏙️ City-Wise Tender Analysis
Compare budgets, tender volume, and project progress across different cities.
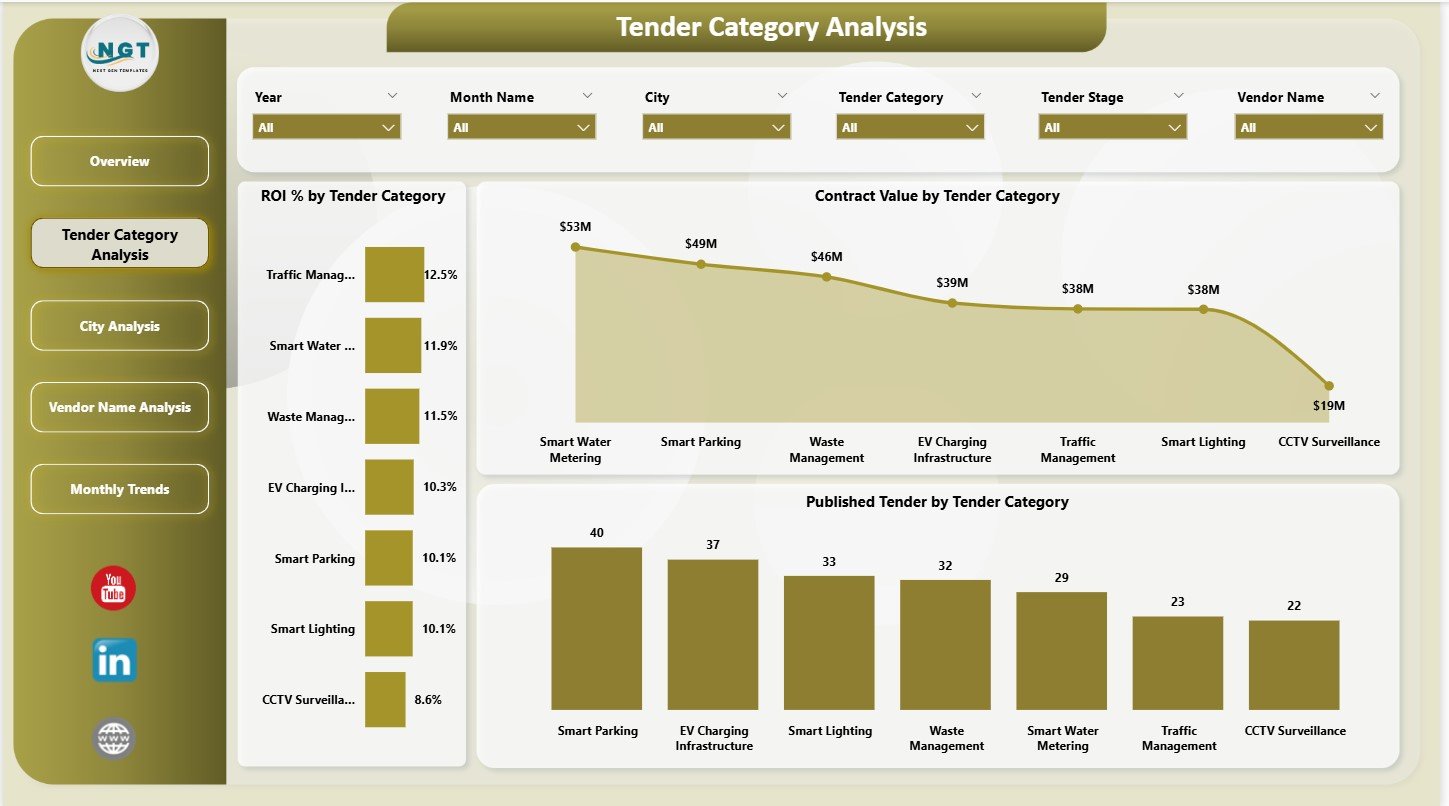
📁 Category-Wise Performance Tracking
Analyze ROI, contract value, and tender distribution across infrastructure, IT, utilities, transport, and services.
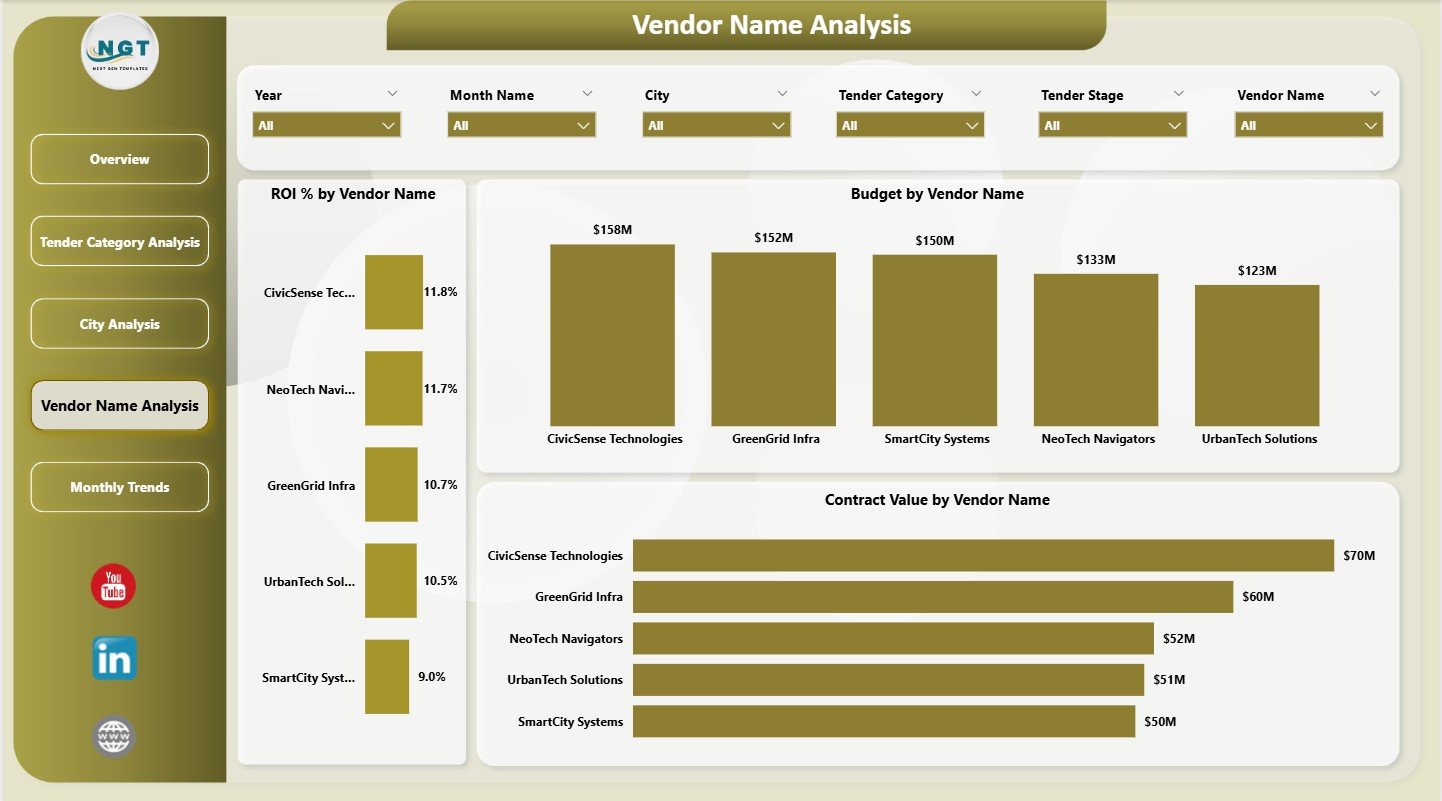
🤝 Vendor Performance Insights
Evaluate vendor ROI, contract value, and workload to support better vendor selection and negotiations.
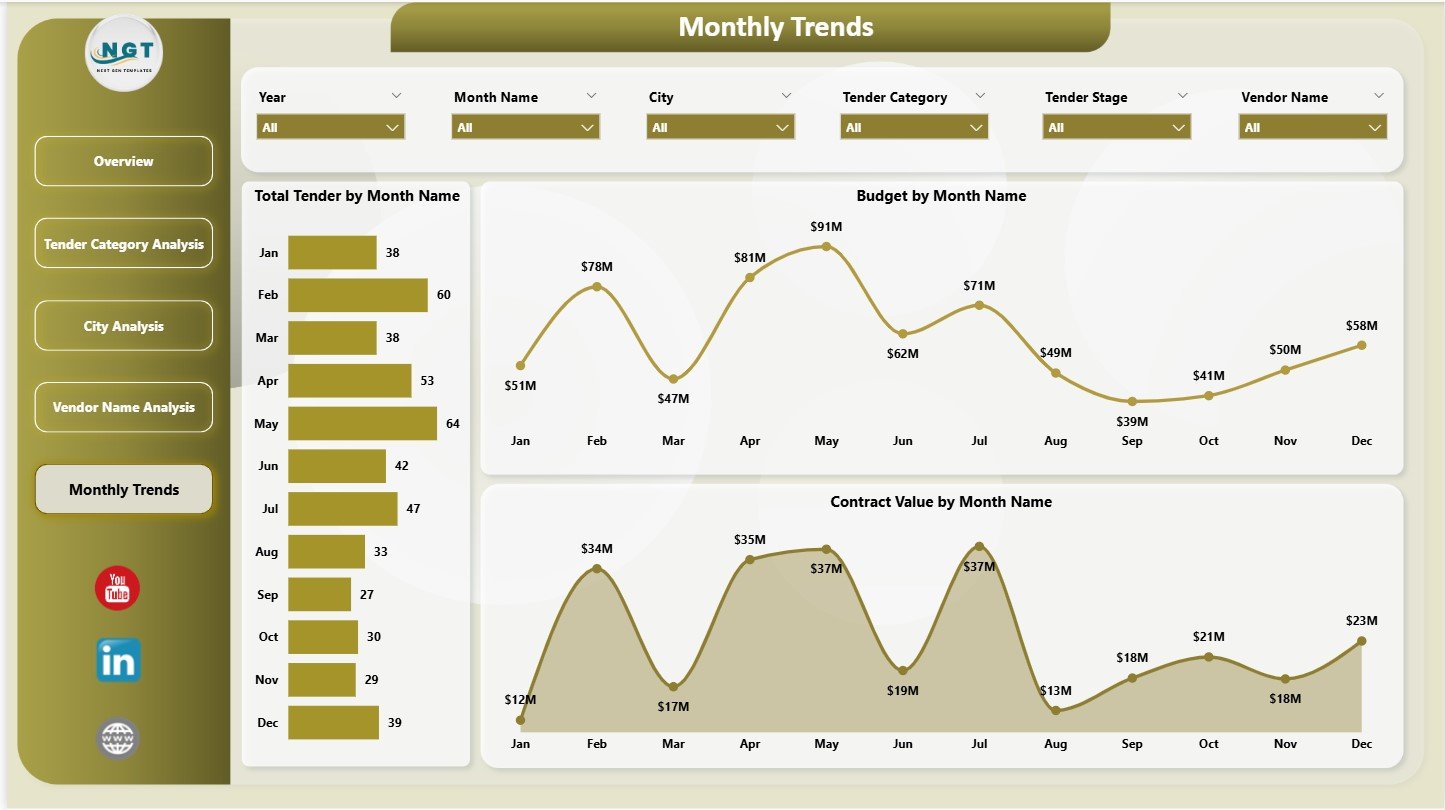
📈 Monthly Trend Analysis
Track how tenders, budgets, and contract values change month by month.
🎛️ Interactive Filters & Slicers
Slice data instantly by city, category, vendor, or time period for deep analysis.
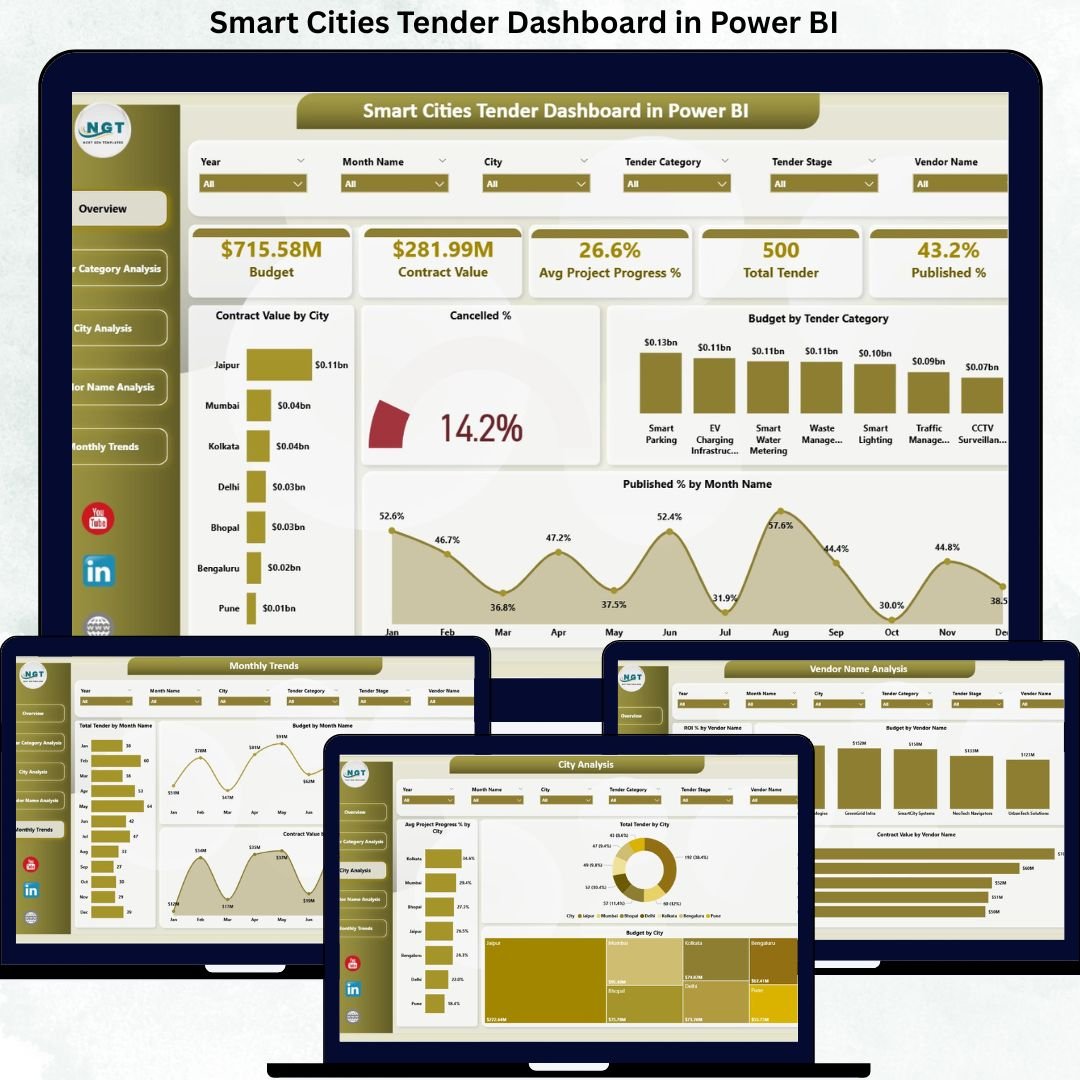
📂 What’s Inside the Smart Cities Tender Dashboard in Power BI?
This ready-to-use Power BI solution includes 5 fully interactive analytical pages:
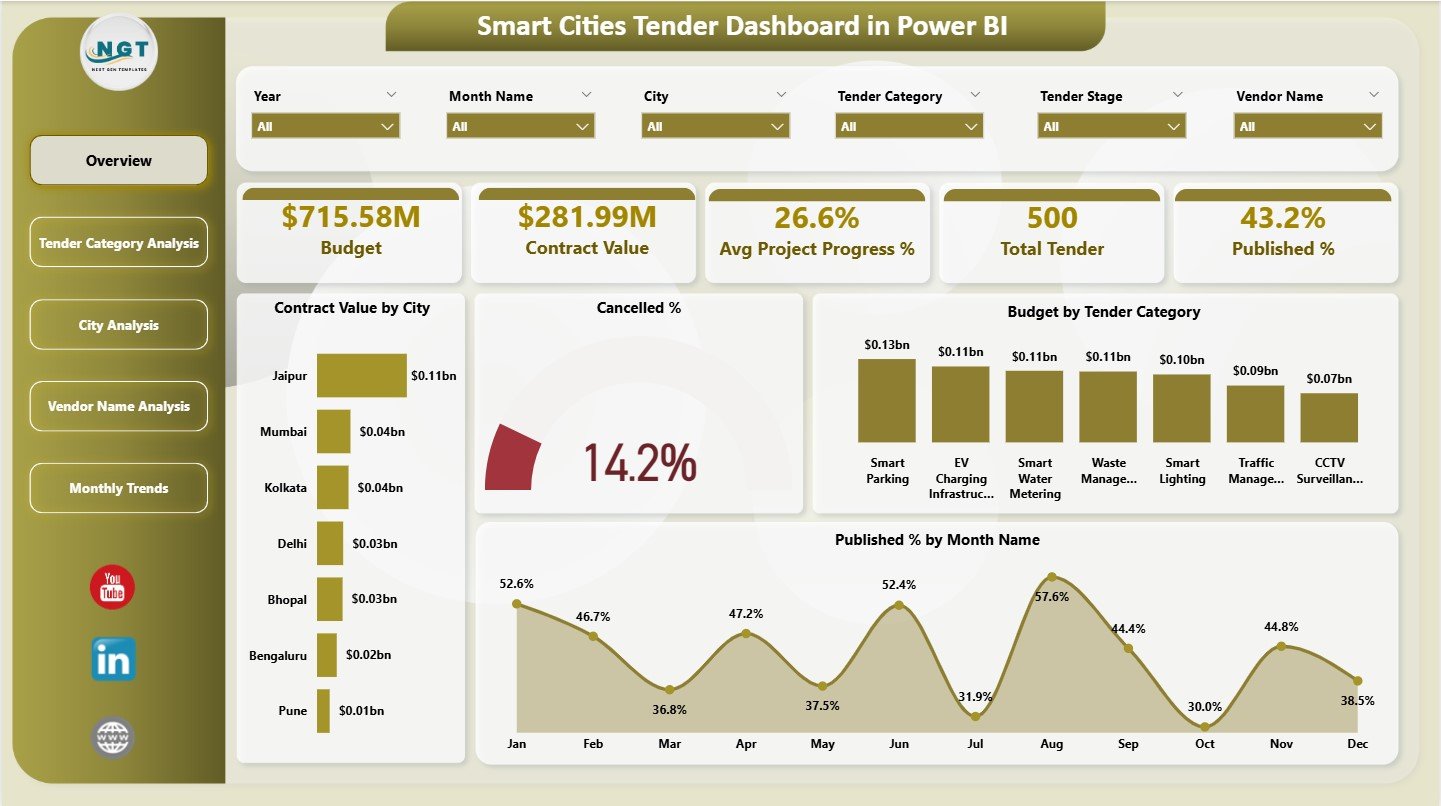
📌 Overview Page – High-level snapshot of tender performance
📌 Tender Category Analysis – ROI and value by tender category
📌 City Analysis – City-wise budget, progress, and tender volume
📌 Vendor Name Analysis – Vendor ROI, budget, and contract value
📌 Monthly Trends – Time-based analysis of tenders, budgets, and awards
All visuals are designed for clarity, governance, and executive reporting.
🛠️ How to Use the Smart Cities Tender Dashboard in Power BI
1️⃣ Maintain tender data in Excel, database, or procurement system
2️⃣ Connect the data source to Power BI
3️⃣ Refresh the dashboard to update KPIs and visuals
4️⃣ Use slicers to filter by city, vendor, category, or month
5️⃣ Analyze trends, identify risks, and support data-driven decisions
No advanced Power BI expertise is required to use and interpret the dashboard.
👥 Who Can Benefit from This Smart Cities Tender Dashboard?
🏛️ Smart City Authorities & Municipal Corporations
📑 Government Procurement & Tender Committees
💼 Finance & Audit Departments
📊 Project Management Offices (PMO)
🏗️ Urban Planning & Infrastructure Teams
👨💼 Senior Government Officials & Decision-Makers
If transparency, accountability, and performance tracking matter, this dashboard is built for you.
📖 Click here to read the Detailed Blog Post
🎥 Visit our YouTube channel to learn step-by-step video tutorials
👉 Youtube.com/@PKAnExcelExpert


Reviews
There are no reviews yet.