Modern smart cities operate under constant pressure to deliver financial transparency, operational efficiency, and fast decision-making. Every purchasing decision directly affects public budgets, service quality, and citizen trust. However, when purchasing data remains scattered across spreadsheets and static reports, visibility disappears, costs rise, and accountability weakens.
That is exactly why the Smart Cities Purchasing Dashboard in Power BI becomes an essential analytics solution 🚀
This powerful and ready-to-use Power BI dashboard transforms raw purchasing data into real-time KPIs, interactive visuals, and actionable insights. As a result, city administrators gain complete control over purchasing performance—without manual reporting or guesswork.
Designed specifically for smart city environments, this dashboard supports data-driven governance, stronger vendor control, and confident purchasing decisions.
Key Features of Smart Cities Purchasing Dashboard in Power BI 🔑
📊 Centralized City-Wide Purchasing Visibility
Monitor all purchasing data across departments, vendors, categories, and cities in one interactive dashboard.
💰 Planned vs Actual Cost Tracking
Instantly identify overspending, savings opportunities, and budget deviations.
📦 Pending Order Monitoring
Track pending order percentages and prevent procurement backlogs.
🏢 Department-Wise Cost Analysis
Compare purchasing performance across city departments.
🤝 Vendor Performance Insights
Evaluate vendors based on planned cost, actual cost, and cost variance.
📅 Monthly Trend Analysis
Detect spending trends early and improve future budget forecasting.
🧭 Interactive Slicers & Drill-Downs
Filter data by city, department, vendor, category, or month in seconds.
What’s Inside the Smart Cities Purchasing Dashboard in Power BI 📁
This dashboard includes five professionally designed analytical pages, each answering a critical purchasing question.
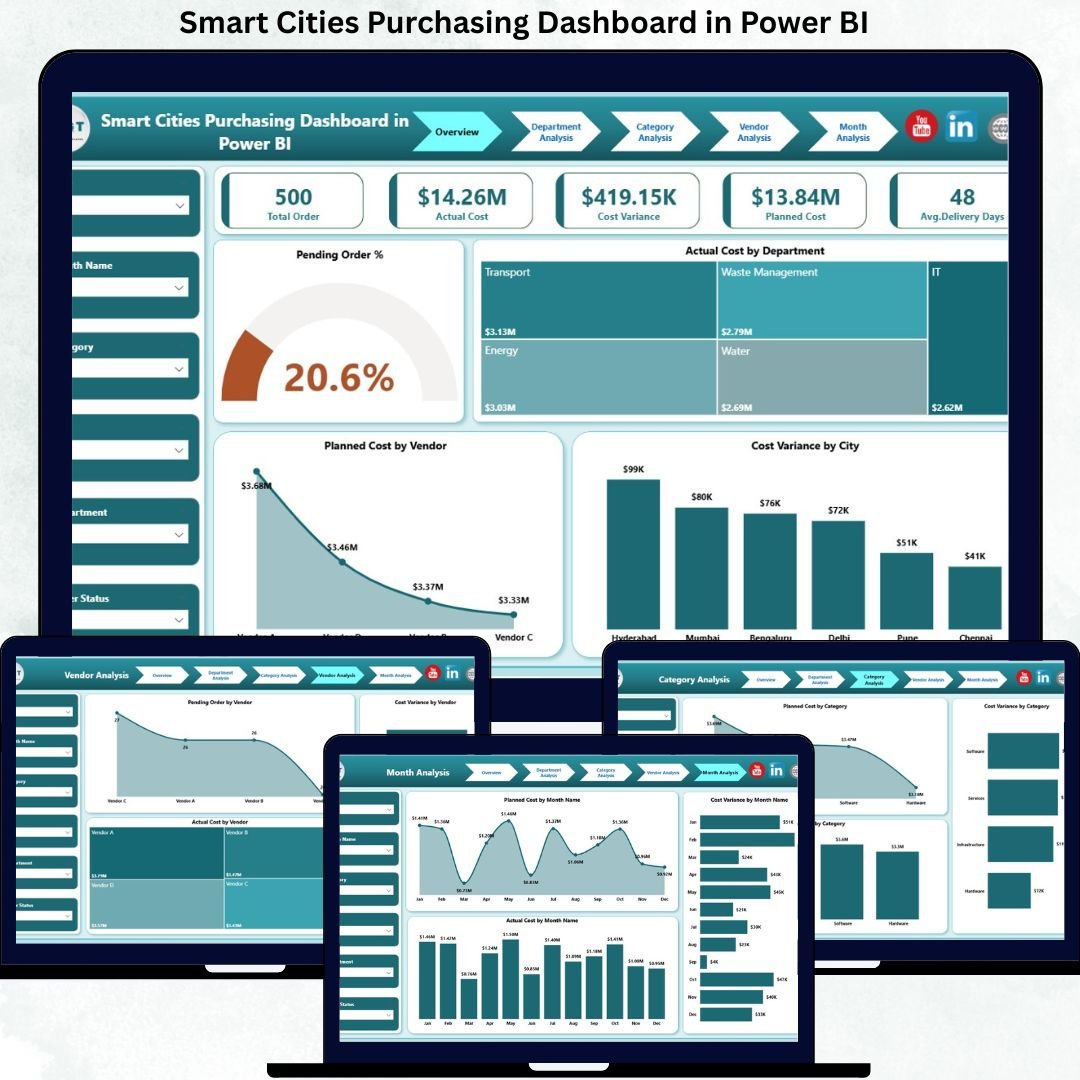
📄 Overview Page
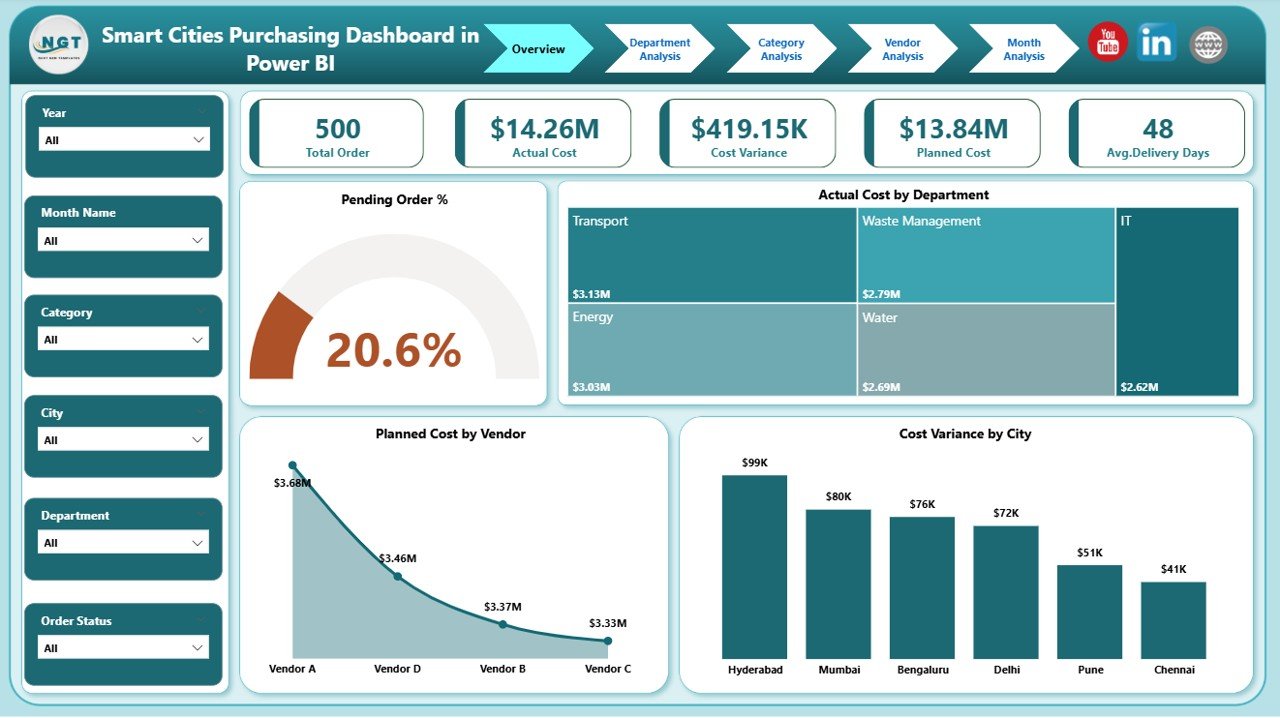
The executive snapshot for city leadership.
Includes:
-
Slicers: City, Department, Vendor, Category, Month
-
KPI Cards:
-
Pending Order %
-
Total Planned Cost
-
Total Actual Cost
-
Total Cost Variance
-
-
Visuals:
-
Pending Order %
-
Actual Cost by Department
-
Planned Cost by Vendor
-
Cost Variance by City
-
This page delivers instant clarity on overall purchasing health.
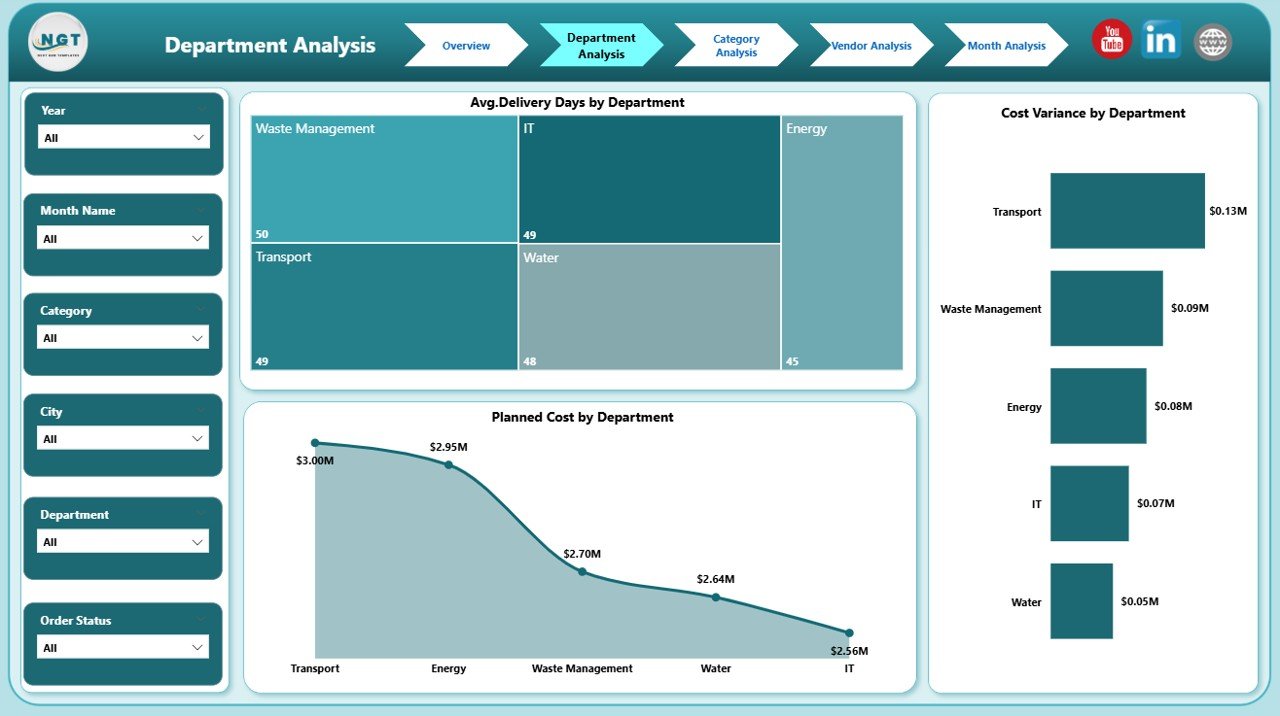
📄 Department Analysis Page
Evaluates purchasing behavior across departments.
Includes:
-
Average Delivery Days by Department
-
Cost Variance by Department
-
Planned Cost by Department
Helps identify departments causing delays or budget overruns.
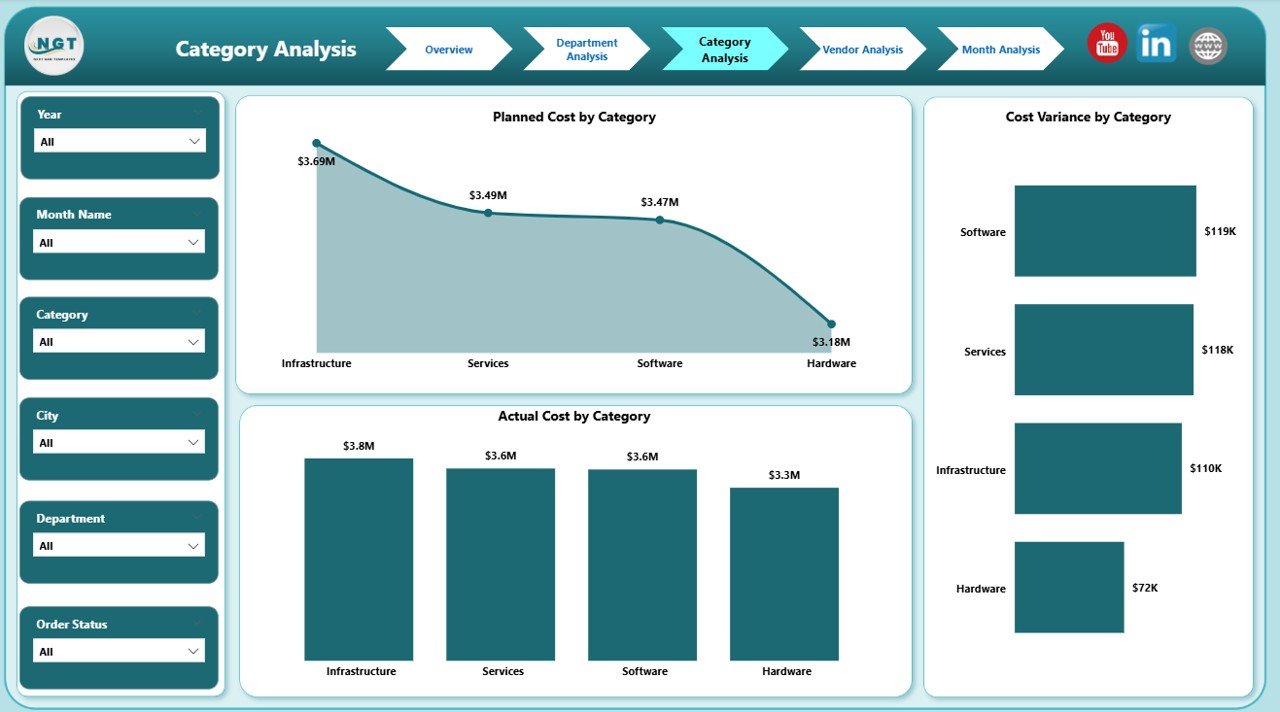
📄 Category Analysis Page
Breaks down purchasing performance by category.
Includes:
-
Planned Cost by Category
-
Actual Cost by Category
-
Cost Variance by Category
Supports category-level optimization and cost control.
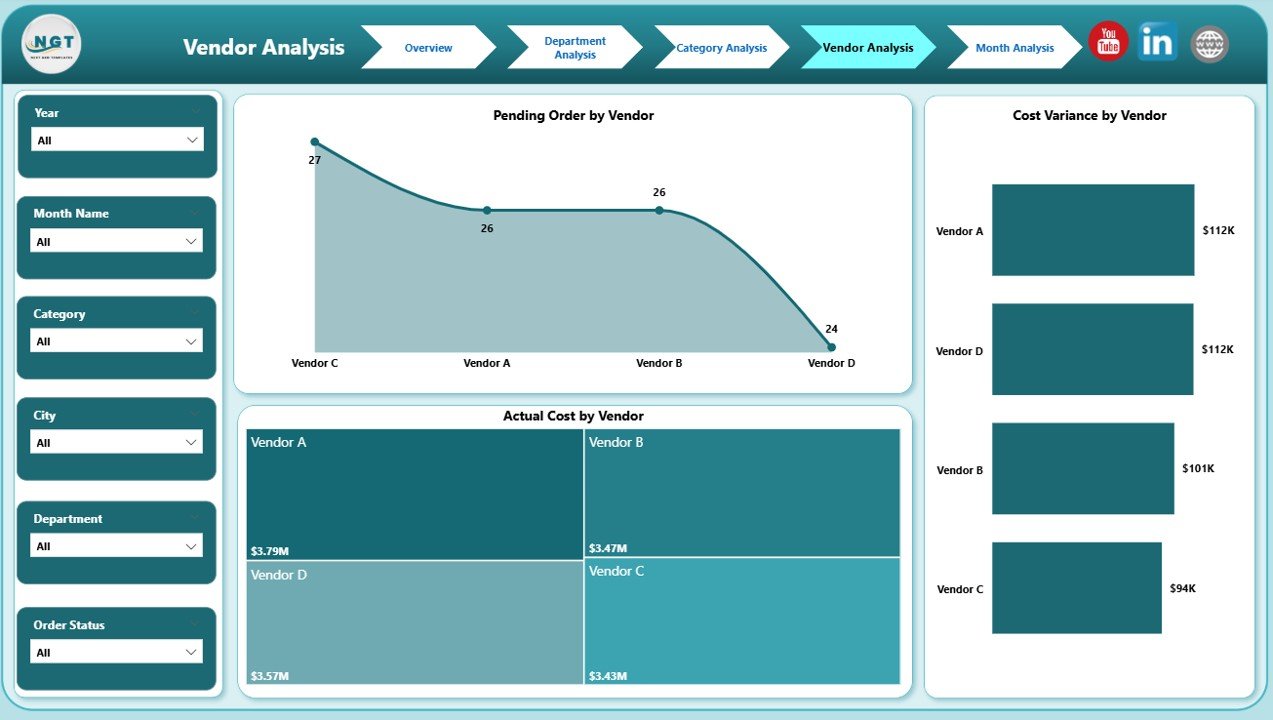
📄 Vendor Analysis Page
Focuses on supplier performance and spending impact.
Includes:
-
Planned Cost by Vendor
-
Actual Cost by Vendor
-
Cost Variance by Vendor
Strengthens vendor negotiations and contract decisions.
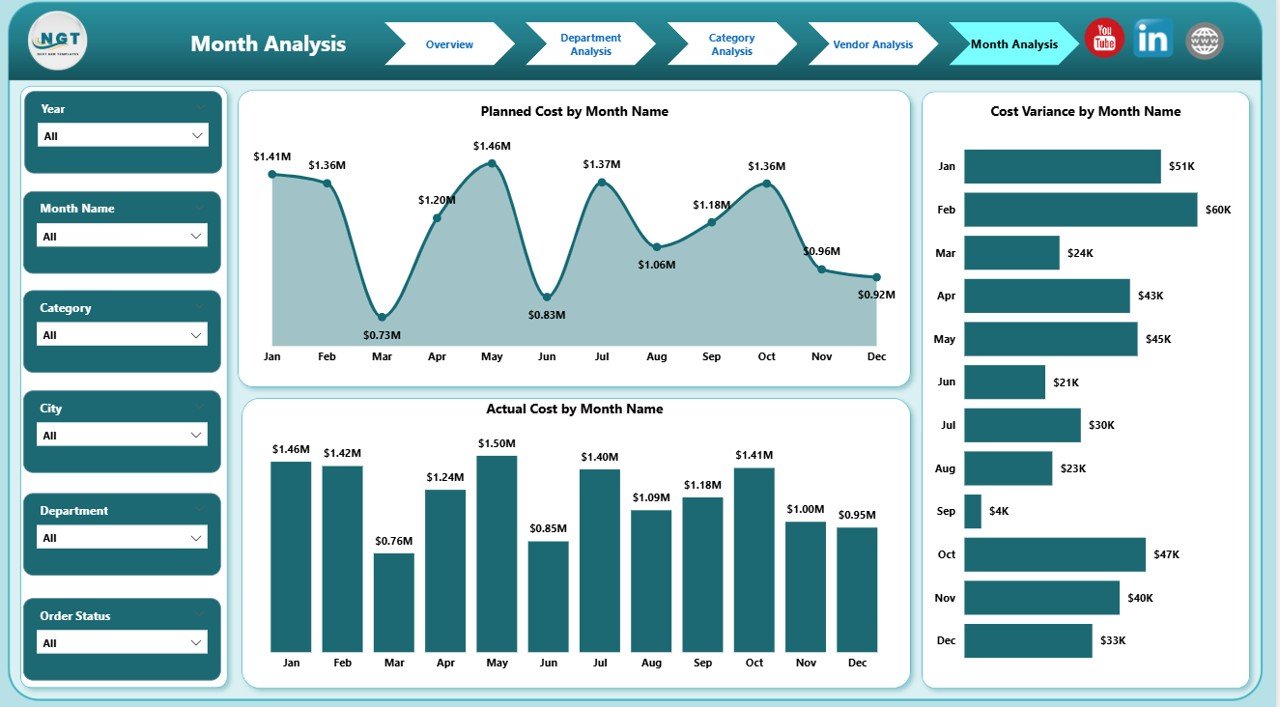
📄 Monthly Trends Page
Tracks purchasing behavior over time.
Includes:
-
Planned Cost by Month
-
Actual Cost by Month
-
Cost Variance by Month
Enables proactive budgeting and trend-based planning.
How to Use the Smart Cities Purchasing Dashboard in Power BI 🛠️
1️⃣ Connect your Excel, ERP, or database purchasing data
2️⃣ Refresh the Power BI dataset
3️⃣ Use slicers to filter by city, department, vendor, or month
4️⃣ Analyze KPIs, cost variance, and trends
5️⃣ Use insights for governance reviews, audits, and planning
No manual calculations. No static reports. Just insights.
Who Can Benefit from This Smart Cities Purchasing Dashboard 👥
🏙️ City Procurement Departments – Improve control and visibility
💰 Finance & Budget Teams – Strengthen cost governance
📊 Urban Planning Authorities – Support data-driven purchasing
🤝 Vendor Management Teams – Optimize supplier performance
🧑💼 City Leadership & Administrators – Enable confident decisions
Perfect for both mid-size cities and large smart city programs.
### Click here to read the Detailed blog post
Visit our YouTube channel to learn step-by-step video tutorials


Reviews
There are no reviews yet.