Electricity projects are capital-intensive, time-critical, and highly sensitive to cost overruns and delays. Electricity Project Management in Excel Whether you are managing power generation projects, transmission upgrades, substations, renewable installations, or utility infrastructure expansion, even a small deviation in budget or schedule can create serious risks. However, many organizations still rely on scattered spreadsheets, emails, and manual reports, which reduce visibility and slow down decisions.
That is exactly why Electricity Project Management in Excel becomes a powerful and practical solution.
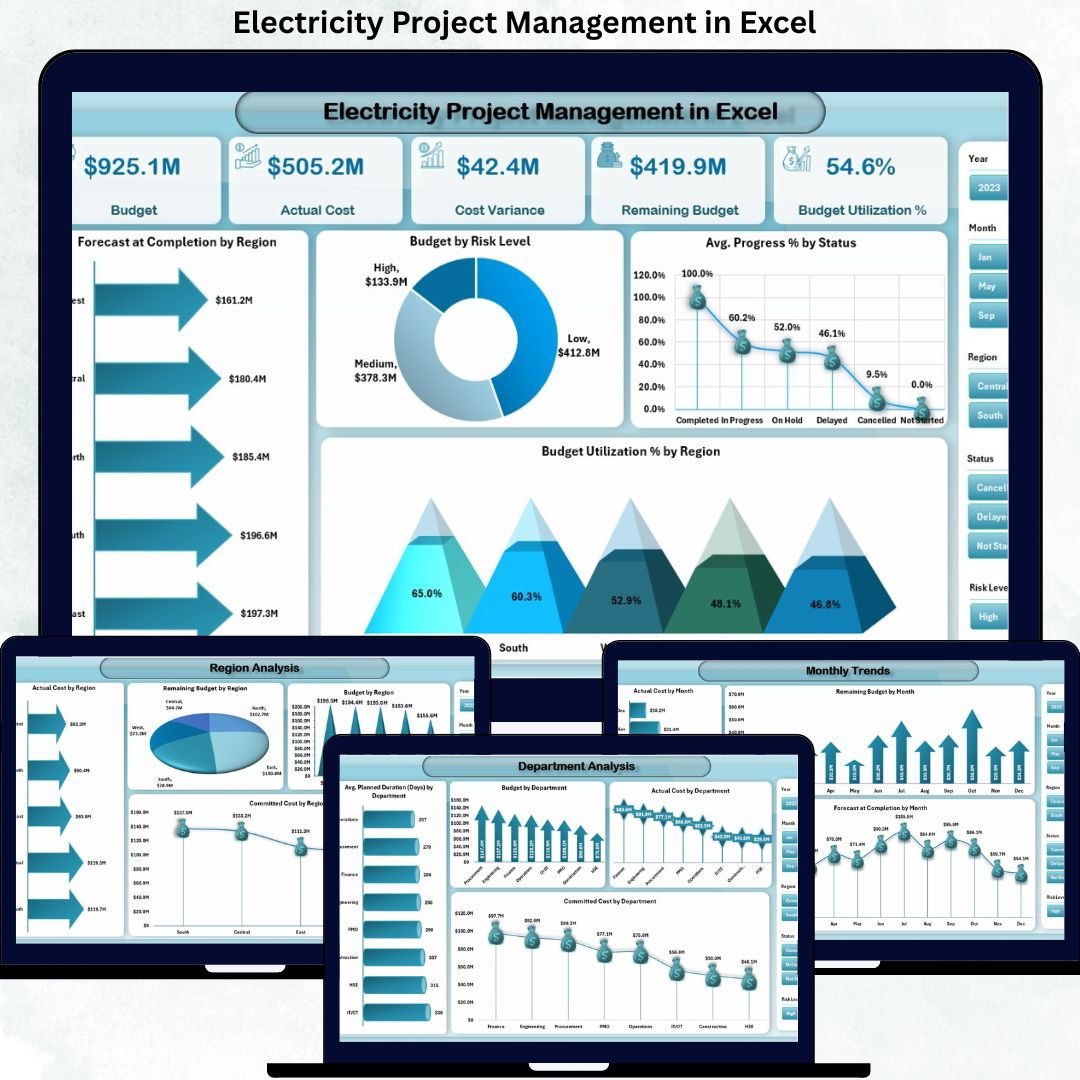
Electricity Project Management in Excel This ready-to-use Excel dashboard converts complex electricity project data into clear KPIs, interactive visuals, and decision-ready insights. Instead of tracking budgets, costs, risks, and progress across multiple files, project managers and leadership teams get one centralized Excel dashboard that shows exactly where projects stand, where risks exist, and what actions are required. As a result, teams move from reactive firefighting to proactive project control.
🔑 Key Features of Electricity Project Management in Excel
⚡ Centralized Project Visibility
Manage all electricity projects from a single, structured Excel dashboard.
💰 Budget, Cost & Variance Tracking
Track approved budget, actual cost, cost variance, and remaining budget instantly.
📊 Project Progress Monitoring
Monitor progress % and forecast completion across projects.
🛡️ Risk-Based Project Analysis
Identify high-risk projects early using risk-level insights.
🏢 Department-Wise Performance Analysis
Compare budget, cost, and duration across departments.
🌍 Region & Utility / Client Insights
Analyze performance by region and utility/client.
📅 Monthly Trend Analysis
Track cost, remaining budget, and forecast trends over time.
🧭 Page Navigator for Smooth Navigation
Move between dashboard pages instantly during reviews and presentations.
⚙️ 100% Excel-Based & Customizable
No macros, no expensive software—easy to modify and extend.
📦 What’s Inside the Electricity Project Management in Excel Dashboard
This professionally designed dashboard includes five powerful analytical pages, supported by structured backend sheets.
📊 Overview Page

Acts as the executive control panel with KPI cards for:
-
Budget
-
Actual Cost
-
Cost Variance
-
Remaining Budget
-
Budget Utilization %
Includes charts for:
-
Forecast Completion by Region
-
Budget by Risk Level
-
Average Progress % by Status
-
Budget Utilization % by region
This page instantly highlights problem areas and healthy projects.
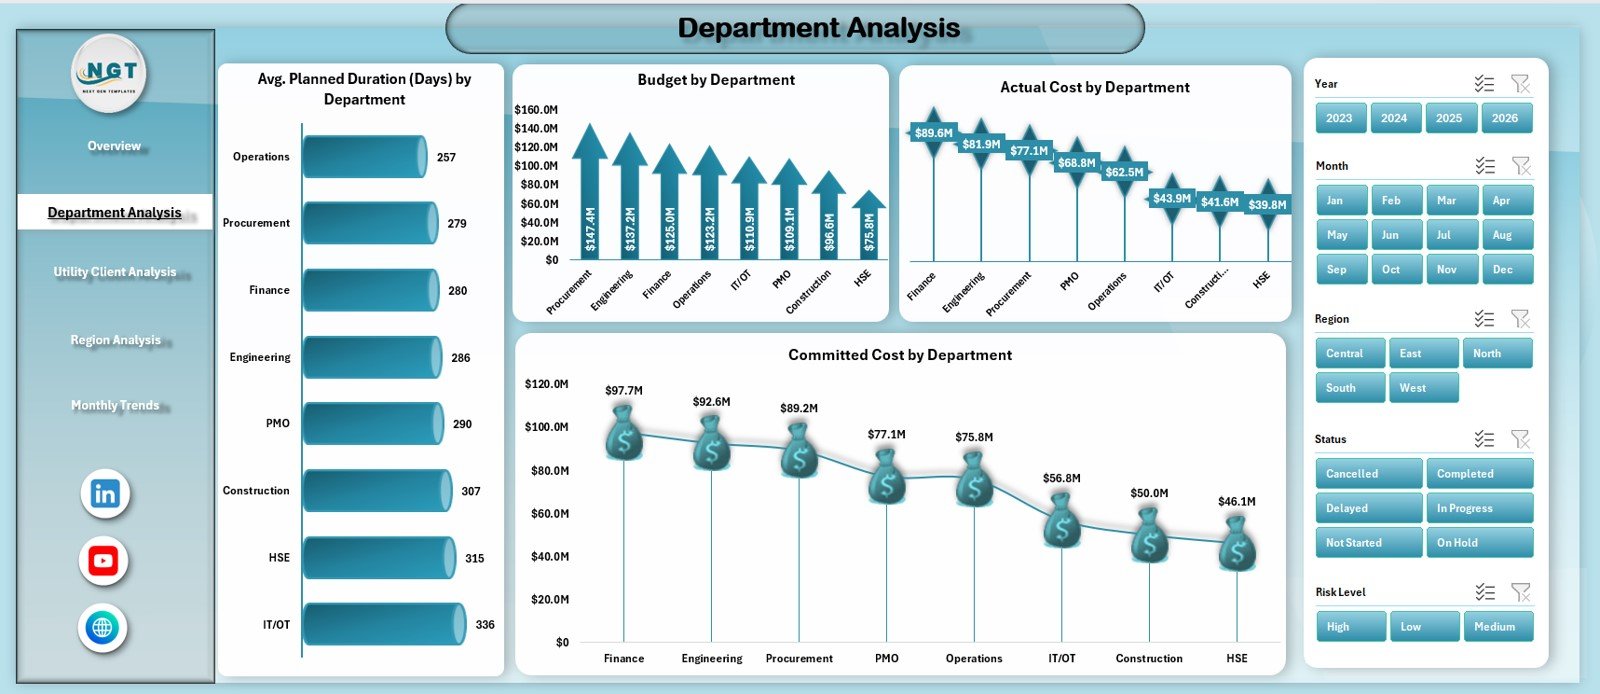
🏢 Department Analysis Page
Provides department-level insights using:
-
Average Planned Duration (Days) by Department
-
Budget by Department
-
Actual Cost by Department
-
Committed Cost by Department
Helps identify cost overruns and delays at the department level.
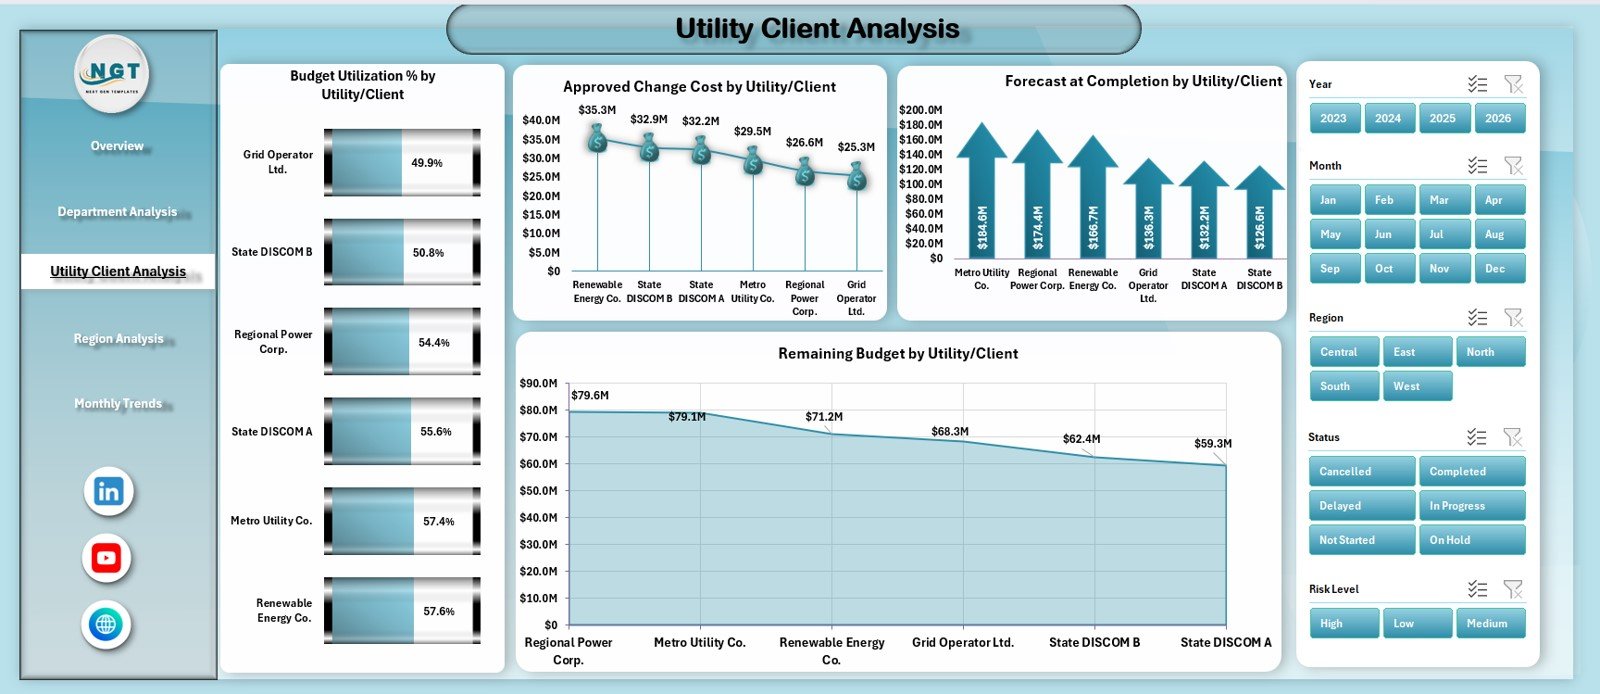
🏗️ Utility / Client Analysis Page
Analyzes performance by utility or client using:
-
Budget Utilization % by Utility / Client
-
Approved Change Cost by Utility / Client
-
Forecast Completion by Utility / Client
-
Remaining Budget by Utility / Client
Supports better client management and negotiation decisions.
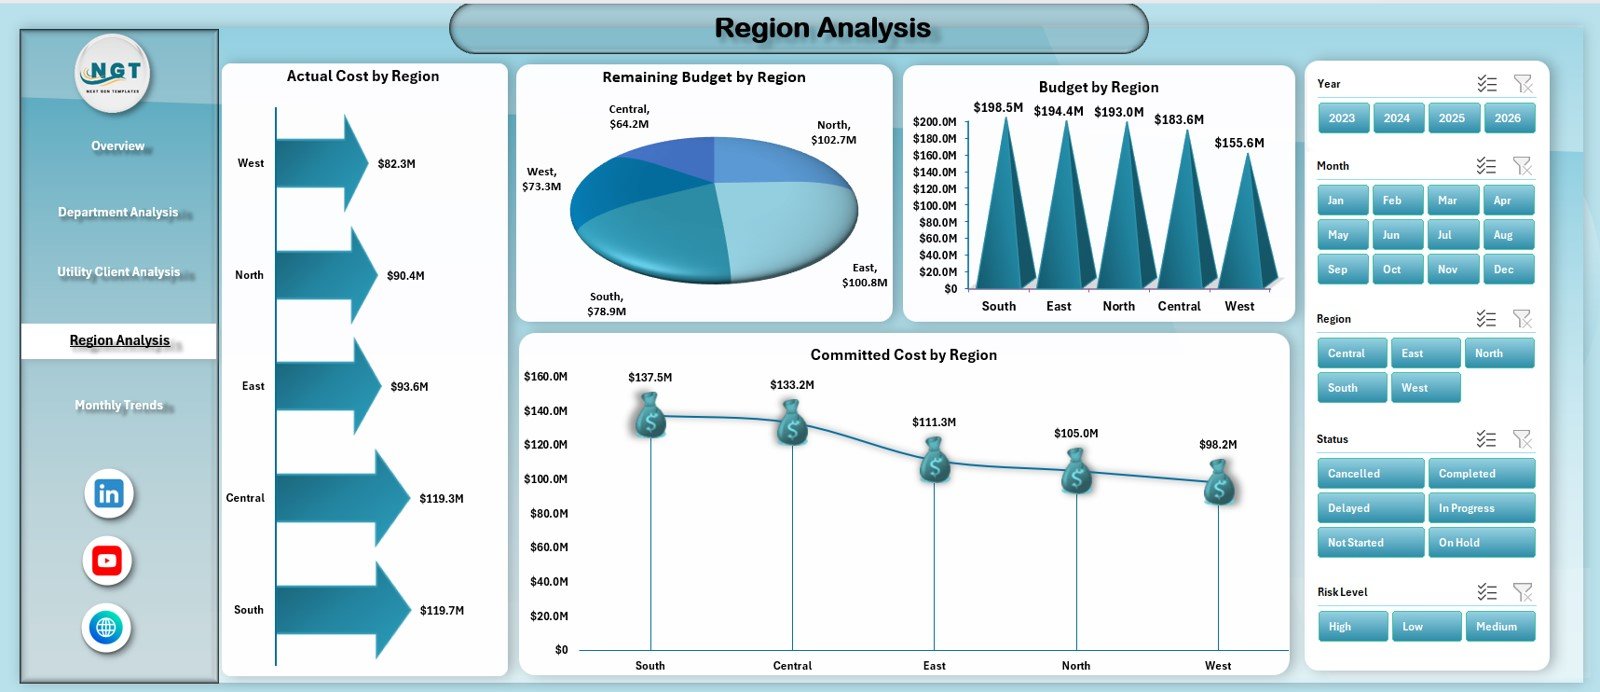
🌍 Region Analysis Page
Delivers geographic performance insights using:
-
Actual Cost by Region
-
Remaining Budget by Region
-
Budget by Region
-
Committed Cost by Region
Improves regional planning and cost control.
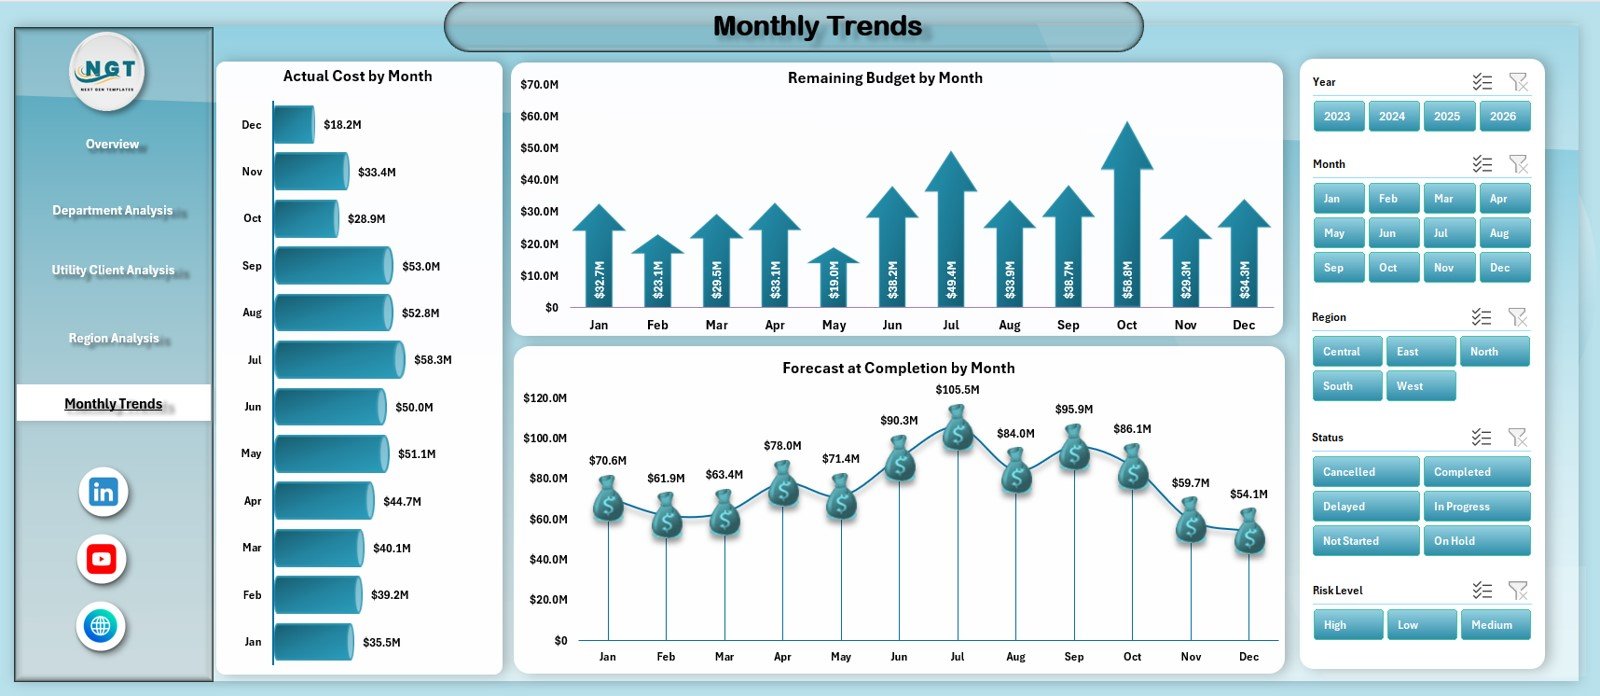
📅 Monthly Trends Page
Tracks time-based performance using:
-
Actual Cost by Month
-
Remaining Budget by Month
-
Forecast at Completion by Month
Helps identify cost spikes and forecast accuracy issues early.
🗂️ Data Sheet
Stores all project-level data in a clean, structured format.
🧩 Support Sheet
Manages dropdowns, validations, and reference tables to ensure clean data entry.
▶️ How to Use Electricity Project Management in Excel
Using this dashboard is simple and business-friendly:
1️⃣ Enter or update project data in the Data Sheet
2️⃣ Use dropdowns for department, region, utility, and risk level
3️⃣ Review KPIs on the Overview Page
4️⃣ Navigate to Department, Utility, or Region Analysis
5️⃣ Track cost variance, remaining budget, and forecast completion
6️⃣ Monitor monthly trends and high-risk projects
7️⃣ Make faster, data-driven project decisions
No advanced Excel skills are required.
🎯 Who Can Benefit from Electricity Project Management in Excel
⚡ Electricity Utilities – Gain full visibility into ongoing projects
🏗️ Power Generation & EPC Companies – Control budgets and schedules
🏢 Infrastructure & Grid Modernization Teams – Improve project governance
📊 Project Managers & PMOs – Track progress and risks clearly
💰 Finance & Planning Teams – Monitor cost variance and forecasts
🏛️ Audit & Review Teams – Improve transparency and reporting
This dashboard supports both operational execution and strategic oversight.
👉 Click here to read the Detailed Blog Post
🔔 Visit our YouTube channel to learn step-by-step video tutorials
👉 YouTube.com/@PKAnExcelExpert


Reviews
There are no reviews yet.