Port tender operations involve high-value contracts, complex evaluations, multiple bidders, cargo-specific risks, and long decision cycles. Port authorities, logistics companies, and infrastructure contractors must manage hundreds of tenders every year while balancing profitability, vendor performance, and financial risk. When this critical data remains locked in Excel sheets or static reports, visibility drops and strategic decisions become reactive instead of proactive.
That is exactly why the Port Tender Dashboard in Power BI becomes a powerful and modern solution.
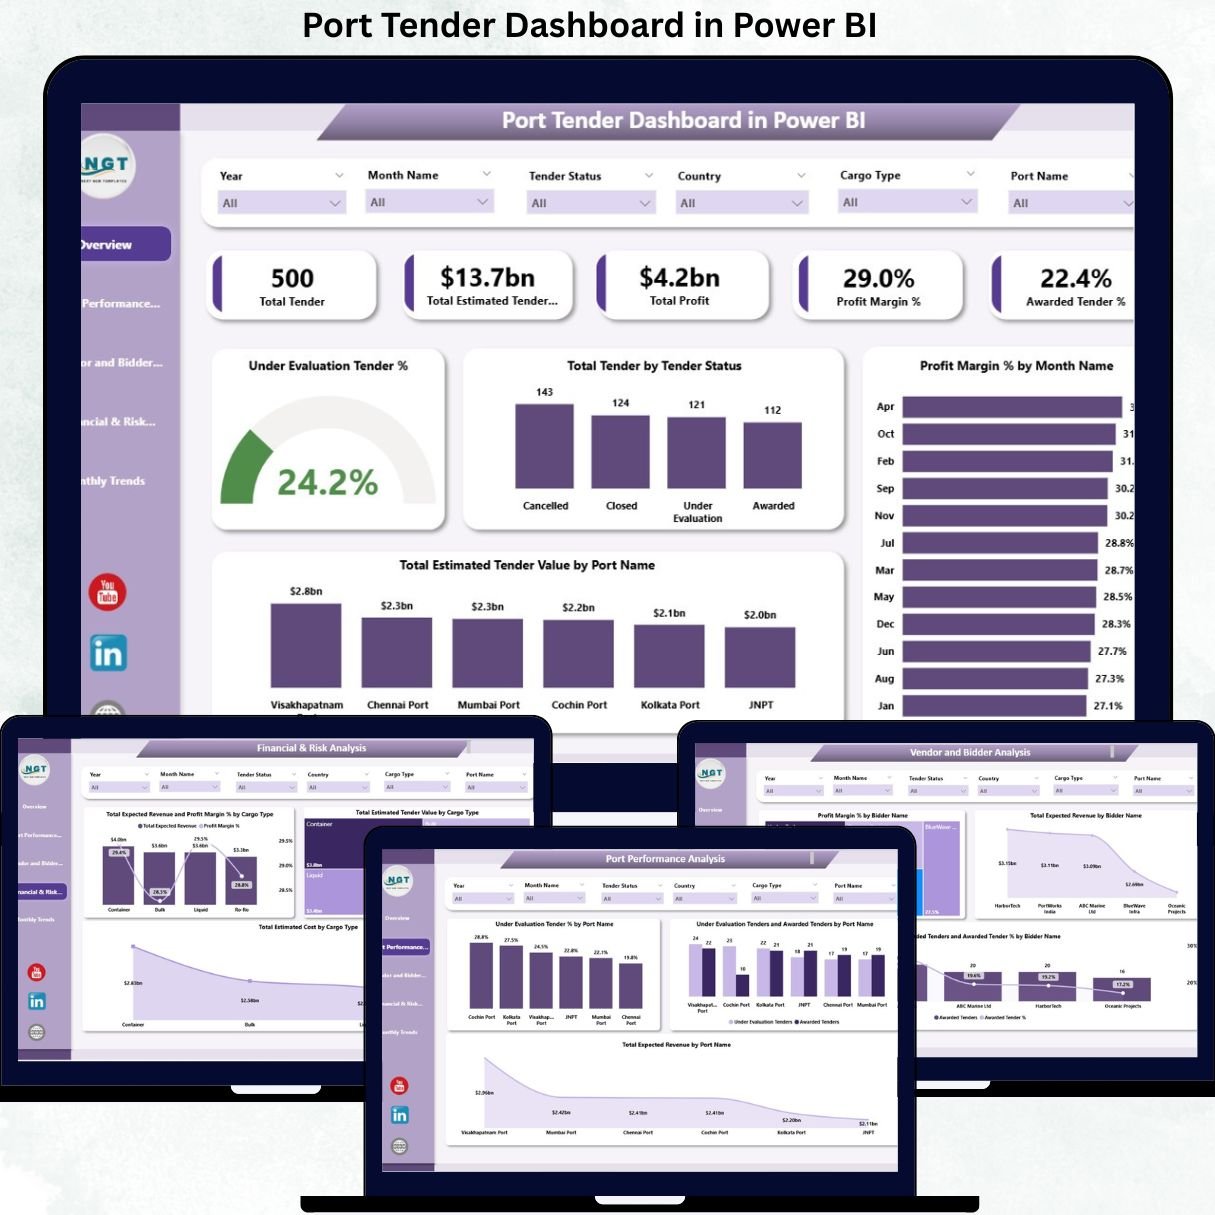
This ready-to-use Power BI dashboard transforms raw port tender data into clear, interactive, and decision-ready insights. Instead of manually reviewing tender registers and financial spreadsheets, leadership teams gain instant clarity through dynamic visuals, KPI cards, filters, and drill-down capabilities. From tender status and profitability to bidder performance and cargo-wise risk, everything is available in one centralized Power BI dashboard.
Because the dashboard is built in Power BI, users benefit from fast slicing, real-time interactivity, and presentation-ready visuals—without relying on expensive custom BI development.
✨ Key Features of the Port Tender Dashboard in Power BI
📊 1. Executive-Level KPI Overview
Instantly track total tenders, estimated value, profit, profit margin %, and awarded tender success rate from a single screen.
⚡ 2. Interactive Filtering & Drill-Downs
Filter data by port, bidder, cargo type, tender status, or month to explore insights at multiple levels.
💰 3. Profitability & Margin Analysis
Monitor profit and profit margin trends to reduce financial risk and support smarter tender awards.
🤝 4. Vendor & Bidder Performance Tracking
Compare bidders based on revenue contribution and margin efficiency.
📅 5. Monthly Trend & Forecasting Insights
Understand seasonality, decision delays, and performance changes over time.
📦 What’s Inside the Port Tender Dashboard in Power BI
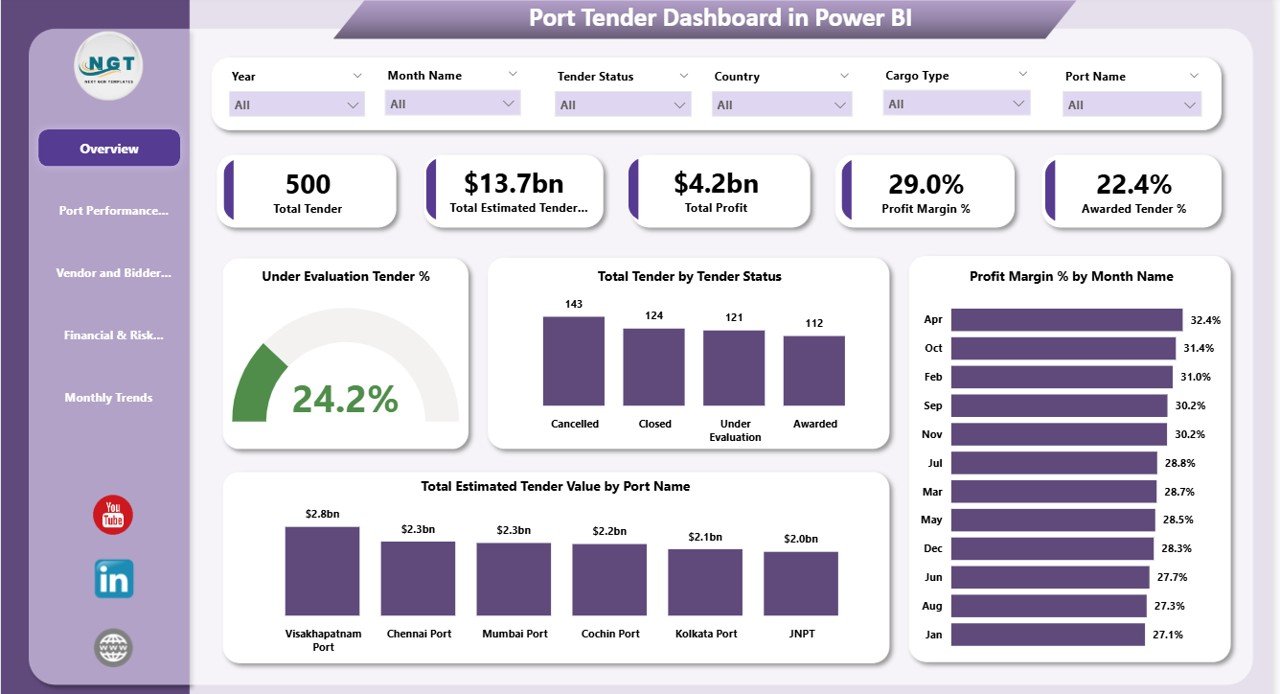
🖥️ Overview Page – Executive Summary
This is the command center of the dashboard, designed for senior management.
KPI Cards Included
-
Total Tenders – Total number of tenders tracked
-
Estimated Tender Value – Combined value of all tenders
-
Profit – Total projected profit
-
Profit Margin % – Overall profitability ratio
-
Awarded Tender % – Tender success rate
Overview Charts
-
Total Tender by Tender Status – Awarded, Under Evaluation, Closed, Cancelled
-
Under Evaluation Tender % – Identifies pending approval risk
-
Profit Margin % by Month – Tracks monthly profitability trends
-
Estimated Tender Value by Port Name – Highlights high-value ports
These visuals provide instant clarity on scale, performance, and financial health.
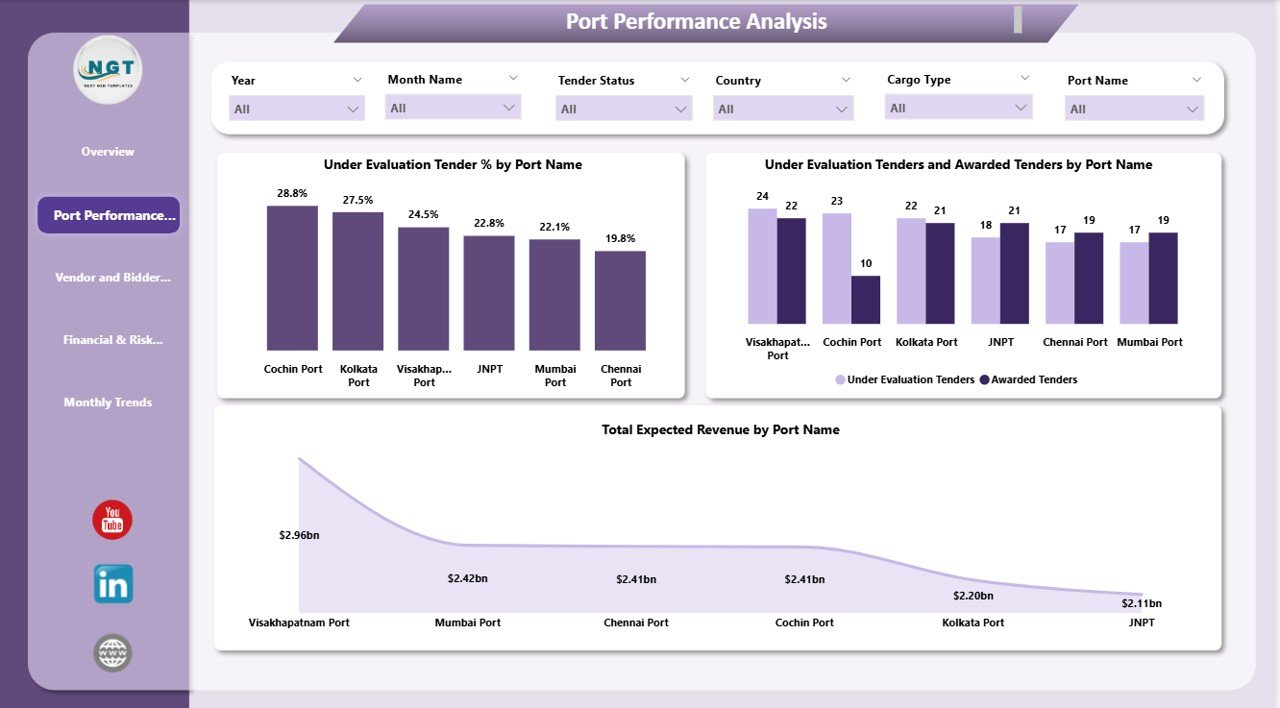
🚢 Port Performance Analysis
This section compares tender efficiency and financial outcomes across ports.
Charts Included
-
Under Evaluation Tender % by Port Name – Identifies slow decision cycles
-
Under Evaluation vs Awarded Tenders by Port Name – Measures conversion efficiency
-
Total Expected Revenue by Port Name – Highlights revenue-driving ports
This analysis helps port authorities and contractors focus on high-performing locations while improving weaker ones.
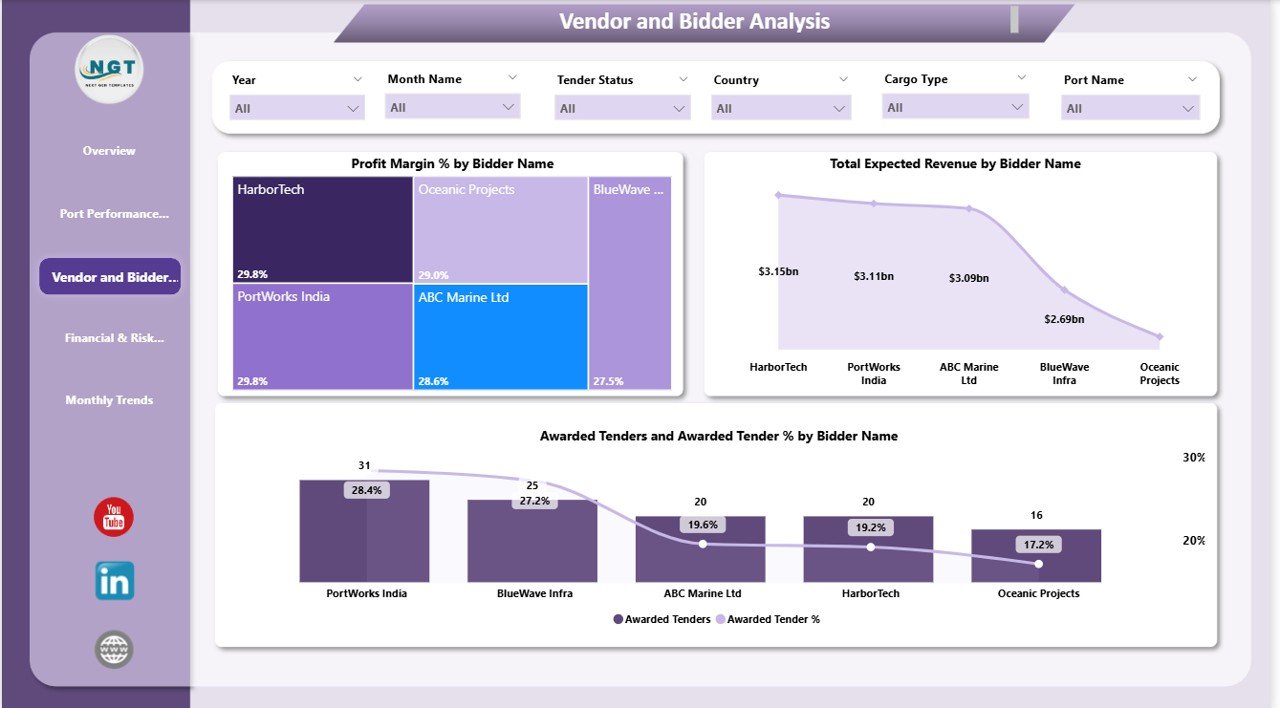
🤝 Vendor and Bidder Analysis
Vendor performance directly impacts tender success and profitability.
Charts Included
-
Profit Margin % by Bidder Name – Identifies margin-efficient bidders
-
Total Expected Revenue by Bidder Name – Highlights high-value partners
These insights support data-driven bidder selection, negotiations, and long-term vendor strategies.
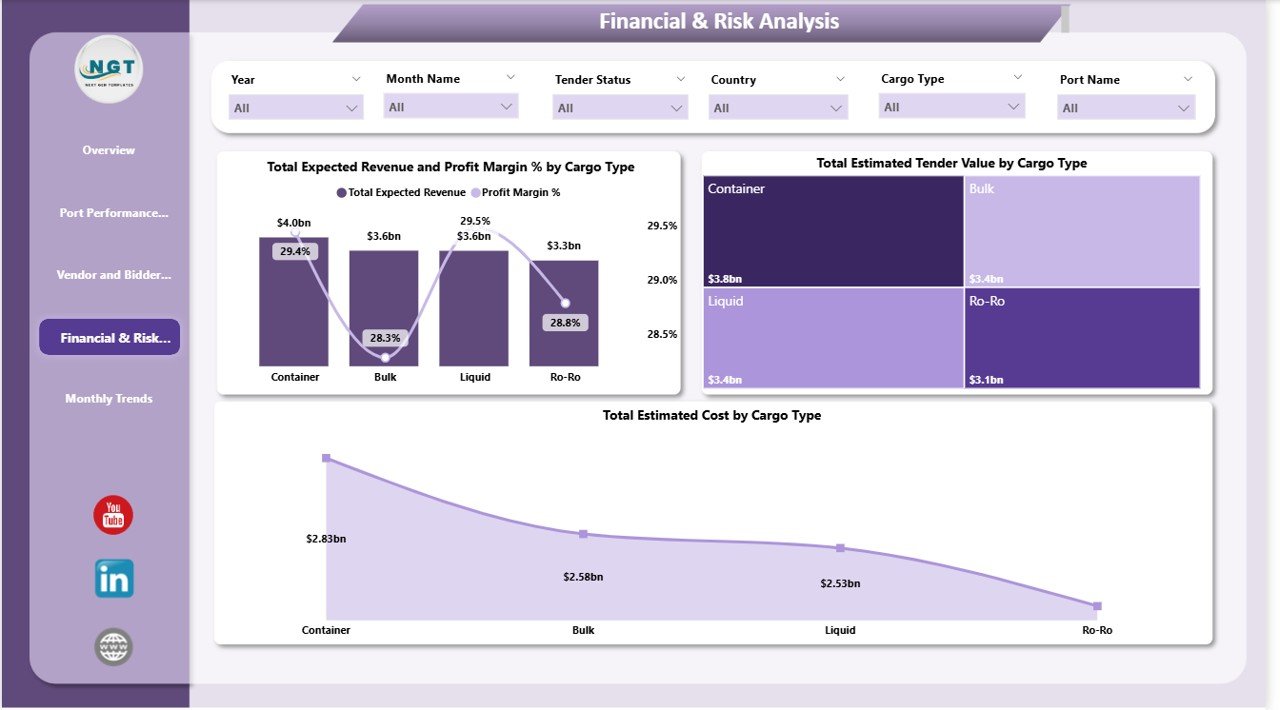
💼 Financial & Risk Analysis
Cargo type plays a major role in cost structure and risk exposure.
Charts Included
-
Expected Revenue & Profit Margin % by Cargo Type
-
Estimated Tender Value by Cargo Type
-
Estimated Cost by Cargo Type
This section helps teams prioritize profitable cargo segments while managing operational and financial risk.
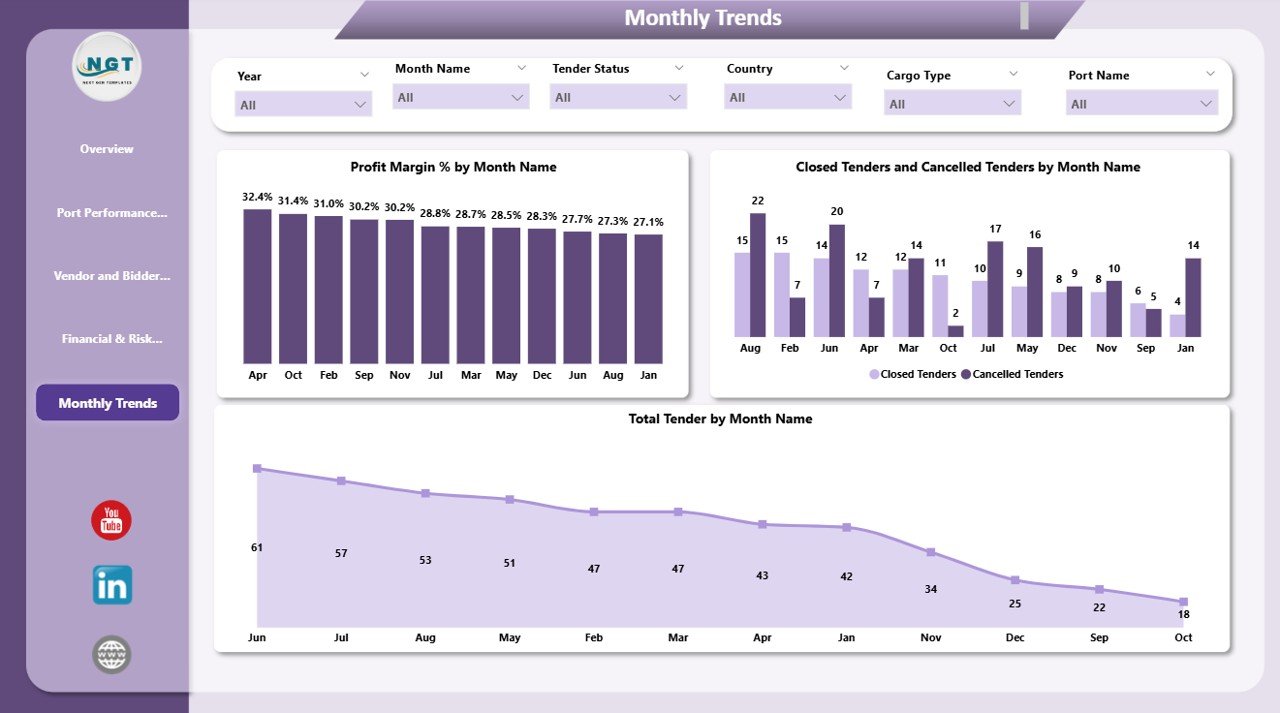
📅 Monthly Trends Analysis
Track how tender activity and outcomes evolve over time.
Charts Included
-
Profit Margin % by Month Name
-
Closed & Cancelled Tenders by Month Name
-
Total Tenders by Month Name
This page supports forecasting, workload planning, and strategic scheduling.
🎯 Who Can Benefit from This Port Tender Dashboard in Power BI
⚓ Port Authorities
Gain real-time visibility into tender pipelines and performance.
🚚 Logistics & Shipping Companies
Track profitability, bidder efficiency, and cargo risk.
🏗️ Infrastructure Contractors
Evaluate tender opportunities with financial clarity.
📊 Finance & Risk Teams
Monitor margins, costs, and exposure continuously.
🏢 Senior Management
Make faster, data-backed strategic decisions.


Reviews
There are no reviews yet.