Customer onboarding is the foundation of a strong and long-lasting customer relationship. When onboarding is smooth, customers gain confidence, adoption increases, and churn reduces significantly. However, many organizations still manage onboarding through emails, manual trackers, or disconnected tools. As a result, teams lose visibility, onboarding timelines stretch, customers drop off, and satisfaction scores fall.
The Customer Onboarding Dashboard in Google Sheets is designed to solve these challenges with a simple, structured, and data-driven approach. This ready-to-use dashboard provides complete visibility into onboarding progress, timelines, customer satisfaction, and drop-off risks—all from a single Google Sheets file.
Because it runs entirely on Google Sheets, this dashboard is easy to use, cloud-based, and collaborative. Customer Success, Sales, Operations, and Leadership teams can work together in real time without investing in expensive onboarding software.
🚀 Key Features of the Customer Onboarding Dashboard in Google Sheets
📊 Real-Time Onboarding Visibility
Track how many customers are Completed, In Progress, or Dropped Off instantly.
⏱️ Onboarding Duration Tracking
Monitor average onboarding time (in days) across stages, industries, locations, and months.
⭐ Customer Satisfaction (CSAT) Monitoring
Analyze CSAT scores by onboarding stage, industry, location, and monthly trend.
🏭 Industry-Wise Performance Analysis
Understand which industries require longer onboarding cycles or additional support.
🌍 Location-Wise Onboarding Insights
Compare onboarding efficiency across regions and improve local execution.
🔄 Stage-Wise Bottleneck Identification
Identify which onboarding stages slow down progress or cause drop-offs.
📈 Monthly Trend Analysis
Track improvements, seasonality, and workload patterns over time.
📦 What’s Inside the Customer Onboarding Dashboard
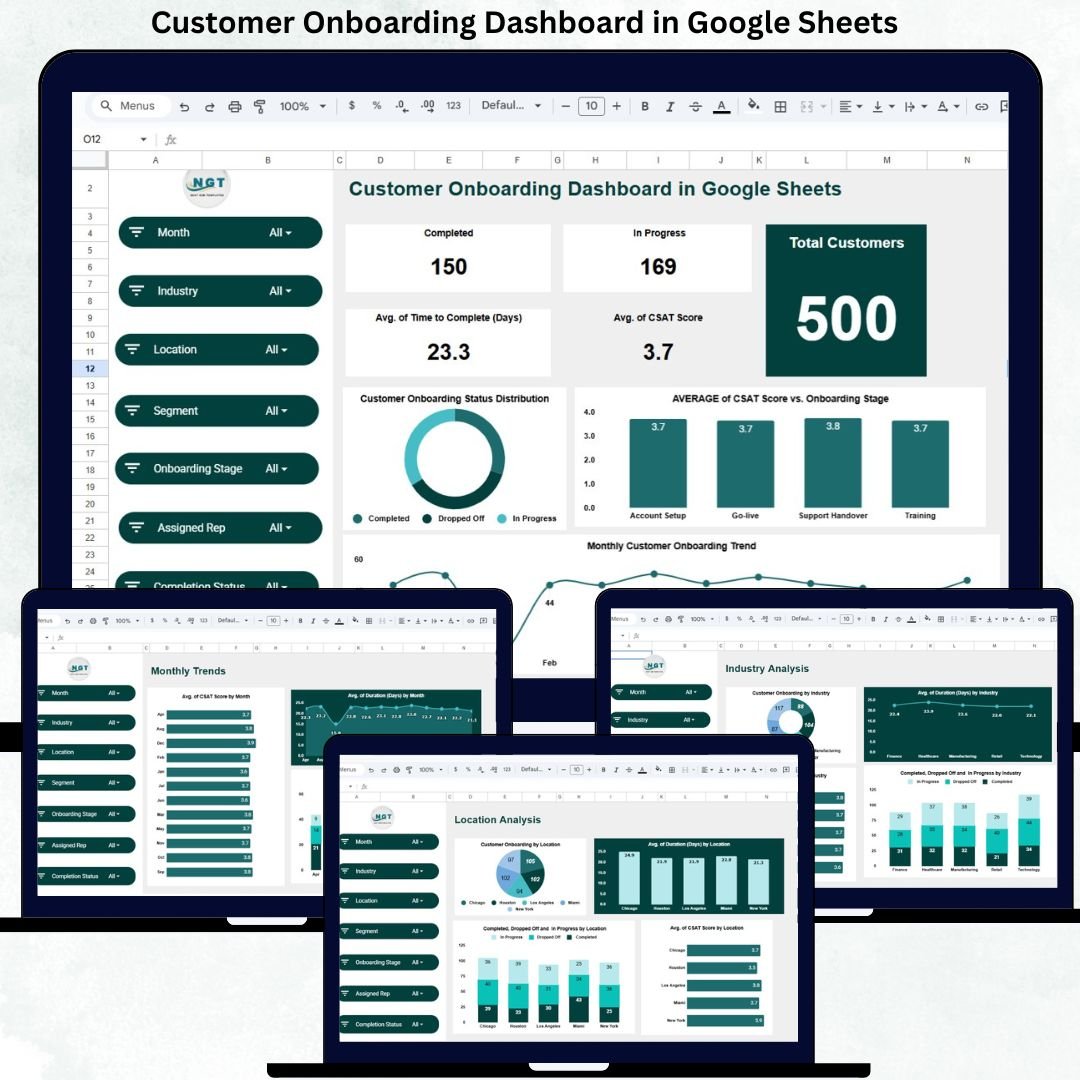
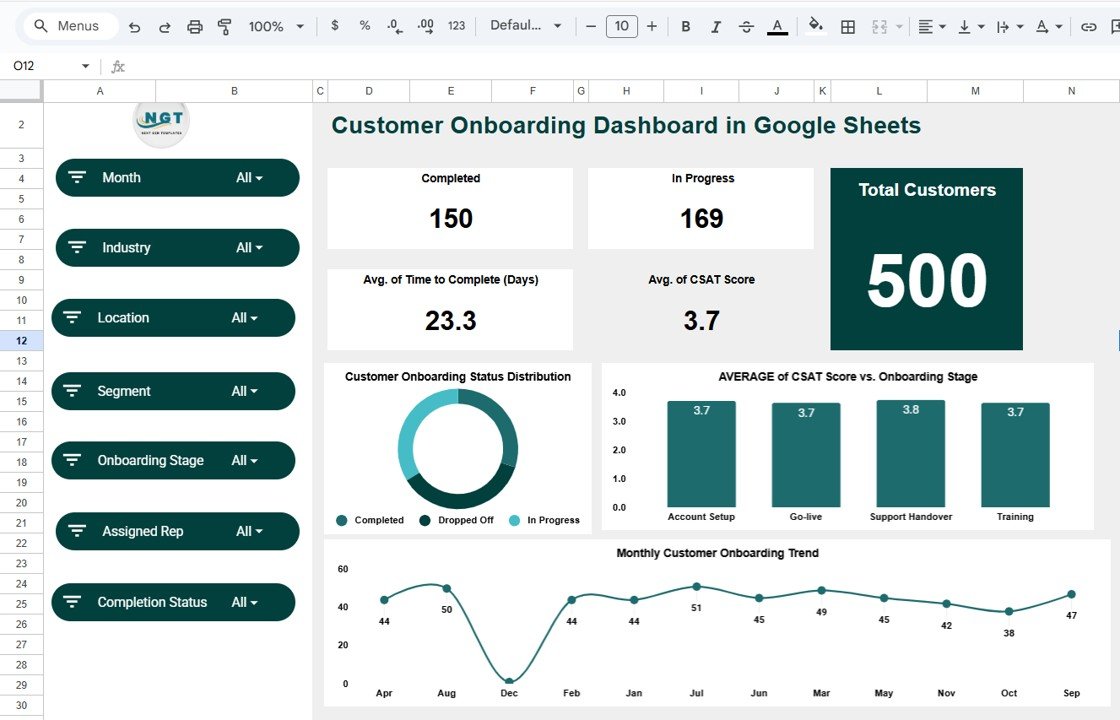
🖥️ Overview Sheet – Executive Snapshot
This is the main summary page designed for leadership and managers.
KPI Cards Included:
-
✅ Completed – Customers who finished onboarding
-
🔄 In Progress – Customers currently onboarding
-
⏳ Average Time to Complete (Days) – Overall onboarding duration
-
⭐ Average CSAT Score – Customer satisfaction during onboarding
-
👥 Total Customers – Overall onboarding volume
Overview Charts:
-
📊 Customer Onboarding Status Distribution
-
⭐ Average CSAT Score vs Onboarding Stage
-
📅 Monthly Customer Onboarding Trend
This sheet gives instant clarity on onboarding health.
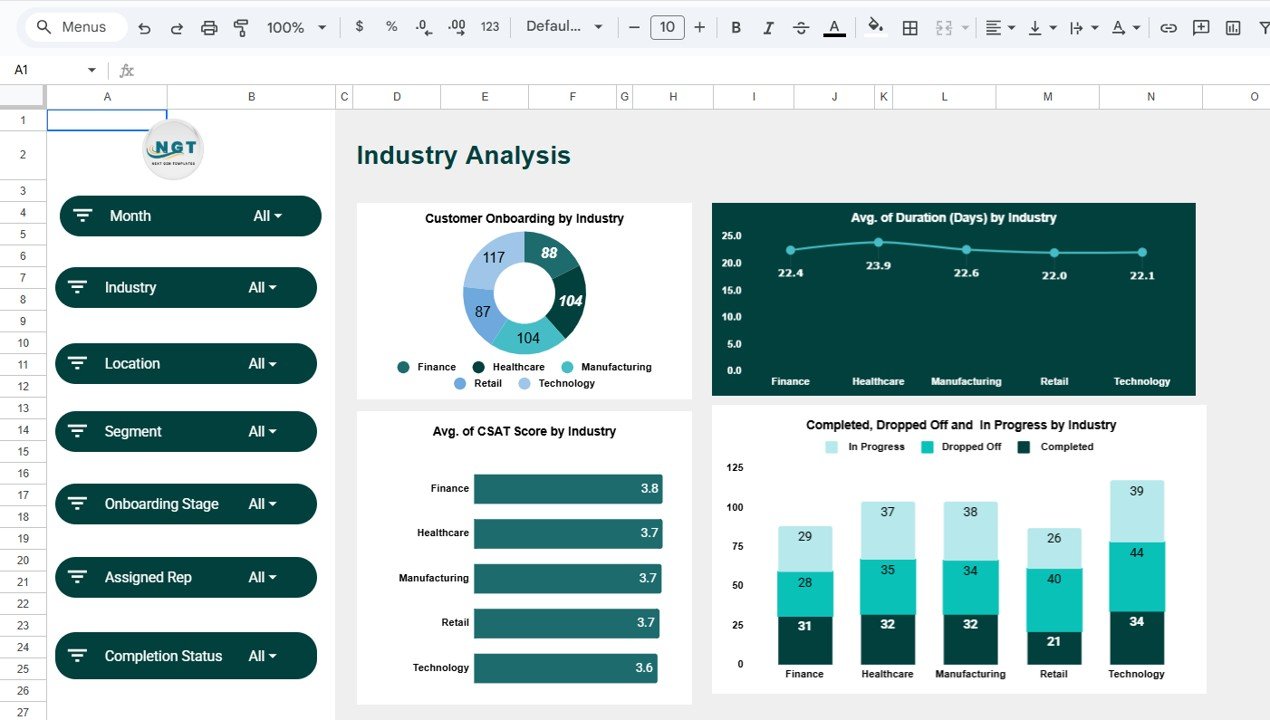
🏭 Industry Analysis Sheet
This sheet compares onboarding performance across industries.
Charts Included:
-
Customer Onboarding by Industry
-
Average Duration (Days) by Industry
-
Completed vs In Progress vs Dropped Off by Industry
-
Average CSAT Score by Industry
It helps teams design industry-specific onboarding strategies.
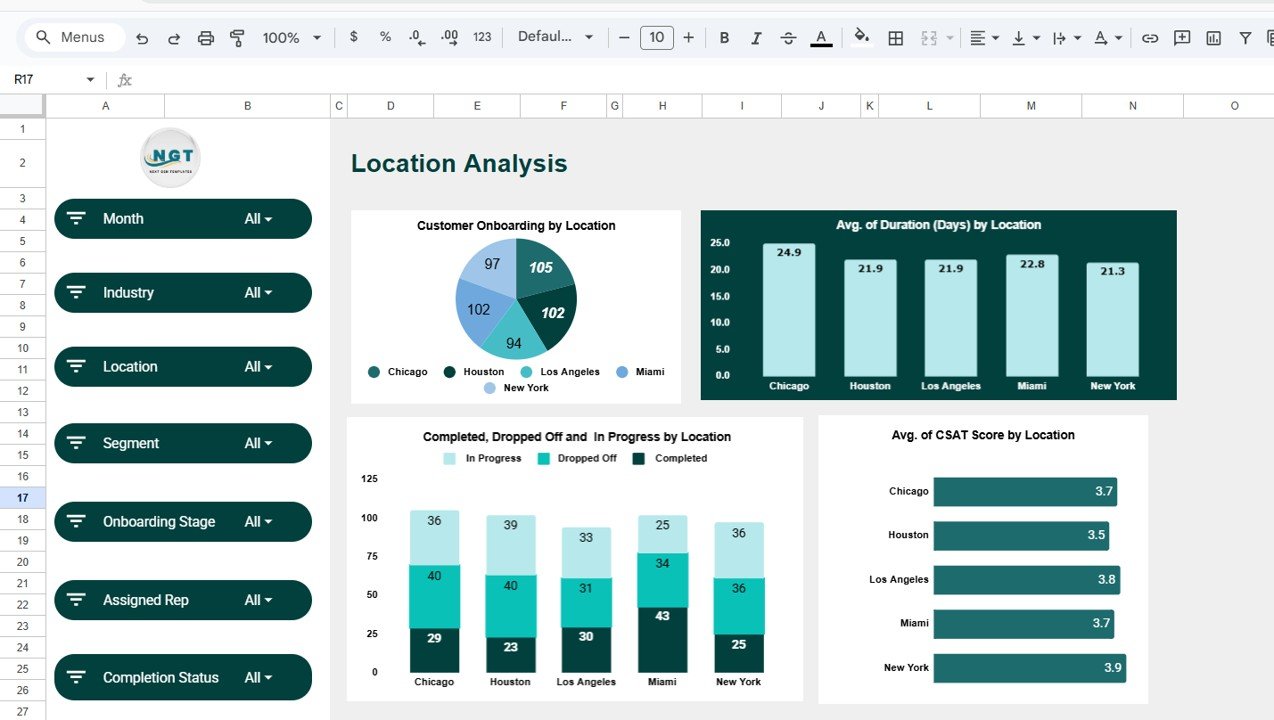
🌍 Location Analysis Sheet
This section highlights regional onboarding performance.
Charts Included:
-
Customer Onboarding by Location
-
Average Duration (Days) by Location
-
Completed, Dropped Off & In Progress by Location
-
Average CSAT Score by Location
Perfect for global or multi-region teams.
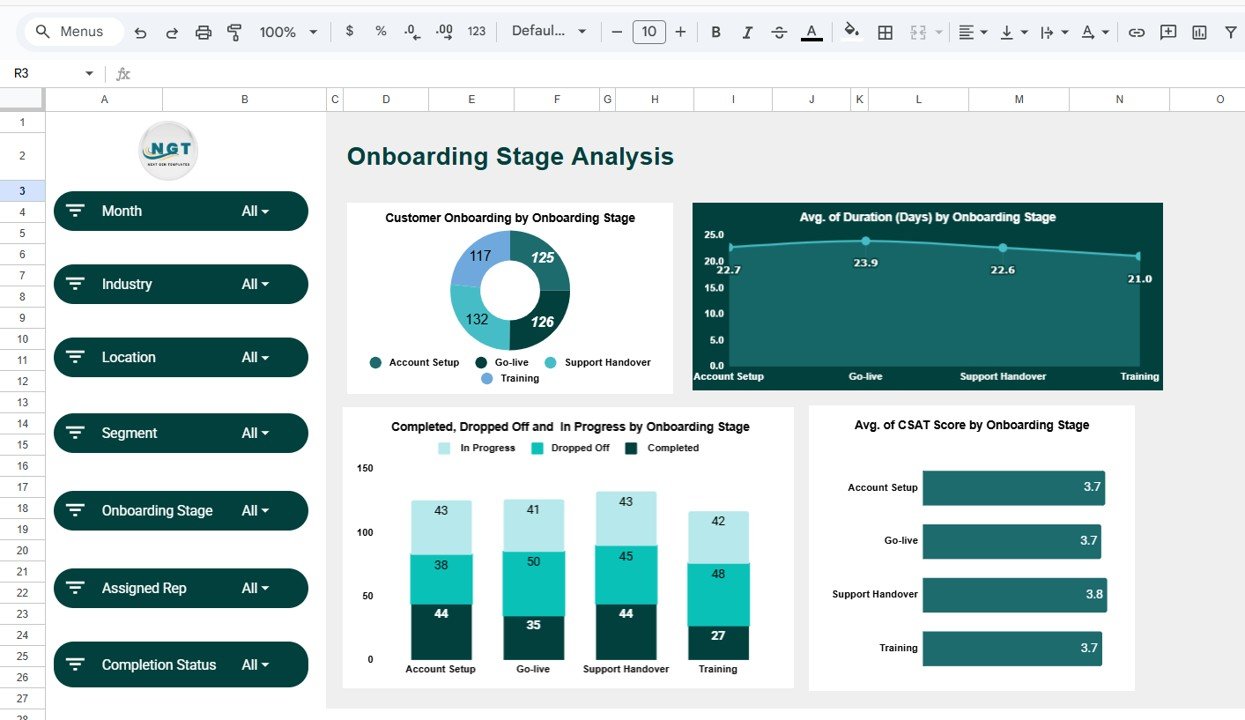
🔄 Onboarding Stage Analysis Sheet
This sheet focuses on every step of the onboarding journey.
Charts Included:
-
Average Duration (Days) by Onboarding Stage
-
Customer Onboarding by Stage
-
Completed, Dropped Off & In Progress by Stage
-
Average CSAT Score by Onboarding Stage
It clearly shows where customers struggle or slow down.
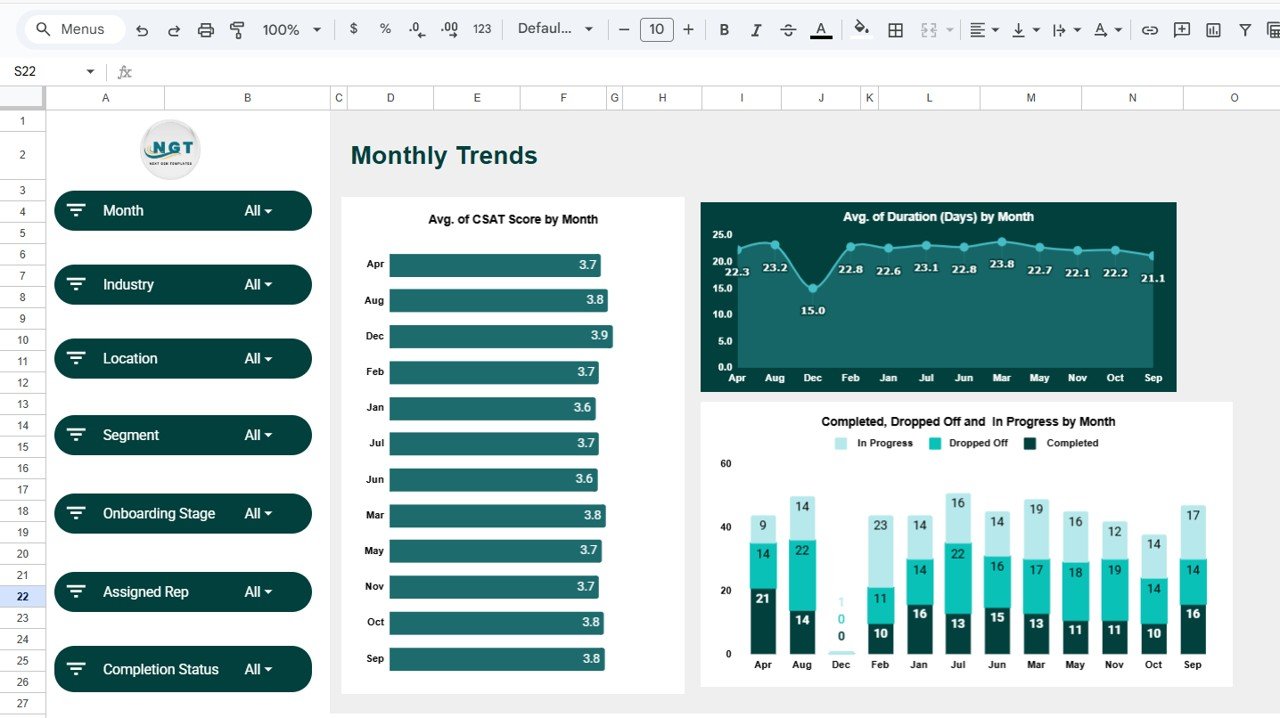
📈 Monthly Trends Analysis Sheet
This section tracks performance over time.
Charts Included:
-
Average CSAT Score by Month
-
Completed, Dropped Off & In Progress by Month
-
Average Duration (Days) by Month
It helps leadership measure improvement and capacity needs.
🛠️ How to Use the Customer Onboarding Dashboard
1️⃣ Enter customer onboarding data
2️⃣ Update onboarding status and stage regularly
3️⃣ Monitor CSAT and duration trends
4️⃣ Identify bottlenecks and drop-off points
5️⃣ Improve onboarding processes using insights
👥 Who Can Benefit from This Dashboard
-
🤝 Customer Success Teams
-
📊 Sales & Pre-Sales Teams
-
⚙️ Operations Teams
-
🚀 SaaS & Service Businesses
-
👨💼 Founders & Leadership Teams
### Click here to read the Detailed blog post
Watch the step-by-step video tutorial:


Reviews
There are no reviews yet.