Managing events requires speed, clarity, and perfect coordination. Event production teams handle dozens of tasks—venue planning, budget tracking, issue management, client coordination, weather risks, and profitability checks. When this information spreads across multiple spreadsheets, teams struggle to make timely decisions. Delays grow, costs rise, and event outcomes suffer.
The Event Production Dashboard in Power BI solves this challenge instantly. It centralizes all operational, financial, and client-related KPIs into one modern, interactive dashboard. Instead of searching through scattered files, you get real-time insights into revenue, profit margins, event performance, venue behavior, client contribution, and monthly trends. With slicers, charts, and automated visuals, the dashboard makes event management data-driven and highly efficient.
Below is the complete breakdown of what’s inside this powerful dashboard.
✨ Key Features of the Event Production Dashboard in Power BI
(Heading 2)
This dashboard is designed for clarity, speed, and decision-focused reporting. It includes:
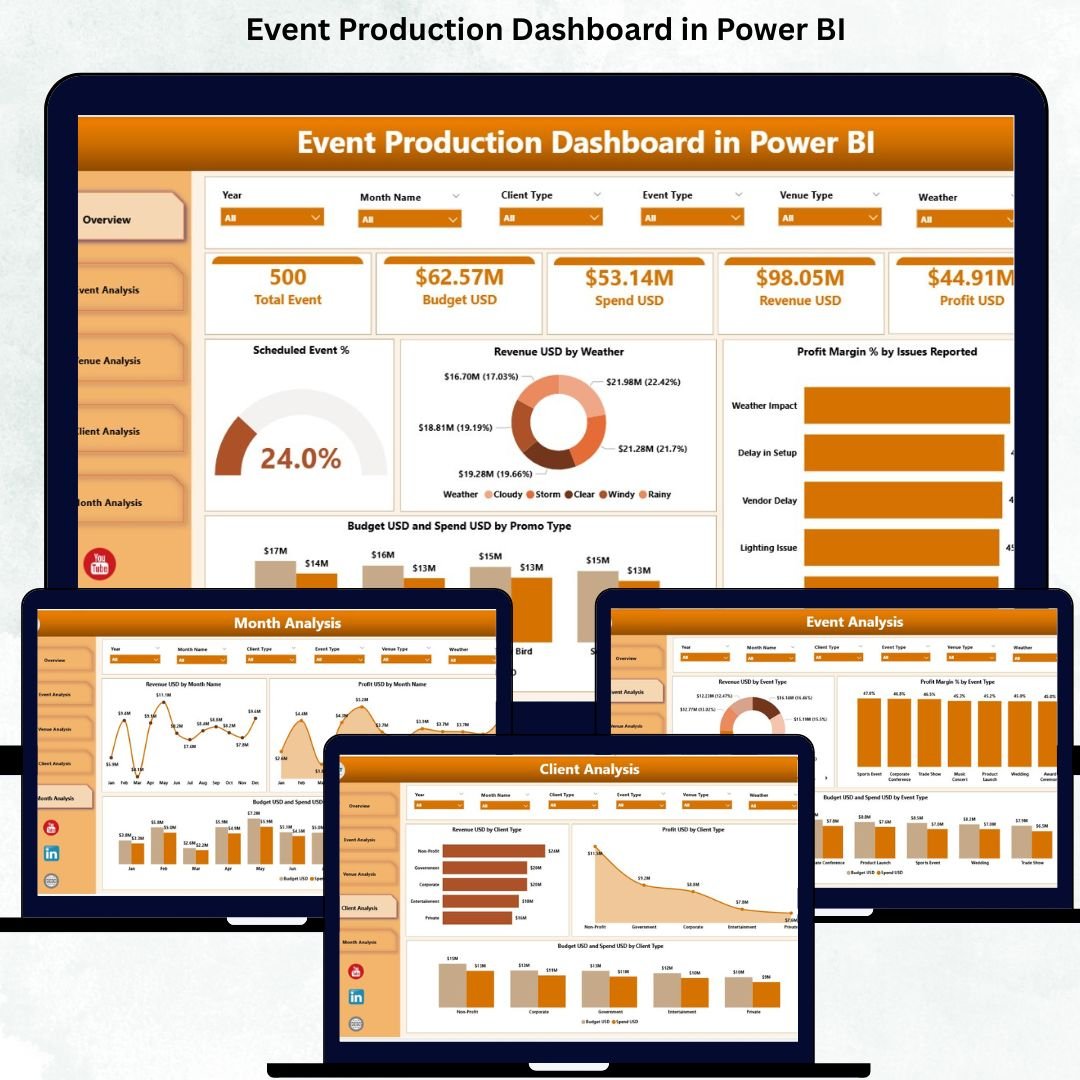
✔ 5 Fully Interactive Pages
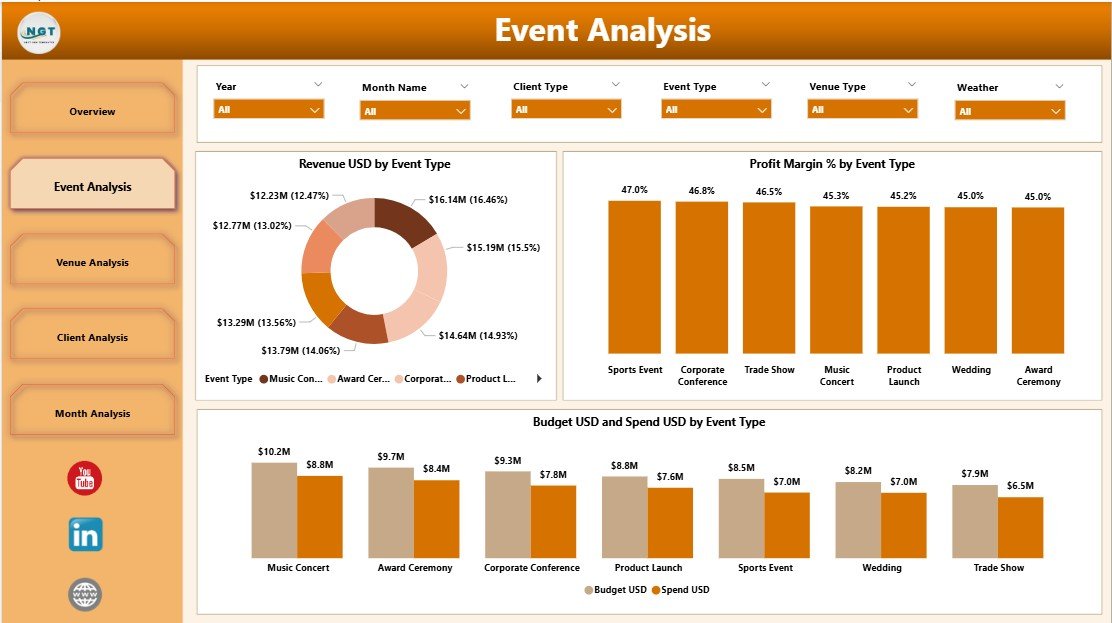
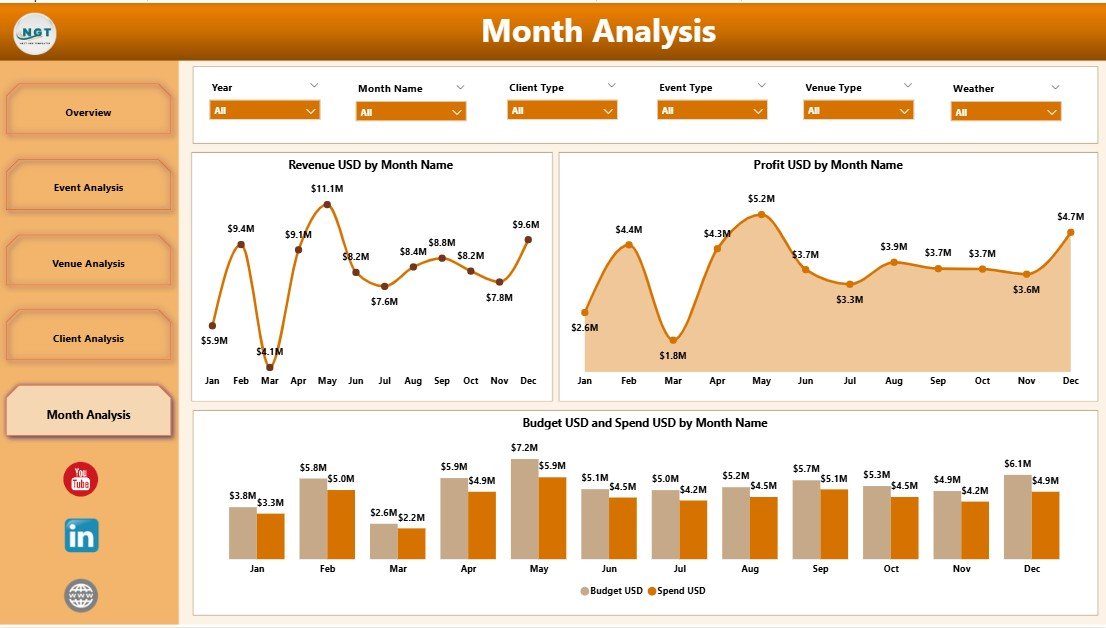
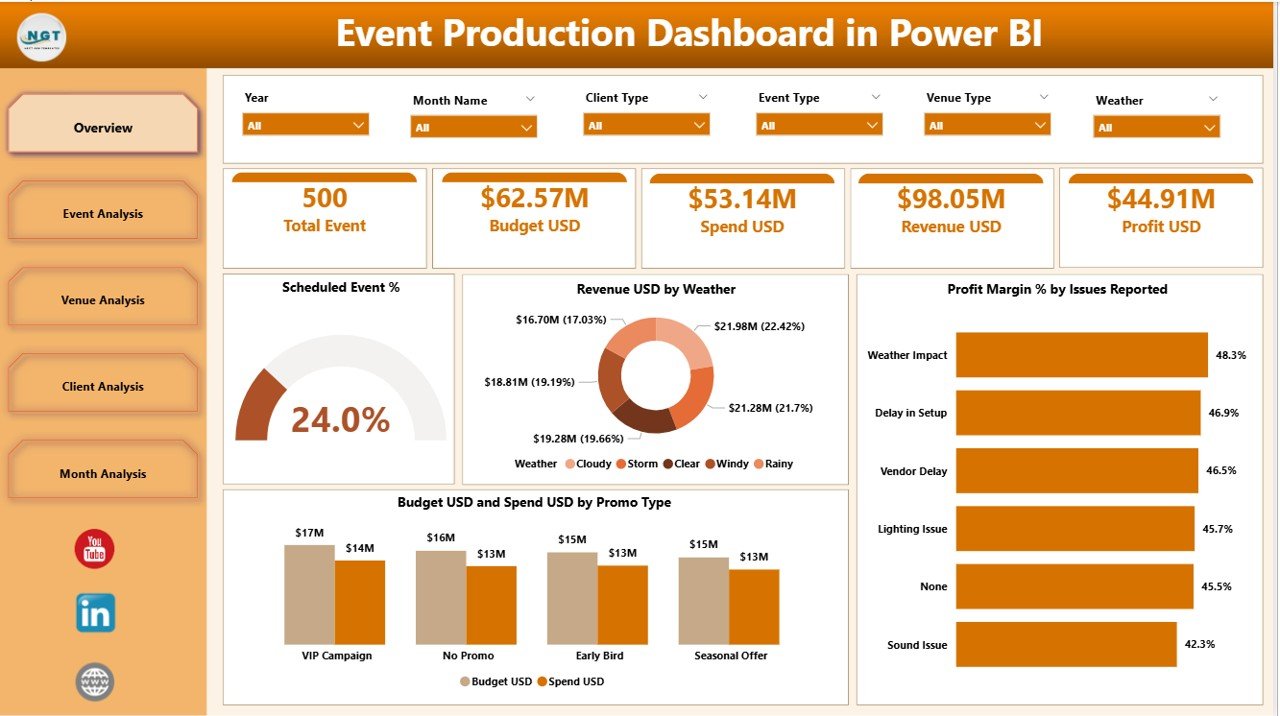
Each page highlights a different performance angle: Overview, Event Analysis, Venue Analysis, Client Analysis, and Monthly Trends.
✔ Dynamic Slicers
Filter the entire report by event type, venue type, client type, weather conditions, issues, or month in seconds.
✔ Smart KPI Cards
Track metrics such as Scheduled Event %, Total Revenue, Profit Margin %, and Budget Performance instantly.
✔ Clear Visual Comparisons
Charts show budget vs. spend, revenue by weather, profit margin by issues reported, and much more.
✔ Automatic Updates
As soon as you refresh your Power BI file, all charts and visuals update with the latest data.
This ensures leadership and event teams always work with current, accurate information.
📦 What’s Inside the Event Production Dashboard
(Heading 2)
When you download this dashboard, you get:
🖥 Power BI (.pbix) Dashboard File
Professionally designed with interactive visuals, slicers, and KPI indicators.
📘 Structured Excel Backend
Easily editable Excel tables for event data, budgets, weather inputs, venue details, and client types.
📊 Ready-Made Visuals Including:
-
Scheduled Event %
-
Revenue by Weather
-
Profit Margin % by Event Type
-
Budget vs Spend Comparison
-
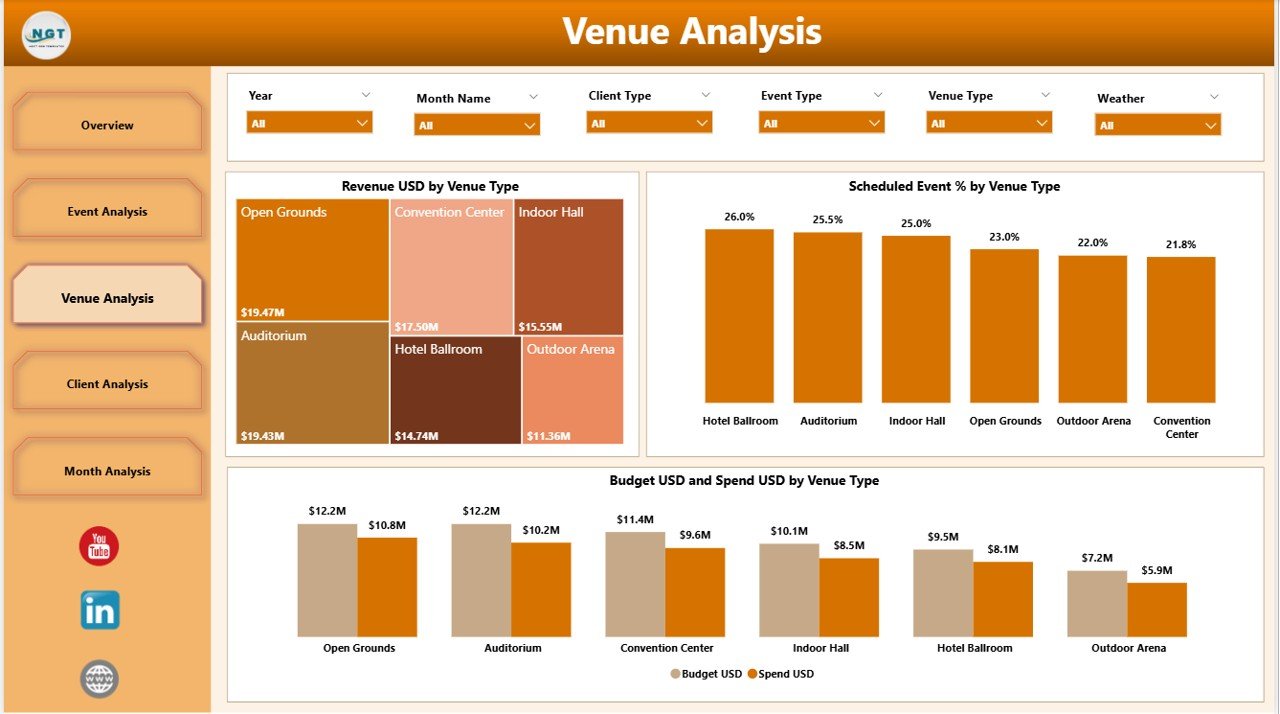
Venue Performance
-
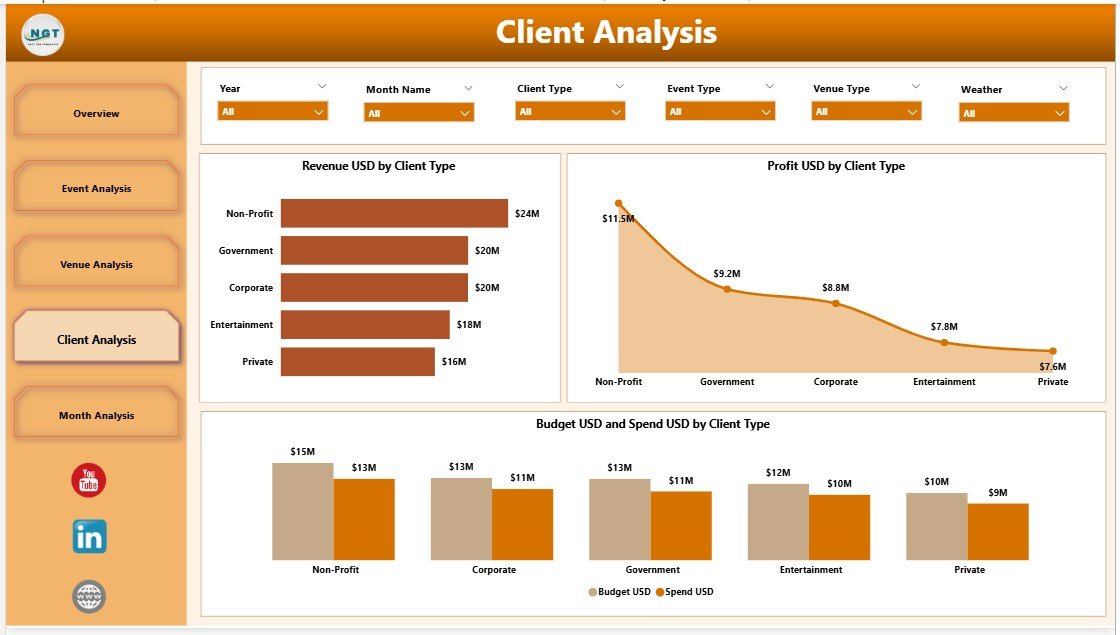
Client Contribution
-
Monthly Revenue & Profit Trends
🎯 Easy Navigation Across Pages
The dashboard’s layout ensures quick access to all insights with minimal learning required.
This package gives you everything needed for smooth, data-driven event management.
📝 How to Use the Event Production Dashboard
(Heading 2)
Using this dashboard is simple and requires no technical expertise.
1️⃣ Update the Excel Data File
Enter details like event type, revenue, spend, venue type, client type, and weather conditions.
2️⃣ Refresh the Power BI File
Power BI will automatically update all visuals, slicers, and calculations.
3️⃣ Use Slicers to Analyze Events
Filter by month, client type, event type, or venue to compare performance instantly.
4️⃣ Review Budget vs Spend
Use Budget USD vs Spend USD charts to detect overspending early.
5️⃣ Track Profit Margins
Identify which events, clients, or venues bring the highest profitability.
6️⃣ Use Monthly Trends for Planning
Understand seasonal behavior to schedule high-performing events at the right time.
Every page is designed to simplify decision-making and offer deeper event insights.
👥 Who Can Benefit from This Event Production Dashboard?
(Heading 2)
This dashboard is ideal for:
👨💼 Event Managers
Monitor event outcomes and improve planning efficiency.
📊 Financial Teams
Track budgets, spending, and profit margins accurately.
🎤 Operations Teams
Manage issues, venue performance, and scheduling patterns.
👥 Client Relationship Managers
Understand which client types contribute most to revenue.
📅 Event Planners & Coordinators
Plan future events based on trends and historical performance.
Whether you manage corporate events, product launches, concerts, conferences, or promotional activities, this dashboard offers complete clarity.


Reviews
There are no reviews yet.