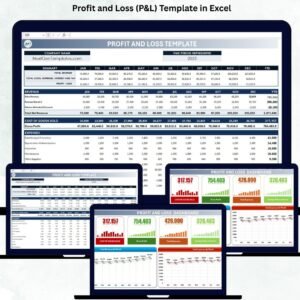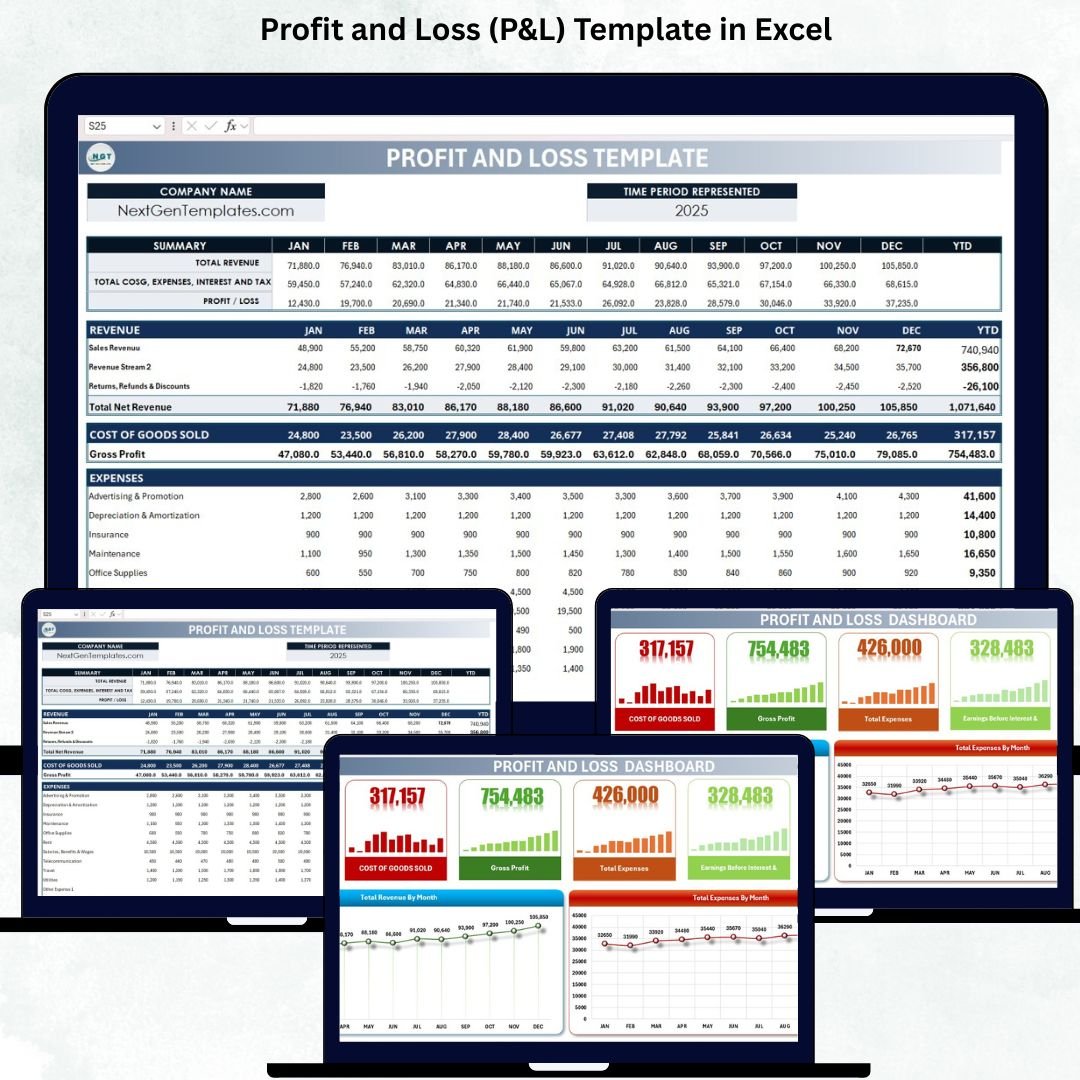
Understanding your business’s financial performance is essential for growth, stability, and smart decision-making. However, many companies still track revenue and expenses in scattered spreadsheets or rely on outdated reporting methods that lead to errors, delays, and confusion. The Profit and Loss (P&L) Template in Excel gives you a clean, automated, and professional way to monitor your financials month by month—without needing complex accounting software.
This ready-to-use Excel template provides a complete view of your revenue, expenses, cost of goods sold (COGS), gross profit, taxes, and net profit. It includes automated formulas, organized sections, and a visual dashboard that transforms financial data into meaningful insights. Whether you run a small business, manage multiple departments, or oversee financial planning, this template helps you maintain accuracy and make informed decisions with confidence.
✨ Key Features of the Profit and Loss (P&L) Template in Excel
📊 1. Monthly & Year-to-Date Profit Tracking
Track revenue, expenses, COGS, taxes, and profit for every month. The template automatically calculates year-to-date (YTD) totals, giving you a clear picture of financial performance throughout the year.
💰 2. Revenue Breakdown by Stream
Record multiple revenue sources, including sales, services, or custom revenue streams. Returns and discounts are handled automatically as negative values.
📉 3. Detailed Expenses Categorization
Monitor expenses across multiple categories such as rent, salaries, utilities, travel, maintenance, insurance, marketing, office supplies, and more. You can add additional expense categories anytime.
📈 4. Automated Financial Calculations
All major financial KPIs—Gross Profit, EBIT, Profit Before Tax, Net Profit—are calculated automatically, ensuring accuracy and saving time.
📊 5. Visual Dashboard for Quick Insights
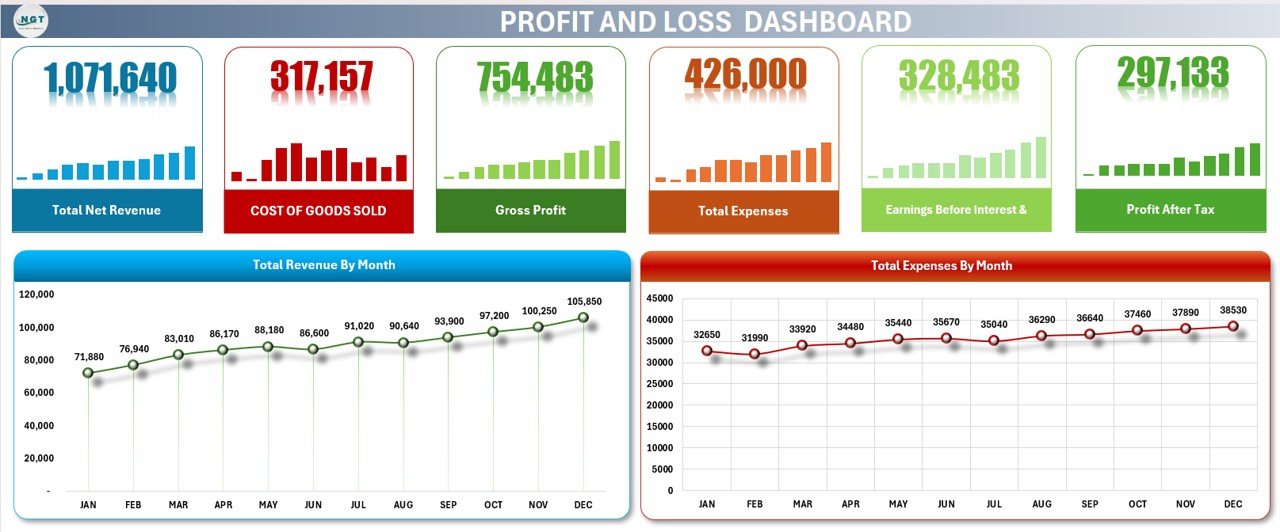
The included dashboard provides summary cards and charts to help you instantly analyze profitability, revenue trends, and monthly expenses.
📦 What’s Inside the Profit and Loss (P&L) Template in Excel
🗂️ 1. Template Sheet (Main P&L Report)
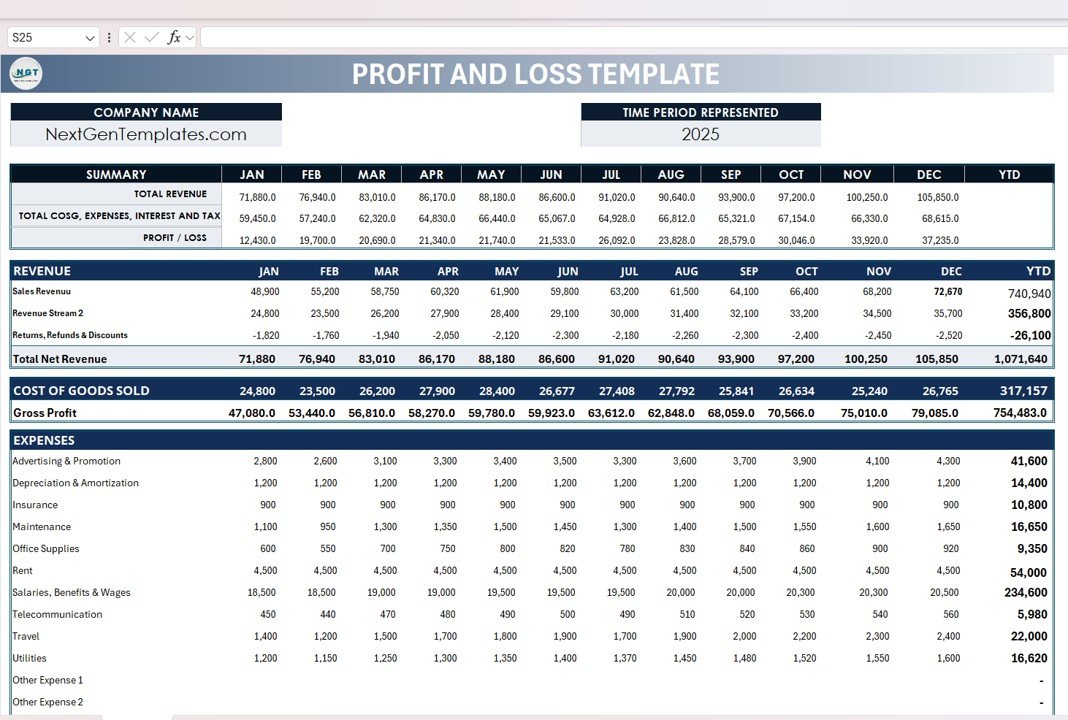
This sheet contains all your financial data organized into clear sections:
A) Company Header
Add your company name, financial year, and website (e.g., NextGenTemplates.com) for a professional look.
B) Summary Section (Monthly + YTD)
Instantly view:
Total Revenue
Total COGS
Total Expenses
Interest & Tax
Profit/Loss (Monthly & YTD)
This top-level summary helps managers quickly assess financial performance.
C) Revenue Section
Input monthly revenue for all streams, including:
Sales Revenue
Service Revenue / Custom Revenue
Returns, Refunds & Discounts
Total Net Revenue
The template automatically calculates YTD totals.
D) Cost of Goods Sold (COGS)
Track monthly COGS components such as:
Materials
Production
Vendor Charges
Other Direct Costs
It calculates Gross Profit using:
Gross Profit = Total Net Revenue – Total COGS
E) Expenses Section
Includes predefined expense categories like:
Advertising & Promotion
Salaries & Wages
Rent
Insurance
Utilities
Travel
Office Supplies
Maintenance
Depreciation & Amortization
Other expenses (with extra rows to add more categories)
F) Earnings & Taxes
All financial calculations are fully automated:
EBIT
Interest Expense
Profit Before Tax
Income Taxes
Profit After Tax
This gives you a complete and accurate financial report every month.
📊 2. Dashboard Sheet (Visual Financial Summary)
This dashboard includes summary cards and charts that provide quick insights such as:
Dashboard Cards Show:
Total Net Revenue
Total COGS
Gross Profit
Total Expenses
EBIT
Net Profit
Dashboard Charts Show:
Revenue by Month – Identify growth patterns & seasonal trends
Expenses by Month – Spot cost spikes & manage budgets better
With this dashboard, you can instantly understand your company’s financial health without manually analyzing long tables.
🎯 Who Can Benefit From This Profit and Loss (P&L) Template in Excel
📈 Small & Medium Businesses
Track financials without complex accounting tools.
💼 Business Owners & Managers
Get accurate numbers to make smarter decisions.
📊 Accountants & Finance Teams
Save hours on calculations and monthly reporting.
🚀 Startups & Entrepreneurs
Monitor cash flow, track profitability, and plan budgets effectively.