
Running a successful e-learning platform is not easy. User activity changes every day, subscription patterns shift monthly, content performance varies by subject, and ratings fluctuate across countries. When you manage all this manually, reports become slow, confusing, and inconsistent. That’s why modern e-learning companies rely on an E-learning Apps Dashboard in Power BI to make smarter, faster, and more data-driven decisions.
This powerful dashboard transforms raw learning data into clean visuals, interactive charts, smart slicers, and real-time insights. Whether you’re an app owner, course creator, online educator, or product strategist — this dashboard gives you full control over user engagement, learning hours, subscription performance, payments, ratings, and global trends. E-learning Apps Dashboard in Power BI It is designed to make decision-making quicker and more accurate.
Here’s everything you will get inside this robust learning analytics dashboard 👇
✨ Key Features of the E-learning Apps Dashboard in Power BI
📊 1. Five Fully Interactive Pages
Includes Overview, App Name Analysis, Country Analysis, Subject Analysis, and Monthly Trends — each offering deep insights into user behavior and app performance.
📈 2. Real-Time KPI Tracking
Monitor key KPIs like total users, active subscriptions, paid percentage, average app rating, and study hours.
🎯 3. Automated & Dynamic Visuals
Power BI refreshes charts, cards, and tables automatically whenever you update your dataset.
🌍 4. Global User Analysis
Compare performance across countries, regions, user types, and subscription levels.
📚 5. Subject-Wise Deep Insights
Understand which subjects drive the highest learning hours, completion rates, and support tickets.
💳 6. Financial Tracking Made Easy
Analyze paid vs pending payments, amount paid by user type, and subscription-based revenue patterns.
📦 What’s Inside the E-learning Apps Dashboard in Power BI
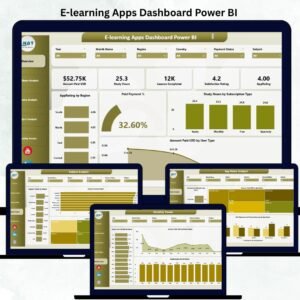
🏠 1. Overview Page — The Core Performance Summary
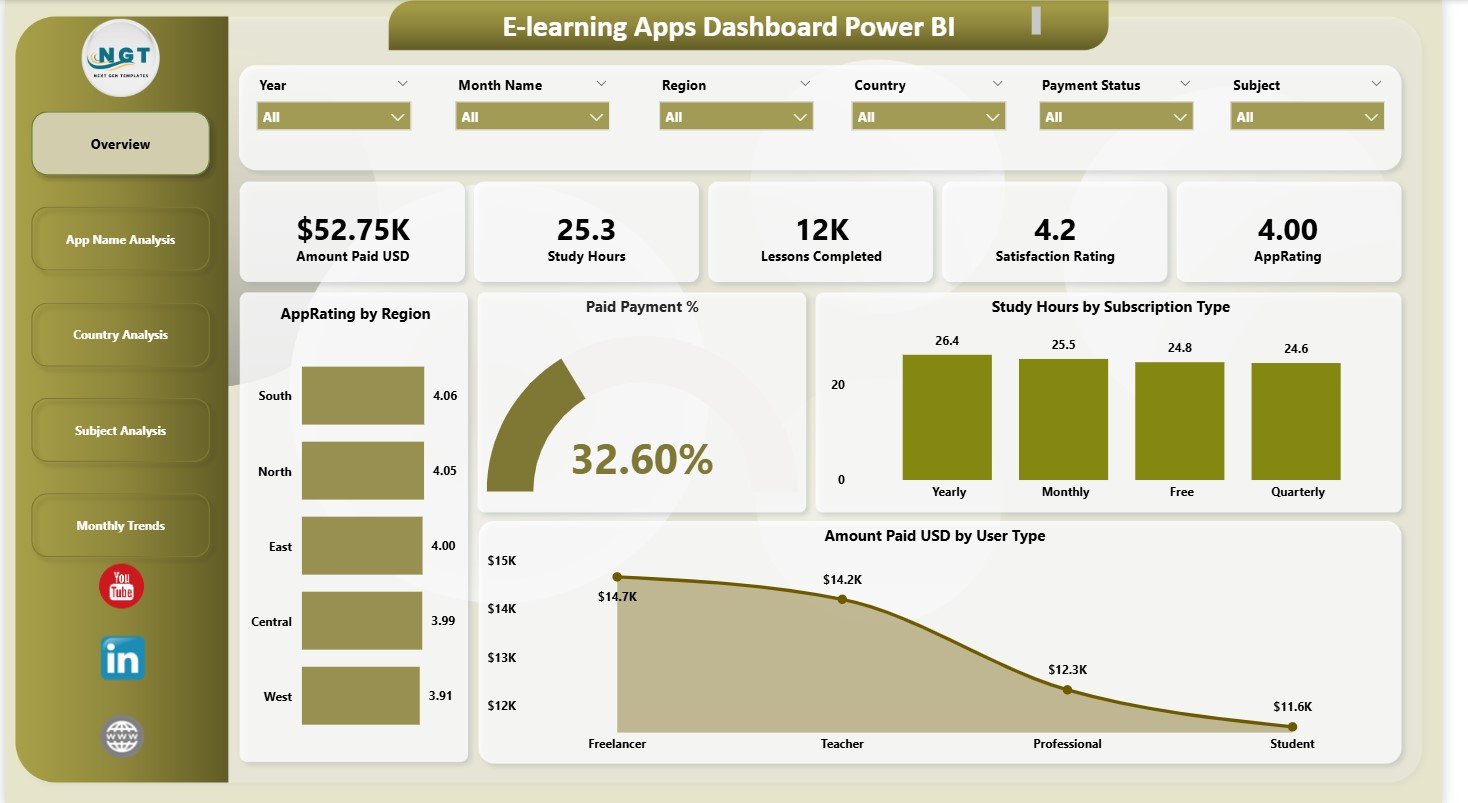
The Overview Page provides a quick snapshot of overall app performance with:
⭐ Five KPI Cards
-
Total Users
-
Active Subscriptions
-
Paid Percentage
-
Average Rating
-
Total Study Hours
These indicators instantly show how your e-learning app is performing.
⭐ Four Key Charts
-
Paid Payment % – Understand how many users have converted into paying customers.
-
Study Hours by Subscription Type – Identify engagement differences across membership plans.
-
App Rating by Region – Discover which regions love your app and where improvement is needed.
-
Amount Paid by User Type – Compare revenue contribution from different learner categories.
This page gives leadership a complete snapshot of operational health.
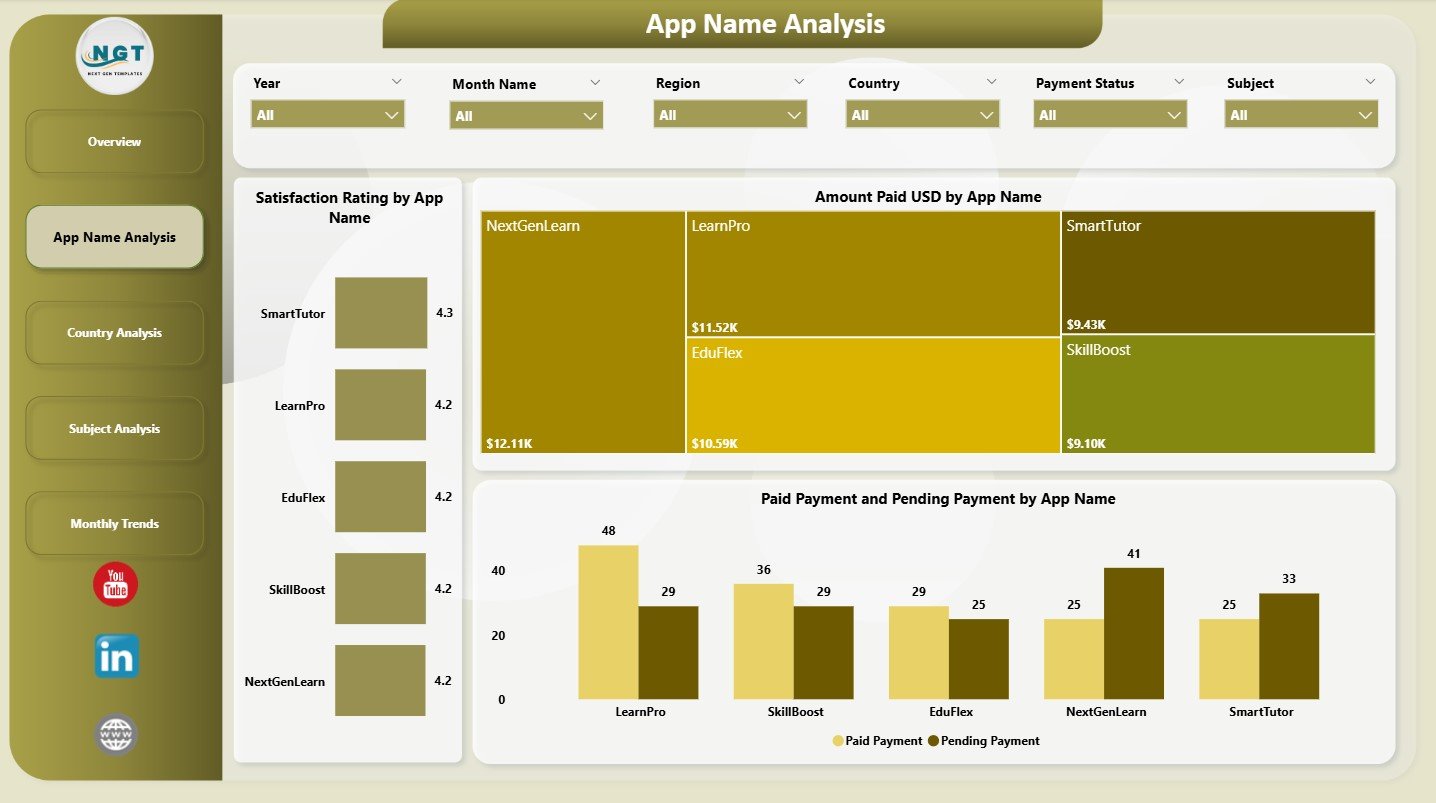
📱 2. App Name Analysis Page — Multi-App Performance Insights
If you manage multiple e-learning apps under one brand, this page is essential.
Charts include:
-
Amount Paid by App Name
-
Rating by App Name
-
Paid vs Pending Payments
Perfect for identifying the best-performing apps and optimizing your product strategy.
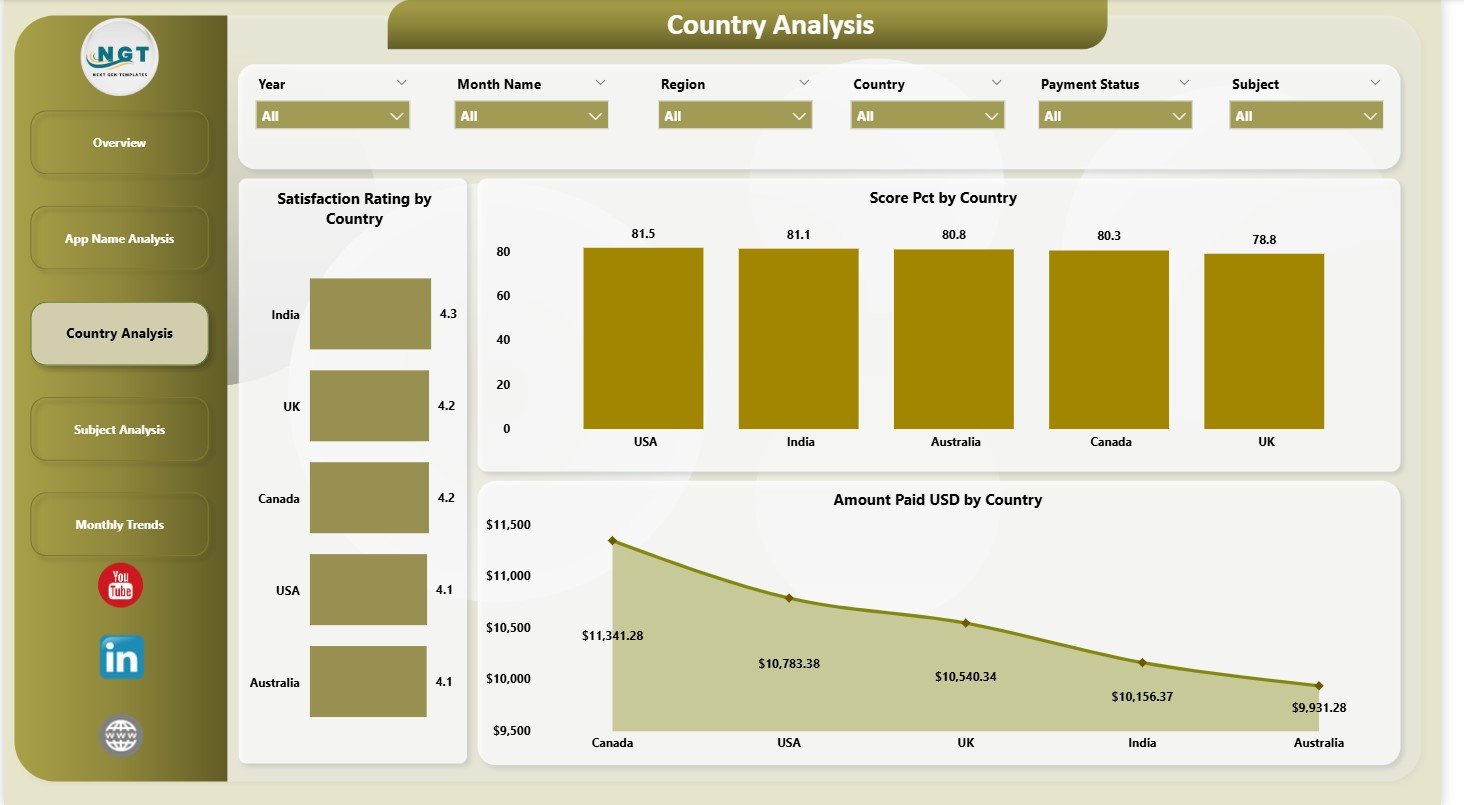
🌍 3. Country Analysis Page — Regional Performance Breakdown
Understand global usage patterns with charts showing:
-
Score Percentage by Country
-
Satisfaction Rating by Country
-
Amount Paid (USD) by Country
Use these insights to target top-performing countries and improve low-performing ones.
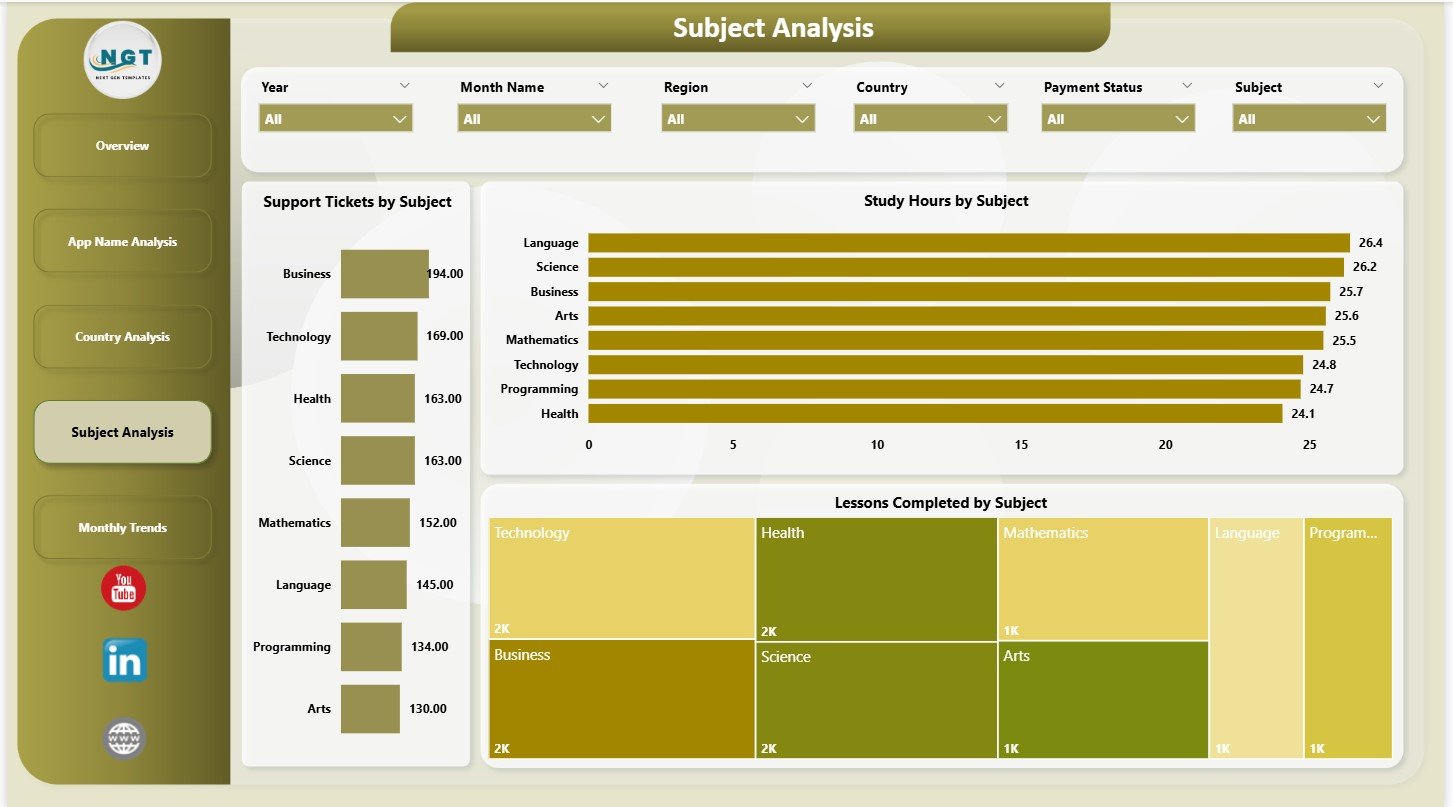
📚 4. Subject Analysis Page — Content Performance Insights
This page helps content creators and educators find what learners love and where they struggle.
Charts include:
-
Study Hours by Subject
-
Support Tickets by Subject
-
Lessons Completed by Subject
Improve your curriculum by identifying subjects with low engagement or high support tickets.
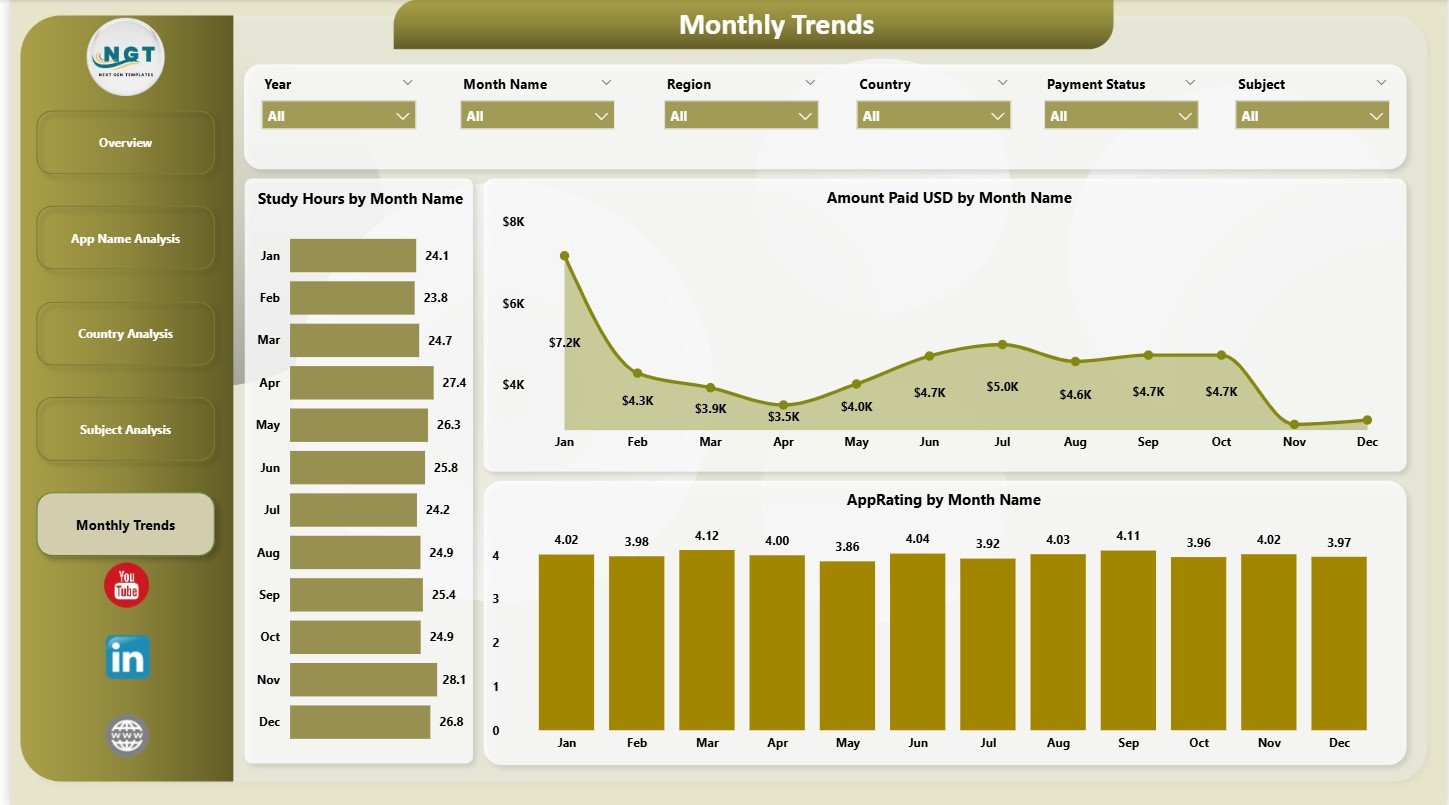
📅 5. Monthly Trends Page — Month-by-Month Insights
View trends across months for:
-
Amount Paid
-
Study Hours
-
App Rating
These insights help you plan promotions, forecast growth, and measure impact of new features.
🧭 How to Use the E-learning Apps Dashboard Power BI
🪄 Step 1: Update the Dataset
Load new payment, usage, rating, and subject data into your Excel or Power BI source file.
🔄 Step 2: Refresh Power BI
All charts and KPIs update instantly.
🔍 Step 3: Use Slicers for Deep Analysis
Filter by month, subject, country, app name, or subscription type.
📈 Step 4: Analyze Trends & Insights
Use the Monthly Trends page to identify seasonal learning patterns and revenue cycles.
💬 Step 5: Share with Teams
Publish the dashboard for marketing, content, customer support, and leadership teams.
🎯 Who Can Benefit from the E-learning Apps Dashboard?
📱 E-learning App Owners
Monitor user activity, revenue, and app performance effortlessly.
🎓 Educators & Course Creators
Improve subjects with low engagement or high support issues.
📈 Product & Marketing Teams
Analyze global patterns, study user behavior, and boost conversions.
🧑💼 Management & Leadership Teams
Get high-level insights to guide strategic decisions.
🧪 Data Analysts
Use automated visuals for faster, accurate reporting.


Reviews
There are no reviews yet.