


Running a dental clinic is challenging when data is scattered across spreadsheets, manual reports, and multiple files. Treatment costs, patient satisfaction, insurance approvals, discounts, specialty performance, and monthly trends must be tracked daily—but without a proper system, teams waste hours searching for information. The Dental Services Dashboard in Power BI solves these challenges instantly. It converts raw dental service data into clean, interactive visuals that give you clarity within seconds.
This ready-to-use dashboard is designed for dental clinics, multi-branch dental groups, and healthcare providers who want full visibility of performance. With dynamic slicers, smart KPI cards, and detailed charts, you can track profit, treatment cost, insurance coverage, monthly patterns, and specialty-wise performance—all in one place. Whether you manage a single branch or multiple locations, this dashboard helps you make smart and confident decisions.
Built entirely in Power BI, this dashboard works with Excel or any data source. Simply refresh your data and watch the entire dashboard update automatically. No coding. No complicated setup. Just plug in your data and analyze your dental business instantly.
⭐ Key Features of Dental Services Dashboard in Power BI
✨ 5 Powerful Analysis Pages – Overview, Tooth Type Analysis, Treatment Analysis, Specialty Analysis, and Monthly Trends.
📊 Smart KPI Cards – View Profit, Insurance Coverage, Patient Satisfaction & Treatment Cost in seconds.
📍 Dynamic Slicers – Filter data by month, region, specialty, tooth type, or treatment type.
💡 Specialty-Wise Insights – Compare orthodontics, cosmetic dentistry, endodontics & more.
💰 Cost, Discount & Profit Analysis – Understand financial performance clearly.
📈 Month-by-Month Trend Tracking – Study growth, cost behavior, and profit cycles.
🦷 Tooth Type Analysis – Track cost, insurance coverage & discounts by tooth category.
⚡ Fully Automated Visuals – The whole dashboard refreshes with a single click.
🧠 Simple, Clean & Easy to Use – Even non-technical users understand insights quickly.
These features make it one of the most powerful reporting tools for dental professionals.
📦 What’s Inside the Dental Services Dashboard in Power BI
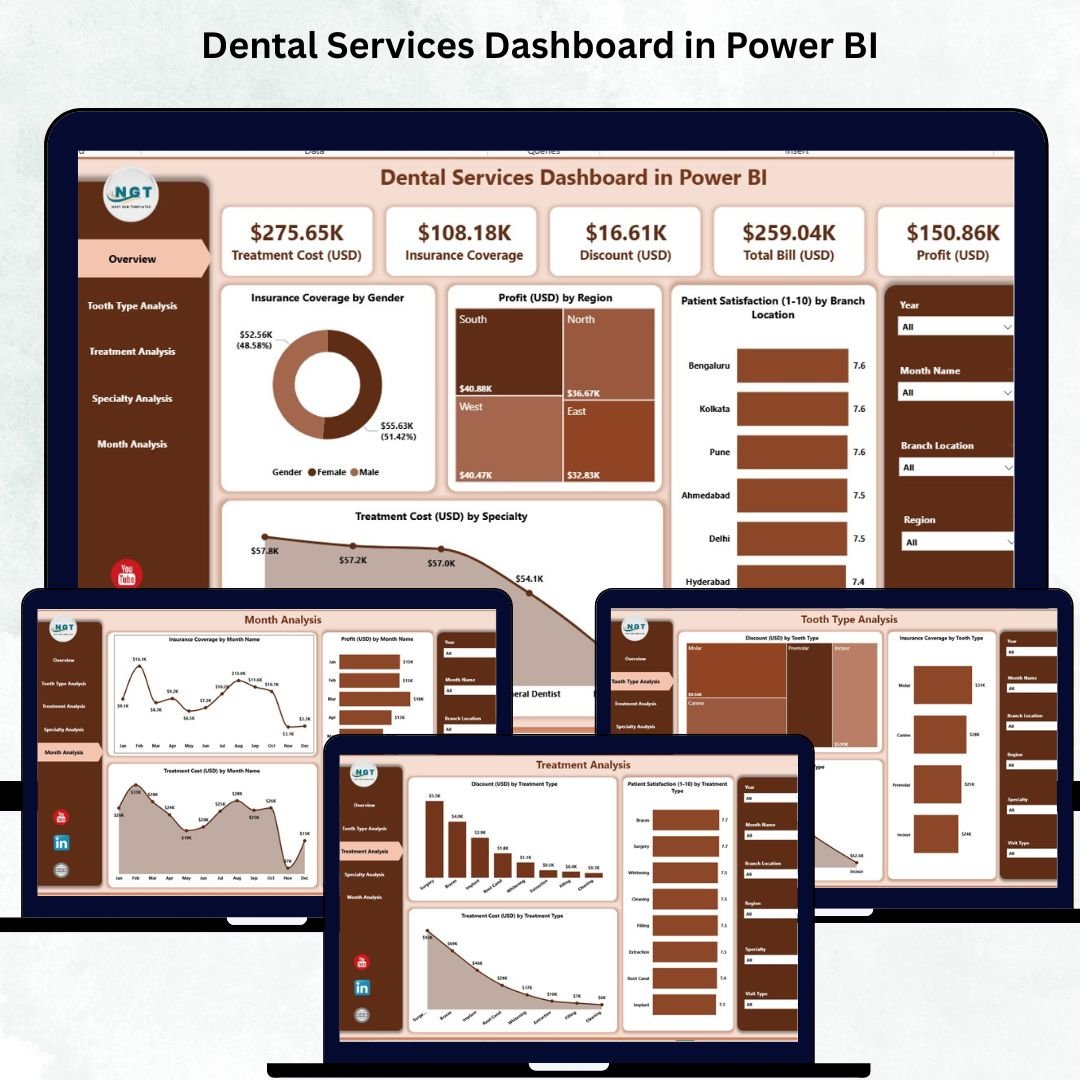
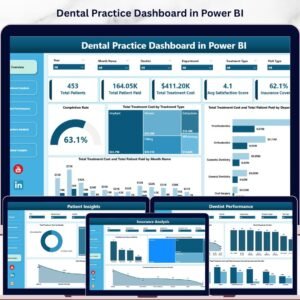
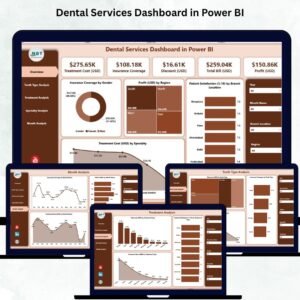
🟦 1. Overview Page – Complete Dental Performance Snapshot
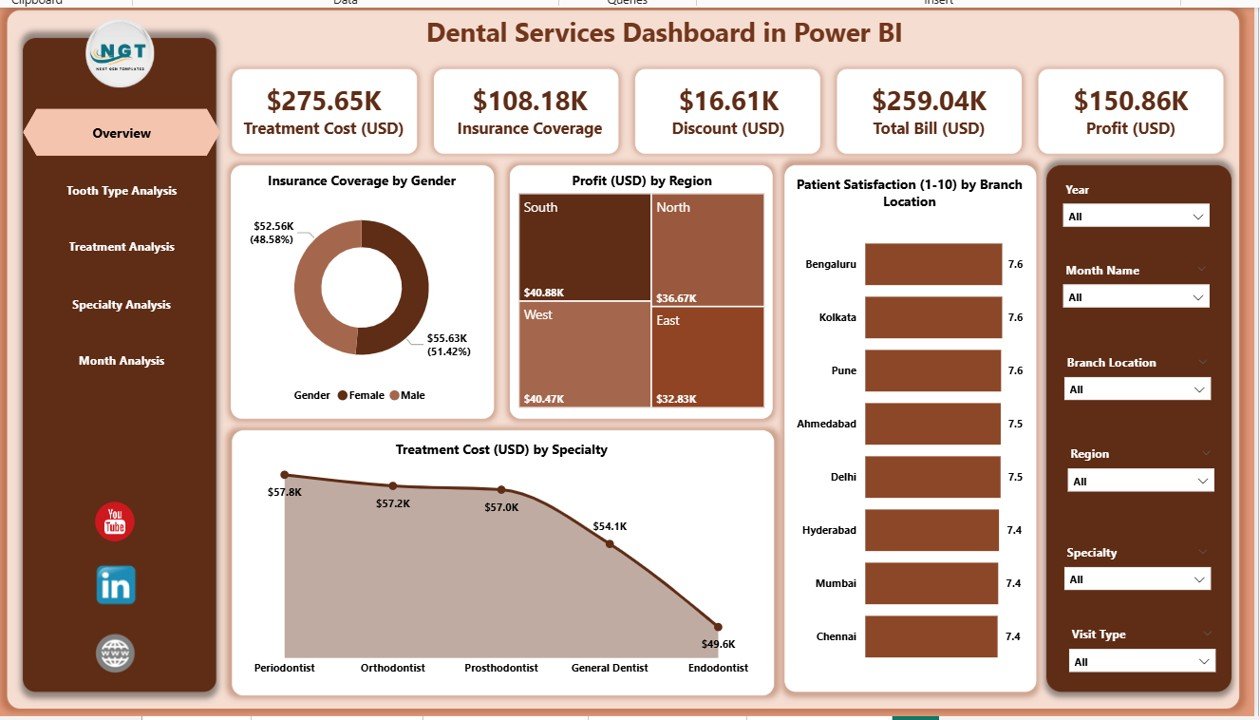
This page displays high-level KPIs and essential charts.
You get:
Four KPI Cards: Patient Satisfaction Score, Total Profit (USD), Insurance Coverage, Treatment Cost
Four Interactive Charts:
✔ Insurance Coverage by Gender
✔ Profit (USD) by Region
✔ Patient Satisfaction by Branch Location
✔ Treatment Cost (USD) by Specialty
This page helps managers understand the clinic’s performance instantly and identify improvement areas quickly.
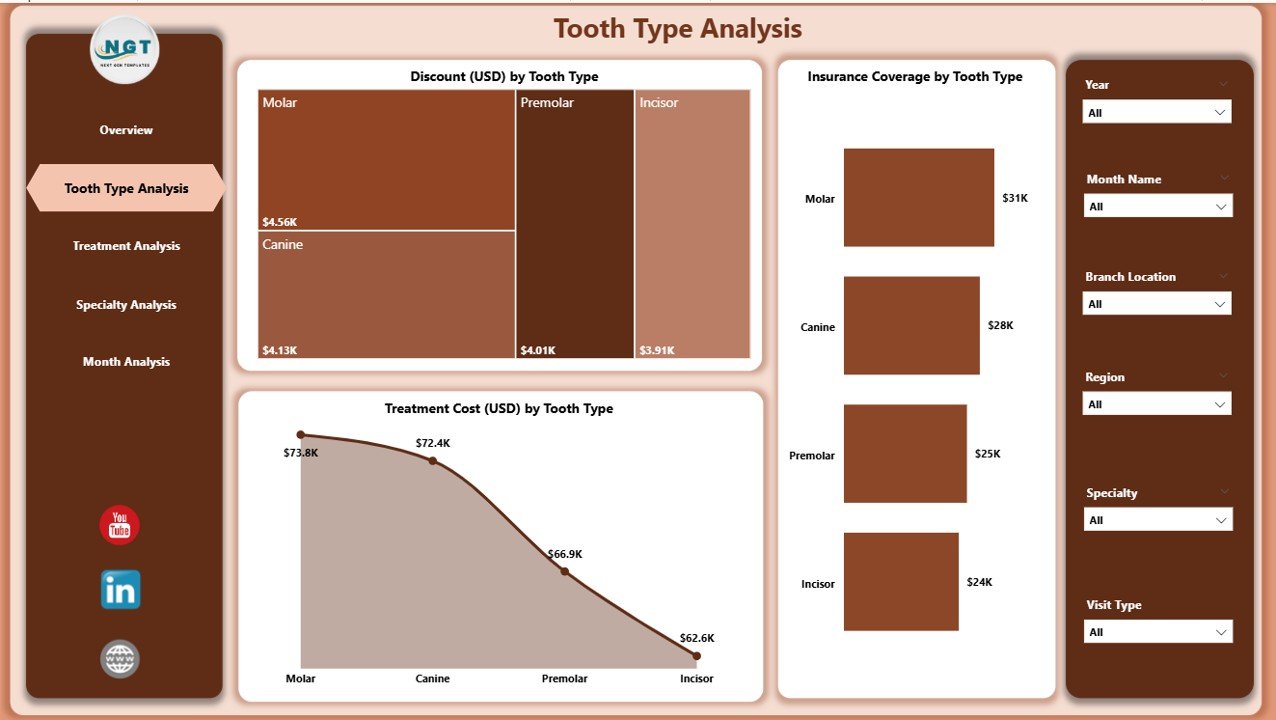
🟧 2. Tooth Type Analysis Page – Cost & Insurance Insights
This page shows how different tooth types influence cost, discounts, and insurance coverage.
Charts include:
Discount (USD) by Tooth Type
Insurance Coverage by Tooth Type
Treatment Cost (USD) by Tooth Type
These visuals help dental clinics plan better pricing, negotiate insurance claims, and identify high-cost treatment areas.
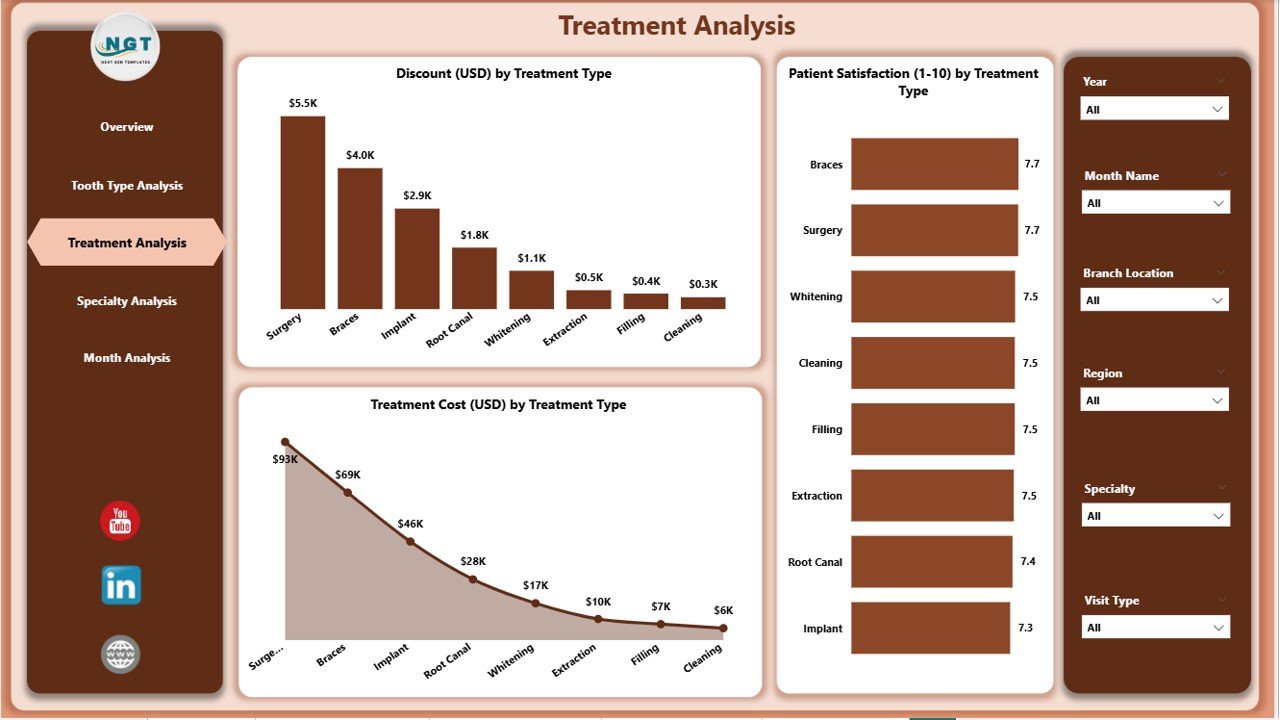
🟩 3. Treatment Analysis Page – Compare Treatment-Wise Performance
Here you can analyze all treatment types such as cleaning, fillings, whitening, root canal, braces, implants, and more.
Charts include:
Discount (USD) by Treatment Type
Patient Satisfaction by Treatment Type
Treatment Cost (USD) by Treatment Type
You immediately understand which treatments are profitable, which require improvement, and which deliver the best patient experience.
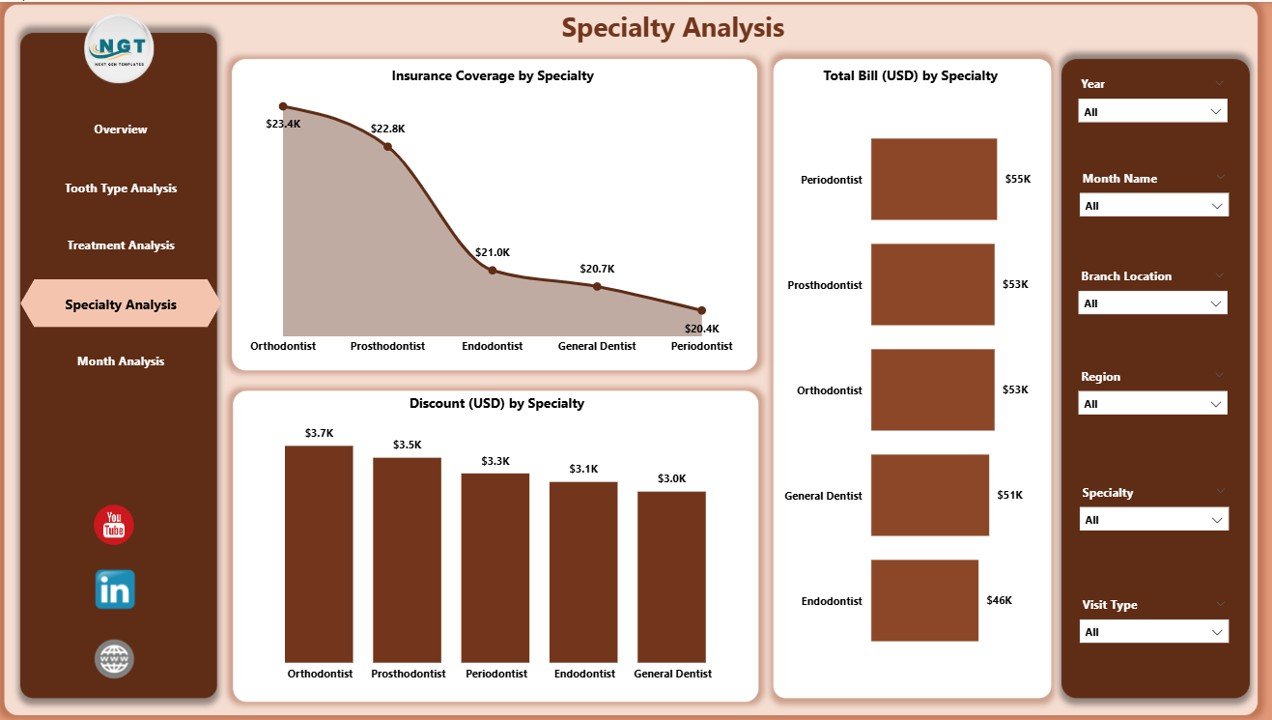
🟪 4. Specialty Analysis Page – Revenue & Insurance Insights
This page compares dental specialties like orthodontics, prosthodontics, pediatric dentistry, endodontics, and cosmetic dentistry.
Charts include:
Insurance Coverage by Specialty
Total Bill (USD) by Specialty
Discount (USD) by Specialty
Managers can optimize specialty pricing, improve resource allocation, and identify top revenue-generating services.
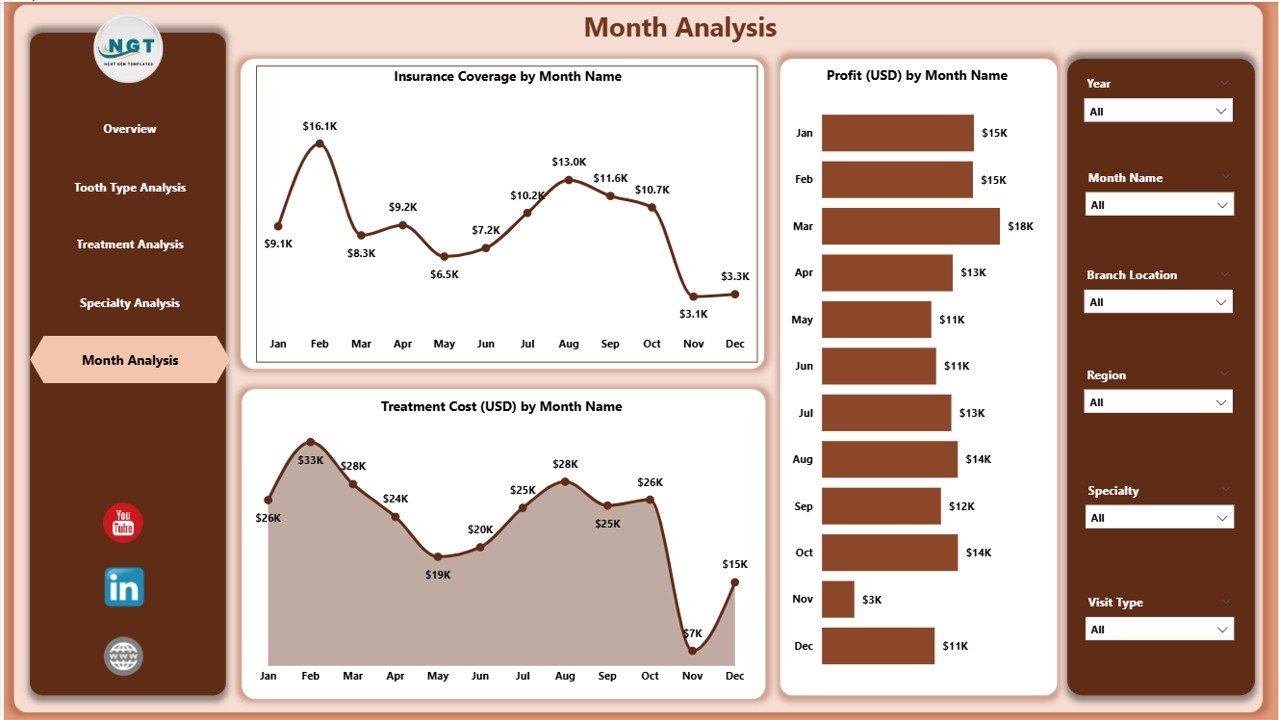
🟨 5. Monthly Trends Page – Track Month-by-Month Performance
This page highlights long-term trends using:
Insurance Coverage by Month
Treatment Cost (USD) by Month
Profit (USD) by Month
It helps you spot seasonal patterns, plan inventory, schedule staff, and plan marketing campaigns effectively.
🧠 How to Use the Dental Services Dashboard in Power BI
1️⃣ Load your updated data into Excel or your data source.
2️⃣ Open Power BI and refresh the dashboard.
3️⃣ Use slicers to explore insights by specialty, tooth type, gender, branch, or month.
4️⃣ Review each page for performance trends and financial patterns.
5️⃣ Share insights with your team for faster and better decision-making.
In just minutes, your raw data transforms into clean, actionable insights.
👥 Who Can Benefit from This Dental Services Dashboard?
🦷 Dental Clinics – Track operations, revenue & satisfaction.
🏥 Multi-Branch Dental Groups – Compare performance across locations.
📊 Healthcare Analysts – Present clean and meaningful visuals.
💰 Finance Managers – Monitor billing, profit & discount behavior.
👨⚕️ Dental Specialists – Understand treatment & specialty trends.
📈 Clinic Owners – Make smarter decisions with real-time insights.
This dashboard is ideal for improving efficiency, boosting profit, and enhancing patient experience.













Reviews
There are no reviews yet.